
India Agriculture Industry Analysis by Mordor Intelligence
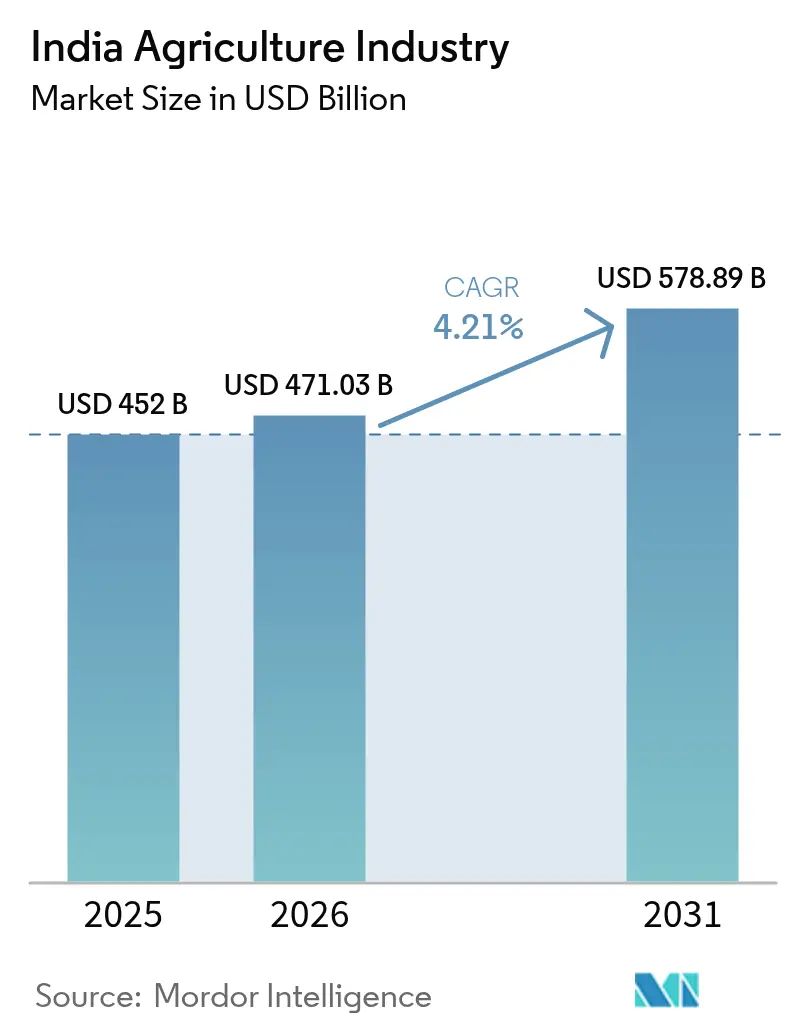
The India agriculture market size is expected to grow from USD 452 billion in 2025 to USD 471.03 billion in 2026 and is forecast to reach USD 578.89 billion by 2031 at 4.21% CAGR over 2026-2031. Strong government spending, broadened credit access, and rapidly growing digital infrastructure are combined to lift productivity and earnings across commodity segments[1]. Digital platforms that link 11 crore farmers to formal finance, subsidies, and advisory services are already cutting transaction costs and improving price discovery. Robust foodgrain output of 354 million tons in 2024-25 reflects favorable monsoon conditions, higher minimum support prices, and wider use of improved seed cultivars[2]. Trade reforms that streamline export certification and expand e-commerce hubs are widening access to premium overseas buyers, even as import substitution missions target edible oils and pulses deficits.
Key Report Takeaways
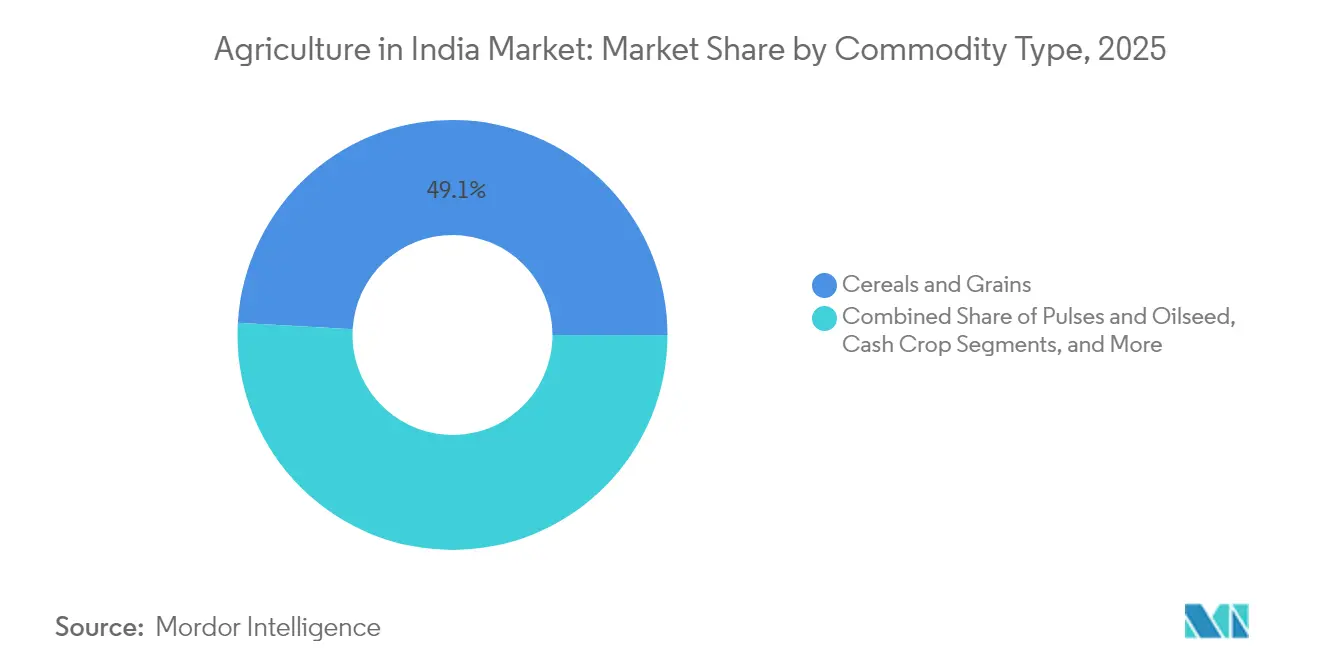
- By commodity type, cereals and grains held 49.10% of the India agriculture market share in 2025, and fruits and vegetables are projected to expand at a 7.42% CAGR from 2026-2031.
Note: Market size and forecast figures in this report are generated using Mordor Intelligence’s proprietary estimation framework, updated with the latest available data and insights as of 2026.
India Agriculture Industry Trends and Insights
Drivers Impact Analysis*
| Driver | (~) % Impact on CAGR Forecast | Geographic Relevance | Impact Timeline |
|---|---|---|---|
| Government support through subsidies and policies | +1.2% | National, with higher impact in Punjab, Haryana, Uttar Pradesh | Medium term (2-4 years) |
| Rising adoption of agri-tech and mechanization | +0.8% | National, with early gains in Maharashtra, Karnataka, Gujarat | Long term (≥ 4 years) |
| Growing demand for organic and sustainable farming | +0.6% | National, with a concentration in urban markets and export zones | Long term (≥ 4 years) |
| Expanding export demand via new trade agreements | +0.5% | National, with a focus on coastal states and border regions | Medium term (2-4 years) |
| Carbon-credit monetization from regenerative farming | +0.3% | National, with pilot programs in 8 states initially | Long term (≥ 4 years) |
| Climate-resilient seed cultivars boosting yields | +0.4% | National, with priority in drought-prone and flood-affected areas | Medium term (2-4 years) |
| Source: Mordor Intelligence | |||
Government Support Through Subsidies and Policies
The Union Budget 2025-26 increased the Kisan Credit Card limit to Rs 5 lakh, unlocking larger working capital lines for smallholders and easing input purchases at critical crop stages. Prime Minister Dhan-Dhaanya Krishi Yojana channels resources to 100 low-productivity districts, bundling irrigation, precision farming training, and risk-mitigation tools. Minimum support price adjustments for 2024-25 favor oilseeds such as nigerseed and sesamum, encouraging diversification into high-value crops. Input subsidies, which account for 73% of the agriculture budget, reduce fertilizer and energy costs, creating a positive cycle of investment, productivity, and rural consumption.
Rising Adoption of Agri-tech and Mechanization
A Rs 6,000 crore allocation for digital agriculture infrastructure is funding AI-based crop surveys, drone-enabled nutrient mapping, and app-based credit scoring, helping farmers access formal loans within 24 hours. National mechanization now stands at 47%; Punjab and Haryana exceed 40-45%, while northeastern states remain largely manual, revealing significant headroom for expansion. The farm machinery market is forecast to grow from USD 16.73 billion in 2024 to USD 25.15 billion by 2029, driven by labor scarcity and better cash flows. Precision tools can boost yields by 30% and cut water and fertilizer use by 15-20%, improving profitability and resource efficiency.
Growing Demand for Organic and Sustainable Farming
Urban consumers are fueling a projected 25.25% CAGR for certified organic products through 2027, rewarding farms that adopt pesticide-free practices and traceability systems. Carbon-credit programs in eight states have issued the country’s first farm-generated credits, delivering a new income stream for regenerative growers[3]. Policy support for natural farming is deepening, with budget incentives for bio-inputs and AI-guided nutrient applications that protect soil microbiomes. Community seed banks preserve climate-resilient indigenous varieties, diversifying genetic resources while reinforcing farmer rights.
Expanding Export Demand via New Trade Agreements
Agricultural exports climbed 6.5% year-on-year to USD 37.5 billion for April-December 2024, defying global volatility. The Foreign Trade Policy 2024 promotes USD 2 trillion total exports by 2030, positioning agri-produce as a flagship contributor through simplified digital documentation and warehousing corridors. Spices recorded 51.01% growth, and coffee showed 40.3% growth in March 2024 shipments, aided by targeted quality and branding programs. Collaboration with Israel on water-efficient farming and tactical rice exports to food-insecure nations demonstrates the sector’s agility in balancing domestic needs with global opportunities.
Restraints Impact Analysis*
| Restraint | (~) % Impact on CAGR Forecast | Geographic Relevance | Impact Timeline |
|---|---|---|---|
| Fragmented landholdings and declining soil fertility | -0.7% | National, with a severe impact in northern and eastern states | Long term (≥ 4 years) |
| Vulnerability to climate change and extreme weather | -0.5% | National, with higher impact in rain-fed areas | Medium term (2-4 years) |
| Inadequate cold-chain and storage infrastructure | -0.6% | National, with acute problems in rural and remote areas | Medium term (2-4 years) |
| Labour shortages from rural-to-urban migration | -0.4% | National, with concentration in high-growth industrial states | Short term (≤ 2 years) |
| Source: Mordor Intelligence | |||
Fragmented Landholdings and Declining Soil Fertility
Small and marginal farms now cover 85% of holdings, with average size falling below 2 hectares, making mechanization and scale efficiencies difficult without shared-service models. Fertility imbalances persist, with excess nitrogen and insufficient phosphorus-potassium inputs weakening soil structure and raising greenhouse-gas emissions. The Soil Health Card Scheme has expanded sampling, yet state-level adoption of balanced nutrient application remains uneven. Custom Hiring Centers that rent tractors and harvesters mitigate fragmentation constraints, though coverage gaps underline the need for expanded service networks.
Inadequate Cold-Chain and Storage Infrastructure
India loses 40% of fresh produce annually, about 40 million tons worth USD 13 billion because only 4% of perishables move through integrated cold chains. Operating costs for cold stores exceed Western norms due to high energy tariffs, limiting smallholder access. The Government plans to invest USD 15 billion over five years, prioritizing renewable-powered facilities and refrigerated container fleets that could cut losses by up to 35%. Roughly 20,000 refrigerated containers valued at USD 0.53 billion are required to match supply with horticulture output, signaling a sizeable opportunity for logistics providers.
*Our forecasts treat driver/restraint impacts as directional, not additive. The impact forecasts reflect baseline growth, mix effects, and variable interactions.
Segment Analysis
By Commodity Type: Cereals and Grains Accelerate, While Fruits and Vegetables Show Growth Potential
Cereals and grains controlled 49.10% of the India agriculture market in 2025. The India agriculture industry size for cereals is projected to advance steadily at the sector’s average CAGR, helped by expanded irrigation and mechanized harvesting. Pulses and oilseeds remain vulnerable to yield fluctuations, prompting a Mission for Aatmanirbharta in Pulses to foster self-sufficiency. Targeted subsidies, climate-resilient varieties, and integrated pest-management programmes are projected to stabilize these sub-segments over the forecast horizon.
Fruits and vegetables form the fastest-growing slice of the India agriculture market, projected to clock a 7.42% CAGR through 2031 as urban diets diversify and export orders climb. Horticulture output rose to 355.2 million tons in 2023-24, including 112.62 million tons of fruit and 204.96 million tons of vegetables. Targeted subsidies, climate-resilient varieties, and integrated pest-management programmes are projected to stabilize these sub-segments over the forecast horizon.

Geography Analysis
Regional disparities shape the India agriculture market, with mechanization, water availability, and market linkages varying sharply across states. Punjab and Haryana post-mechanization rates above 40%, boosting labor productivity and underpinning large grain surpluses for the national buffer stock. In contrast, northeastern states remain largely manual, which constrains the adoption of precision farming and limits the flow of agritech finance. Gujarat leads in total factor productivity thanks to robust extension services, high micro-irrigation coverage, and export-oriented horticulture clusters. Bihar lags despite policy attention, highlighting the complexity of translating subsidies into field-level gains.
Commodity specialization further differentiates state performance. Andhra Pradesh dominates mango and banana output, Maharashtra anchors premium Alphonso mango exports, Gujarat excels in Kesar mangoes, and Karnataka commands pomegranate shipments. Cotton cultivation is concentrated in Gujarat, Maharashtra, and Telangana, together accounting for roughly 65% of the national supply; weather shocks in these states wield disproportionate influence on textile input costs. The Government’s creation of a Makhana Board in Bihar and the commissioning of a new urea plant in Assam illustrate region-specific industrial policy that targets comparative advantages and addresses input shortages.
Climate variability adds another spatial layer: the Indian Meteorological Department projects an above-normal 2025 monsoon with 105% of the long-period average, which should lift kharif sowing in rain-fed belts. Yet unseasonal rainfall damaged rabi crops in Maharashtra, prompting compensation demands of Rs 50,000 per hectare and spotlighting the need for parametric insurance. Digital weather advisories, drought-resistant seed distribution, and decentralized storage hubs are emerging as essential tools to smooth regional volatility and narrow yield gaps within the India agriculture market.
Regulatory Landscape
India's agriculture sector is governed by central policy and state-level market regulation. The Ministry of Agriculture and Farmers Welfare anchors farm programs and subsidy frameworks, while APMCs regulate physical mandis and electronic linkages such as e-NAM. On trade and standards, APEDA and DGFT administer export procedures under the Foreign Trade Policy, and food safety and compliance requirements are enforced through bodies including FSSAI and plant quarantine systems (with DPPQS registration and HACCP-related requirements for certain export corridors).
For 2025-26 to 2026-27, policy focus has leaned toward import substitution and crop diversification. The Union Cabinet-approved Mission for Aatmanirbharta in Pulses (2025-26 to 2030-31) sets a multi-year implementation framework, supported by procurement assurance for Tur, Urad, and Masoor under PM-AASHA (PSS) for up to four years (to 2028-29) at MSP. In July 2026, the National Investment Policy for Urea (NIPU-2026) was approved to facilitate new gas-based urea capacity additions (an additional 10 million tonnes), reinforcing fertilizer self-sufficiency as a regulatory and investment priority alongside farm income stabilization tools such as MSP and targeted missions.
Value Chain Analysis
The India agriculture value chain covers input manufacturing and distribution (seeds, fertilizers, crop protection, irrigation), on-farm production, aggregation (FPOs, traders, cooperatives), and primary handling (sorting, grading, packhouses). It then moves into storage and logistics (warehousing, cold stores, reefer transport) and sales through mandis/APMCs, e-NAM-linked markets, institutional procurement, processors, and organized retail and export channels. Price support and procurement for key staples, with MSP administered for mandated crops, remains a structural feature, while digital market linkages and export compliance (APEDA-led procedures) increasingly shape how produce moves from farm gate to domestic and overseas buyers.
Post-harvest handling remains a pressure point, especially for perishables, where cold-chain penetration is limited and losses are material, keeping storage and logistics capacity a recurring constraint. Value-chain investments and partnerships are increasingly targeting (i) last-mile input access through FPO-centric distribution models (for example, Coromandel International partnering with Samunnati to supply inputs through FPO networks), (ii) scaling biological and specialty inputs via multi-year collaborations (such as INERA and CropNXT to distribute biological agri-inputs across multiple states), and (iii) integrated commodity complexes tied to processing and R&D (such as Godrej Agrovet's announced integrated oil palm complex in Telangana). These efforts aim to improve input quality, traceability, and aggregation efficiency while reducing friction from fragmented landholdings and uneven infrastructure coverage.
Market Opportunities and Future Outlook
A near-term opportunity is the digital public infrastructure build-out for agriculture, since programs are shifting from pilots toward nationwide coverage anchored in AgriStack and the Digital Agriculture Mission. As of February 2026, 7.63 crore Farmer IDs were generated and about 23.5 crore crop plots were digitized, while the Centre announced Rs 13,000 crore in interest-free capex loans for FY27 to accelerate AgriStack. This combination creates whitespace for agri-advisory, input planning, and formal credit enablement that can use verified Farmer IDs and plot-level crop survey data, including AI-enabled advisory layers such as the announced multilingual tool, Bharat Vistar, linked with ICAR practices.
A second opportunity is in irrigation, post-harvest, and integrated value chains that connect high-value crops to domestic and export channels. The Union Budget 2026-27 earmarked Rs 6,587 crore for PMKSY to continue irrigation expansion, while policy messaging and allocations emphasized high-value crops and integrated value chains (Budget 2026-27 agriculture outlay of Rs 1,62,671 crore). On the private side, input and seed capability additions and consolidation, along with FPO-led distribution partnerships, are expanding organized access to quality inputs and planting material (for example, BASF Nunhems expanding its vegetable seed footprint in India via acquisition, and Coromandel-Samunnati scaling input access for FPOs). Together, these initiatives support investment themes around micro-irrigation adoption, export-compliant production, and loss-reduction infrastructure for horticulture-heavy supply chains.
Recent Industry Developments
- July 2026: ADM and Bayer extended their food value chain partnership in Maharashtra, expanding the program's reach to 100,000 soybean farmers across seven districts. The extension scales standardized agronomy and sustainability practices through organized aggregation, supporting more consistent quality and traceability for downstream buyers.
- June 2026: Coromandel International signed an MoU with Samunnati to strengthen agri-input distribution through Farmer Producer Organisation networks. The tie-up leverages Samunnati's FPO ecosystem and Coromandel's rural retail reach, improving last-mile access to inputs and tightening feedback loops between farmers and suppliers.
- June 2024: The Government of India continued to drive digital agriculture rollout through AgriStack and allied digital crop-survey initiatives, formalizing the direction of travel toward plot-level data and interoperable farmer services. The shift supports faster delivery of advisories, credit, and scheme benefits by linking identity and land records with cropping information.
Research Methodology Framework and Report Scope
Market Definition and Coverage
For this study, the India agriculture market is defined as the farm-gate value of domestically produced agricultural output, covering crops and livestock and valued using representative prices and quantities for the base year.
Scope exclusions: Post-farm processing, agro-input manufacturing, and rural financial services are not counted in the market value.
Segmentation Overview
- By Commodity Type
- Cereals and Grains
- Production Analysis
- Consumption Analysis
- Export Analysis
- Import Analysis
- Price Trend Analysis
- Pulses and Oilseed
- Production Analysis
- Consumption Analysis
- Export Analysis
- Import Analysis
- Price Trend Analysis
- Fruits and Vegetables
- Production Analysis
- Consumption Analysis
- Export Analysis
- Import Analysis
- Price Trend Analysis
- Cash Crops
- Production Analysis
- Consumption Analysis
- Export Analysis
- Import Analysis
- Price Trend Analysis
- Cereals and Grains
Data Sources, Market Sizing, and Validation
Desk Research
We start by aligning the India agriculture definitions and data series that can be checked from public sources, then we build a clean historical base for volumes and pricing signals. Sources used include official datasets such as Ministry of Agriculture and Farmers Welfare releases, Directorate of Economics and Statistics crop statistics, and Reserve Bank of India macro indicators, along with trade and price references from FAOSTAT and UN Comtrade.
Next, we add supporting context from company filings, investor presentations, association websites, and reputed press coverage to understand shifts in cropping patterns, livestock output, and realized price movement at the farm gate. A paid subscription for company financials and news intelligence is used selectively to validate large players and unusual year movements, and patent databases are checked when technology adoption claims require a sanity check. The desk sources mentioned here are illustrative only, and many other public references were also used for data collection, validation, and research clarification.
Primary Interviews and Surveys
Inputs from interviews and short surveys with farmers, aggregators, processors, input channel participants, and policy or domain experts are used to stress-test the demand pool and the pricing logic used at farm-gate. For a national market like India, we covered major production belts and validated differences by crop seasons, procurement practices, and local price realization, then we rechecked outliers through follow-up discussions.
Distribution of primary research fieldwork respondents
| Company type | Respondent position |
|---|---|
| Top tier: 36% | CXOs: 22% |
| Mid tier: 42% | Functional/Unit leaders: 26% |
| Smaller Players: 22% | Managers: 52% |
Market-Sizing & Forecasting
Sizing starts from a top-down reconstruction where crop and livestock output volumes are mapped to farm-gate prices and then converted into a single value series for India. To keep the model practical, we use variables such as area sown and yield, monsoon and irrigation indicators, minimum support price movements, farm-gate and wholesale price spreads, and livestock productivity signals (for example, milk yield trends). These inputs help explain how value can move even when volume is stable, and they also help separate short-term price spikes from more durable changes.
The totals are then corroborated with selective bottom-up approximations, such as sampled price per quintal multiplied by marketed surplus for key crops, and channel checks on procurement volumes for high-share categories. This helps adjust for gaps where official series are delayed or revised. For forecasting, scenario analysis is used around rainfall variability, input cost inflation, and policy-linked procurement intensity, and the final path is aligned to what primary respondents see as realistic over the next few seasons. Where bottom-up checks are incomplete, we scale using category weights anchored to production shares and reviewed again during validation.
Data Validation & Update Cycle
We run consistency checks across independent signals, including production growth versus price indices, trade flows versus domestic availability, and sudden shifts versus known policy or weather events in India. If a variance looks unusually high, the driver is isolated, the assumption is revisited, and respondents are re-contacted to confirm whether the move is structural or temporary.
Before sign-off, the model goes through multi-step analyst review so calculation logic, unit conversions, and currency timing are verified, and then the narrative is aligned to the final numbers. Reports are refreshed annually, and interim updates are made when material events occur, such as major policy changes or abnormal monsoon outcomes. Right before delivery, a final pass is completed so clients receive the most current version available.
Mordor Intelligence's India Agriculture Market Size Versus Other Published Estimates
Published market values for India agriculture can look far apart because different authors mix farm output with adjacent value-chain revenues, and they also pick different base years and currency conventions. Differences also come from how pricing is treated, since some models use wholesale or processed prices, which can inflate the value beyond what farmers actually realize.
Some external estimates appear to bundle agriculture with agri-inputs, equipment, and warehousing type services, which naturally lifts the total. For Mordor Intelligence, the market is counted only at farm-gate for domestically produced crops and livestock, and post-farm processing and agro-input manufacturing are excluded so totals stay linked to harvested volumes and farm-level prices.
Benchmark comparison
| Source | Market Size | Gaps in Research Methodology |
|---|---|---|
| Mordor Intelligence | USD 452 B (2025) | |
| Industry Research Publisher A | USD 479.67 B (2025) | The published coverage appears broader and references areas such as equipment, fertilizers, pesticides, and warehousing, which can add non-farm-gate revenues into the total and increase the stated market value. |
| Industry Research Publisher B | USD 372.94 B (2024) | This estimate is anchored to an earlier year and may reflect a different price base or currency conversion timing, and the scope notes do not clarify whether farm-gate or wholesale pricing is used, which can lower the starting value. |
The spread across the three figures is mainly explained by scope and price-point choices, followed by year selection and currency timing. When the sizing is kept close to farm-gate output and is cross-checked with production, seasonality, and policy signals, the result stays easier to interpret and repeat for planning and budgeting use cases.
Key Questions Answered in the Report
What is the projected value of the India agriculture market by 2031?
The India agriculture market is expected to reach USD 578.89 billion by 2031, growing at a 4.21% CAGR.
Which commodity segment currently dominates the India agriculture market?
Cereals and grains dominate with a 49.10% share in 2025 due to robust public procurement and strong domestic demand.
Why are fruits and vegetables the fastest-growing segment?
Urban dietary shifts, export opportunities, and government support for horticulture are forecast to drive a 7.42% CAGR for fruits and vegetables between 2026 and 2031.
What are the main factors restraining growth in the India agriculture market?
Fragmented landholdings, declining soil fertility, inadequate cold-chain infrastructure, and climate-related weather shocks collectively weigh on long-term growth.
How is the government supporting small farmers’ access to finance?
The Kisan Credit Card limit was raised to Rs 5 lakh in the 2025-26 budget, while digital farmer IDs streamline loan disbursement and subsidy delivery.