
Tanzania Agriculture Market Analysis by Mordor Intelligence
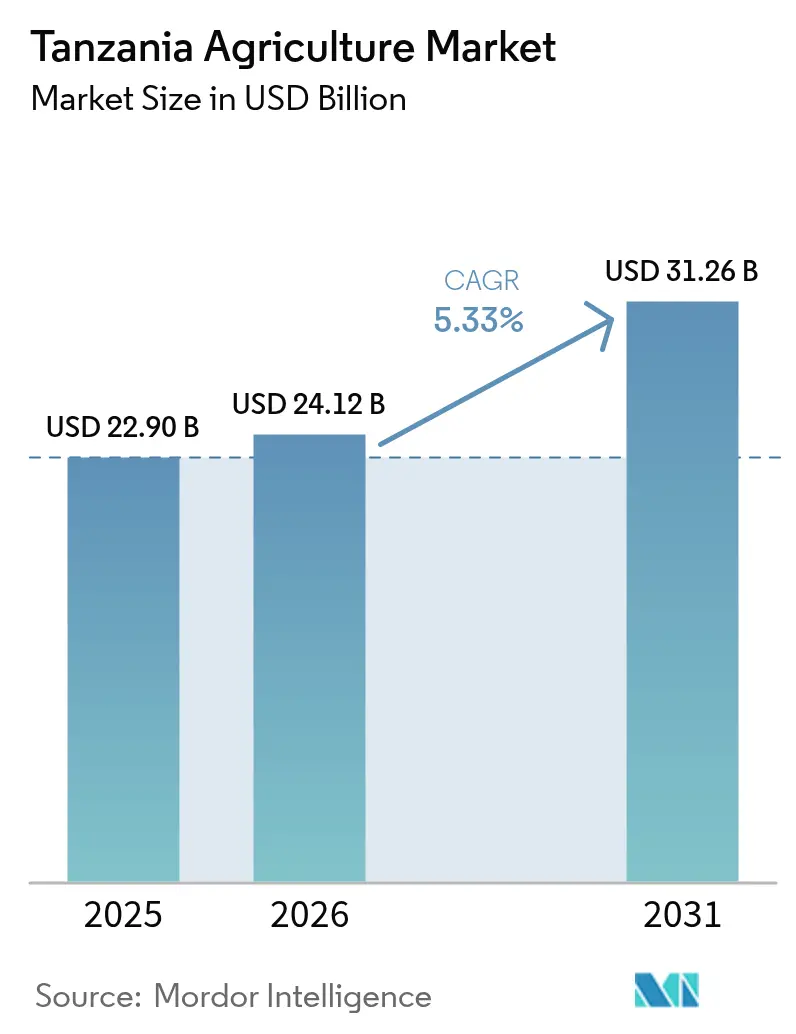
The Tanzanian agriculture market size is expected to grow from USD 22.9 billion in 2025 to USD 24.12 billion in 2026 and is forecast to reach USD 31.26 billion by 2031 at 5.33% CAGR over 2026-2031. Government outlays through the Agricultural Sector Development Programme (ASDP) and allied donor finance are modernizing farming systems, accelerating irrigation expansion, and promoting youth engagement[1]. Tanzania’s 128% food self-sufficiency permits surplus exports across the East African Community (EAC), while policy incentives target a shift from raw commodity sales toward in-country processing, most visibly in cashews. Foreign direct investment in agro-industrial parks and block-farm schemes is also reshaping production hubs, though infrastructure shortfalls and climate volatility remain pronounced headwinds.
Key Report Takeaways
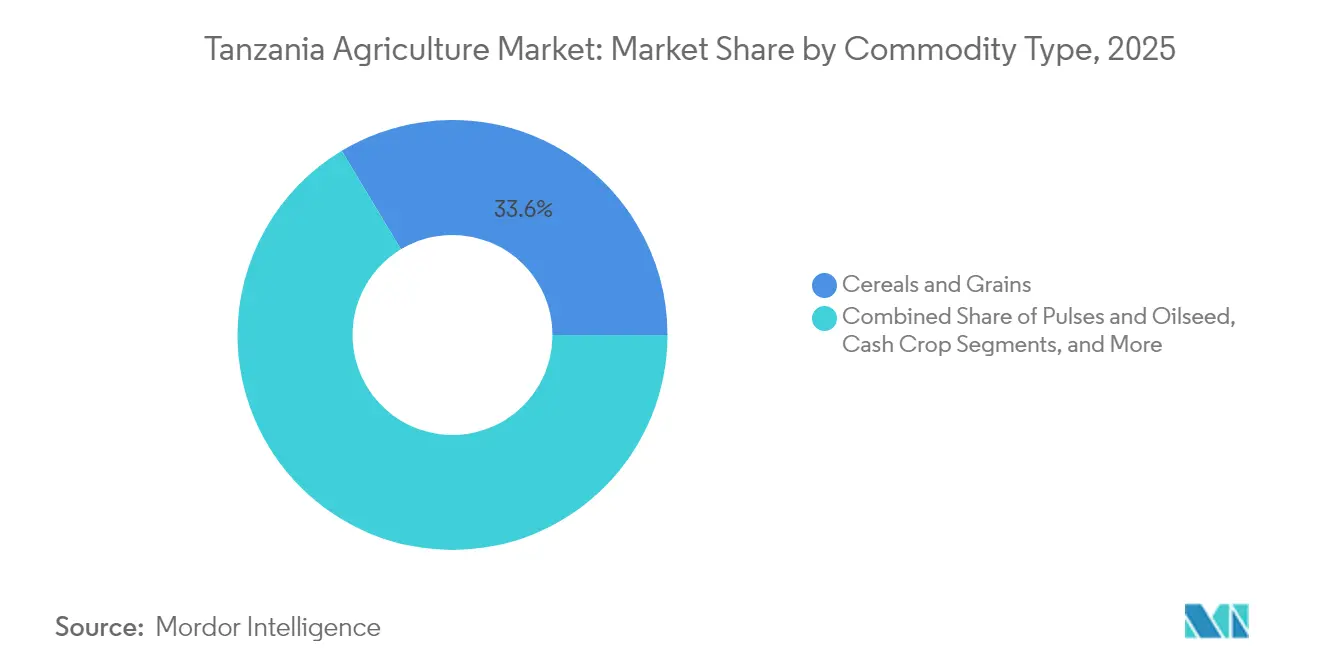
- By commodity type, cereals and grains led with 33.62% of Tanzanian agriculture market share in 2025, while fruits and vegetables are projected to advance at a 11.35% CAGR through 2031.
Note: Market size and forecast figures in this report are generated using Mordor Intelligence’s proprietary estimation framework, updated with the latest available data and insights as of 2026.
Tanzania Agriculture Market Trends and Insights
Drivers Impact Analysis*
| Driver | (~) % Impact on CAGR Forecast | Geographic Relevance | Impact Timeline |
|---|---|---|---|
| Government investments and ASDP rollout | +1.2% | National, with priority regions including the Southern Highlands and the Coastal zones | Medium term (2-4 years) |
| Expanding demand for staple and cash crops | +0.8% | Global export markets, regional EAC trade corridors | Long term (≥ 4 years) |
| Rapid uptake of mobile-enabled extension and fintech | +0.6% | Rural areas with mobile network coverage, concentrated in the Dar es Salaam and Dodoma regions. | Short term (≤ 2 years) |
| EU phytosanitary alignment opening premium export channels | +0.4% | Export-oriented regions, including Mtwara, Lindi, and Ruvuma, for cashews | Medium term (2-4 years) |
| Climate-smart irrigation funding via the Green Climate Fund | +0.7% | Semi-arid regions, including Simiyu, Dodoma, and Tabora | Long term (≥ 4 years) |
| Rise of contract farming and commodity exchanges | +0.5% | Commercial farming zones and areas with established value chains | Medium term (2-4 years) |
| Source: Mordor Intelligence | |||
Government Investments and ASDP Rollout
ASDP Phase II channels public finance into fertilizers, certified seed, and mechanization, directly reversing years of underinvestment. The program anchors the broader Kilimo Kwanza framework and has already raised national fertilizer usage, a move credited with Tanzania’s food self-sufficiency target. Revival of the Tanzania Fertilizer Company underscores the intent to stabilize input pricing, while the ruling CCM’s 2025–2030 manifesto commits to higher producer prices for cashews, coffee, and cotton. Priority spending covers feeder-road upgrades, grain storage, and on-farm solar pumps, all of which link remote growers to markets.
Expanding Demand for Staple and Cash Crops
Agricultural exports reached USD 2.9 billion in Q4 2024, buoyed by coffee, tobacco, and cotton price rallies. Coffee earnings jumped 41.38% year-on-year to USD 227.9 million, while tobacco sales climbed 90.68% to USD 340.41 million. Emerging products such as sunflower seed cake and chilies have opened fresh corridors into China, and avocado shipments are gaining momentum following government-financed pack-houses[2]. EAC trade value grew 13.3% in 2024 to 1.825 trillion Tanzanian shillings as regional food shortages lifted import demand.
Rapid Uptake of Mobile-Enabled Extension and Fintech
Platforms like eKichabi v2 deliver agronomic tips and price data via both USSD and Android, reaching households lacking smartphones. Complementary fintech offerings from Laina Finance and Mipango Finance target women farmers, easing the gender credit gap. The Tanzania Mercantile Exchange’s zero-data-cost portal allows smallholders to sell crops without middlemen. AI-driven services from Kilimo Fresh report 27% yield gains and 35% pesticide cuts, echoing early digital dividends.
EU Phytosanitary Alignment Opening Premium Export Channels
The EU lifted its ban on Tanzanian bitter gourd after authorities demonstrated compliance with traceability and pesticide limits. Ninety-two EU firms already invest in Tanzanian floriculture, horticulture, and beverage crops, giving local exporters ready distribution. The MARKUP initiative links small and medium enterprises to EU buyers, and agri-food shipments from the EAC into Europe grew 7.7% in 2021, with coffee, tea, and spices up 35.5%. Firms such as Viridium TZ upgraded into cardamom processing after securing EU certifications and now sell at premium differentials.
Restraints Impact Analysis*
| Restraint | (~) % Impact on CAGR Forecast | Geographic Relevance | Impact Timeline |
|---|---|---|---|
| Poor rural roads and cold-chain coverage | -0.9% | Rural areas nationwide, particularly remote farming regions | Long term (≥ 4 years) |
| Volatile rainfall and El Niño frequency spikes | -0.7% | Rain-dependent regions, concentrated in central and northern Tanzania | Short term (≤ 2 years) |
| Land tenure uncertainty amid the BBT block-farm program | -0.5% | Areas designated for block farming, primarily in the Southern and Eastern regions | Medium term (2-4 years) |
| Sub-scale local processing capacity for perishables | -0.6% | Processing hubs and areas with high perishable production | Medium term (2-4 years) |
| Source: Mordor Intelligence | |||
Poor Rural Road and Cold-Chain Coverage
Tanzania’s rural road density trails regional peers, leaving many villages reachable only during dry seasons. Perishable crops suffer 30–40% post-harvest losses, yet the country operates fewer than 50 cold stores compared with Kenya’s 7,000. The World Bank places the investment gap above USD 3 billion. Local grants, co-funded by the EU and Sweden, finance small bridges and pack sheds, but scale remains inadequate for horticulture’s growth trajectory.
Volatile Rainfall and El Niño Frequency Spikes
Roughly 75% of the output depends on rainfall. The 2024–2025 wet-season forecast forced authorities to draft drought mitigation and early-warning protocols. Projections suggest maize yields may drop 8–13% by 2050 if adaptation stalls, shaving 4% from GDP and pushing 2.6 million Tanzanians below the poverty line. GCF irrigation schemes and drought-resistant seed programs aim to cushion these shocks.
*Our forecasts treat driver/restraint impacts as directional, not additive. The impact forecasts reflect baseline growth, mix effects, and variable interactions.
Segment Analysis
By Commodity Type: Cereals Lead While Fruits Drive Innovation
Cereals and grains accounted for 33.62% of the Tanzanian agriculture market share in 2025, confirming their centrality to staple diets and national reserves. Maize output hit 5.9 million metric tons in 2023 courtesy of seed subsidies, yet average fertilizer use trails regional benchmarks at 9 kg/ha. Rice yields have improved through International Rice Research Institute partnerships that distribute high-yield varieties across Southern Highlands paddies. Wheat cultivation, though modest, is inching upward in cooler highlands, while sorghum and millet maintain relevance in drought-prone central belts. Simultaneously, pulses and oilseeds gain policy favor because domestic sunflower oil meets only 30–45% of edible oil demand.
Fruits and vegetables recorded a 11.35% CAGR outlook to 2031, the fastest among all groupings. Government support for avocado pack-houses, chili processing lines, and mobile disease-diagnosis apps is accelerating the segment’s modernization. Banana orchards battle Fusarium Wilt and Black Sigatoka, prompting trials of convolutional neural network apps that diagnose infections at 90% accuracy.

Geography Analysis
Regional contrasts shape the Tanzanian agriculture market across its diverse agroecologies. The Southern Highlands around Mbeya and Iringa supply almost 40% of maize and host expanding wheat farms. Cooler elevations and comparatively better trunk roads attract combine-harvester contractors and warehouse investors. Despite that advantage, land degradation affects 19 million people and continues to erode topsoil, compelling renewed focus on conservation tillage and contour farming.
The Coastal zone, comprising Mtwara, Lindi, and Ruvuma, produces more than 90% of the national cashews. Here, the BBT block-farm model is poised to reorganize production into export-oriented estates. Cold-store deficits still hamper high-quality kernel output, but investments under the Egyptian Industrial City promise refrigerated logistics and shell-waste bioenergy plants. Zanzibar’s spice-dominated system generated a 13.3% trade-value lift in 2024 to 1.825 trillion shillings, underscoring island-economy specialization.
Central semi-arid regions such as Dodoma and Singida present the country’s largest climate-resilience laboratory. The Simiyu Climate Resilient Project channels USD 196.1 million into piped water and drip kits, directly benefiting 3 million residents. Solar-powered pumps now irrigate cucumbers and okra in Mpwapwa, illustrating the viability of smallholder horticulture under erratic rainfall.
Regulatory Landscape
Tanzania's crop sector is overseen primarily by the Ministry of Agriculture, with commodity-specific supervision carried out through boards such as the Cashewnut Board of Tanzania, Tanzania Coffee Board, Tanzania Cotton Board, Tanzania Tobacco Board, Sugar Board of Tanzania, Tea Board of Tanzania, and Tanzania Sisal Board. Input markets fall under dedicated frameworks, including the Fertilizer Act (R.E. 2023) administered by the Tanzania Fertilizer Regulatory Authority (TFRA) for dealer registration, permitting, and quality control, and the Seeds Act (Cap. 308, R.E. 2023) covering seed standards, production, processing, and distribution.
For cross-border and domestic quality assurance, the Tanzania Bureau of Standards (TBS) runs the Pre-Shipment Verification of Conformity (PVoC) regime, which requires a Certificate of Conformity for many imported goods. Import compliance tightened further through the Standards (Imports Registration and Batch Certification) (Amendment) Regulations, 2025. The updates introduced a two-week pre-shipment documentation requirement and penalties for non-compliance, increasing the need for regulatory readiness among input suppliers, machinery importers, and agri-processing projects dependent on imported equipment.
Value Chain Analysis
Tanzania's crop value chain starts with inputs (certified seed, fertilizer, crop protection, irrigation and mechanization services) supplied through private dealers and regulated entities, then moves into predominantly smallholder production (with aggregation via cooperatives, traders, and contract farming). Primary marketing routes include village assemblers and wholesale markets, alongside more structured trading channels such as the Tanzania Mercantile Exchange. Downstream activities extend to storage, milling, edible-oil crushing, cashew processing, and fresh-produce packing for both domestic and export markets. Spatial planning is increasingly organized around Agricultural Growth Corridors of Tanzania (AGCOT), which function as the delivery vehicle for infrastructure, aggregation, and commercialization priorities under national planning.
Post-harvest handling and logistics remain a key constraint. Storage shortfalls drive major losses, estimated around 40% for general crops and higher for perishables, while cold-chain and cargo limits at gateways such as Julius Nyerere International Airport, and limited cargo capability at Songwe Airport, constrain higher-value horticulture flows. Recent large-scale investment announcements point to continued upgrades to midstream infrastructure and processing, including irrigated-farming platforms and grain storage systems, but performance still depends on feeder-road connectivity, dependable power for cold rooms, and warehousing and quality-control systems that can scale commercially.
Market Opportunities and Future Outlook
Opportunities are concentrated where policy and capital programs are pushing commercialization and value addition rather than raw commodity sales. Corridor-led investment under AGCOT, aligned to the Agriculture Transformation Master Plan (AMP) 2050 and supported through recent budget priorities, creates room for aggregation, warehousing, and processing capacity around high-volume staples such as maize and rice, as well as import-substitution categories including edible oils, where domestic sunflower oil still covers only part of national demand. Budget emphasis in 2026/2027 on the Building a Better Tomorrow (BBT) initiative, including expansion to additional councils, also supports bankable demand for bundled services (land preparation, irrigation kits, certified seed, and extension), particularly as block-farm and youth agribusiness models are rolled out.
Export-linked investment provides an additional driver for cold-chain, compliance, and pack-house capacity. Market access and standards alignment already influence trade outcomes, including EU phytosanitary compliance actions that reopened specific produce channels. Demand-side openings also shape procurement, including China's May 2026 zero-tariff policy for commodities from a broad set of African countries, which covers several Tanzania-relevant crops (including sesame and cashew). There is also investable space in on-farm and advisory technology, including AI-enabled crop-health tools (AI4CropHealth) deployed across districts such as Kilosa and Mvomero, alongside mobile-enabled extension and trading services that support input optimization, traceability, and quality assurance, linking smallholders into higher-spec domestic and export value chains.
Recent Industry Developments
- July 2026: MeTL Group finalized a procurement and construction contract worth over EUR 2 million with Italy-based AGI EMEA for industrial grain silo infrastructure at its Bandari facility. The investment strengthens storage and handling capacity, supporting tighter quality control and reducing post-harvest losses in traded cereals and grains.
- February 2026: Al Dahra Group signed an MoU with the Tanzania Investment and Special Economic Zones Authority (TISEZA) for a USD 100 million investment tied to large-scale, irrigation-based commercial farming and associated supply-chain infrastructure. The agreement expands irrigated production platforms and professionalized off-take channels, with implications for input demand, aggregation, and downstream processing utilization.
- October 2025: PASS Trust and the Royal Norwegian Embassy launched a USD 4.8 million Soybean Value Chain Support Project (2025-2028) in the Ruvuma Region. The program targets value-chain financing and farmer commercialization, reinforcing the shift toward structured credit and aggregation models for oilseeds and related processing ecosystems.
Research Methodology Framework and Report Scope
Market Definition and Coverage
For this study, the market is the farm gate value generated in Tanzania from cultivating major crops and cereals, where volumes are priced using consistent assumptions to reflect what farmers receive.
Scope exclusions: Live animal production and fisheries are excluded to keep the model aligned to crop-focused reporting.
Segmentation Overview
- By Commodity Type
- Cereals and Grains
- Production Analysis
- Consumption Analysis
- Export Analysis
- Import Analysis
- Price Trend Analysis
- Pulses and Oilseed
- Production Analysis
- Consumption Analysis
- Export Analysis
- Import Analysis
- Price Trend Analysis
- Fruits and Vegetables
- Production Analysis
- Consumption Analysis
- Export Analysis
- Import Analysis
- Price Trend Analysis
- Cash Crop
- Production Analysis
- Consumption Analysis
- Export Analysis
- Import Analysis
- Price Trend Analysis
- Cereals and Grains
Data Sources, Market Sizing, and Validation
Desk Research
Desk research was used to anchor the model to public, repeatable data series that explain how crop output and pricing move over time. We mainly rely on sources such as FAOSTAT, Tanzania National Bureau of Statistics releases, Bank of Tanzania macro tables, and Ministry of Agriculture publications that track crops, area, and yields.
To pressure test trade-linked crops and price signals, additional context was taken from sources such as UN Comtrade, World Bank commodity and macro indicators, and selected peer reviewed agronomy papers that explain yield shifts and input response. Company annual reports, investor decks, and reputable local and regional news were also reviewed for on-ground signals on procurement, storage, and processing activity, with selective use of paid subscriptions for company financials and a shipment-level import-export database when the public trail was thin. These examples are not exhaustive, and many other sources were reviewed for data collection, validation, and clarification.
Primary Interviews and Surveys
We speak with growers, processors, traders, exporters, wholesalers, and public-sector specialists in Tanzania. Their input helps clarify farm-gate prices, crop flows between production areas and buyers, seasonal losses, trade routes, and the share of output sold unprocessed. We compare responses with desk evidence and follow up on mismatches before final assumptions and results are triangulated.
Distribution of primary research fieldwork respondents
| Company type | Respondent position |
|---|---|
| Top tier: 30% | CXOs: 15% |
| Mid tier: 50% | Functional/Unit leaders: 30% |
| Smaller Players: 20% | Managers: 55% |
Market-Sizing & Forecasting
Sizing starts with a top-down reconstruction of Tanzania crop value at the farm gate, where crop-wise production volumes are paired with a consistent price basis and then summed to the national total. The result is then checked using selective bottom-up approximations, such as sampled crop prices by region, sanity checks on marketed surplus versus own consumption, and cross-checks against trade and processing signals for crops that enter formal channels.
Inputs that matter in this market include harvested area and yield trends for key cereals, rainfall pattern impacts on output, fertilizer and improved seed use that shifts yield bands, farm gate price movements and seasonality (including post-harvest price softening), and trade flow direction for cereals and related commodities. Where direct price observations were scattered, gaps were handled by using nearby market proxies and adjusting through interview feedback on typical farm gate discounts and transport effects.
Forecasting is built through scenario analysis supported by simple trend models, where production responds to expected planted area, yield trajectory, and weather risk, while prices are projected using inflation and commodity signal checks. Assumptions are reviewed with primary respondents so the forward view stays practical and consistent with what local stakeholders expect to be feasible.
Data Validation & Update Cycle
Outputs are validated through triangulation across independent signals, so if a crop value jumps without a matching change in volume, area, or price logic, the driver is rechecked and documented. Variance checks are run across crops and years, and then a second analyst review is completed before the final totals are signed off.
Reports are refreshed annually, with interim updates triggered by material events such as major policy changes, sharp currency moves, or abnormal weather seasons that reshape yield or farm gate pricing. Before delivery, we perform a fresh pass on the latest public releases and re-contact relevant experts when a key input shifts beyond expected ranges.
Mordor Intelligence's Tanzania Analysis of Major Crops and Cereals Agriculture Market Size Versus Other Published Estimates
Published values for Tanzania crops and cereals often vary because the counted boundary is not always the same, and the price basis can shift the total even when volumes are similar. Differences also come from the year used for currency conversion, how fast price assumptions are refreshed, and whether checks are done against physical output signals.
In this study, the refresh cadence is tied to the latest crop output releases and price movements, and the USD conversion timing is kept consistent so short-term currency swings do not overstate or understate the farm gate value, which is a discipline applied by Mordor Intelligence.
Benchmark comparison
| Source | Market Size | Gaps in Research Methodology |
|---|---|---|
| Mordor Intelligence | USD 22.90 B (2025) | |
| Trade Data Publisher A | USD 18.40 B (2025) | Often leans on traded and marketed volumes, which can miss own-consumption and informal flows that still carry farm gate value, and it can apply border price proxies rather than farm gate pricing. |
| Regional Consultancy B | USD 26.70 B (2024) | May include adjacent crop categories or broader agribusiness value add, and the use of a different price year and USD conversion window can inflate the number when domestic inflation is high. |
The spread is mainly explained by pricing basis, year alignment, and whether the model is tied back to physical production and harvested area. By keeping the steps traceable to crop volumes and a consistent farm gate price logic, the estimate stays easier to reproduce and to update when new season outcomes become visible.
Key Questions Answered in the Report
What is the current value of the Tanzanian agriculture market?
The Tanzanian agriculture market is valued at USD 24.12 billion in 2026 and is projected to reach USD 31.26 billion by 2031.
Which commodity segment holds the largest share?
Cereals and grains lead with 33.62% of Tanzanian agriculture market share in 2025, anchored by maize output of 5.9 million metric tons.
Which segment is growing fastest?
Fruits and vegetables post the highest growth, forecast to expand at a 11.35% CAGR to 2031 due to export demand and dietary shifts.
How extensive is smallholder participation?
Smallholders cultivate 80–90% of Tanzania’s farmland, highlighting both fragmentation and the importance of aggregation solutions.
What major risk threatens near-term growth?
Inadequate rural roads and cold-chain facilities drive 30–40% post-harvest losses for perishables, trimming sectoral margins.
How is digital technology transforming the sector?
Mobile-enabled platforms such as eKichabi v2 and the Tanzania Mercantile Exchange improve market information, credit access and price transparency for thousands of growers.