
Cameroon Agriculture Market Analysis by Mordor Intelligence
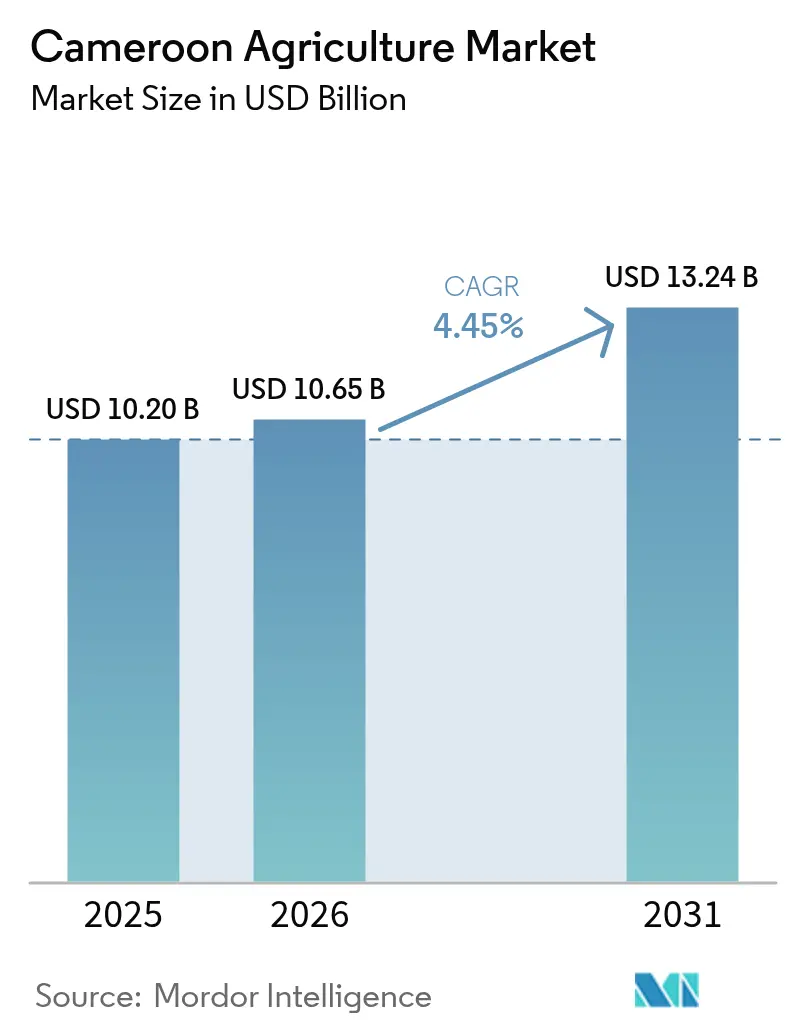
The Cameroon agriculture market size was valued at USD 10.2 billion in 2025 and estimated to grow from USD 10.65 billion in 2026 to reach USD 13.24 billion by 2031, at a CAGR of 4.45% during the forecast period (2026-2031). Sustained urban population growth is translating into higher demand for cereals, roots, and processed foods, while AfCFTA-driven trade liberalization is widening regional sales channels. Infrastructure upgrades along the Douala-Ndjamena corridor are lowering logistics costs, and mobile produce platforms are trimming traditional middle-chain margins. Simultaneously, climate-smart investments, such as small-scale irrigation and index-based crop insurance are safeguarding rural incomes against intensifying climate volatility and price shocks.
Key Report Takeaways
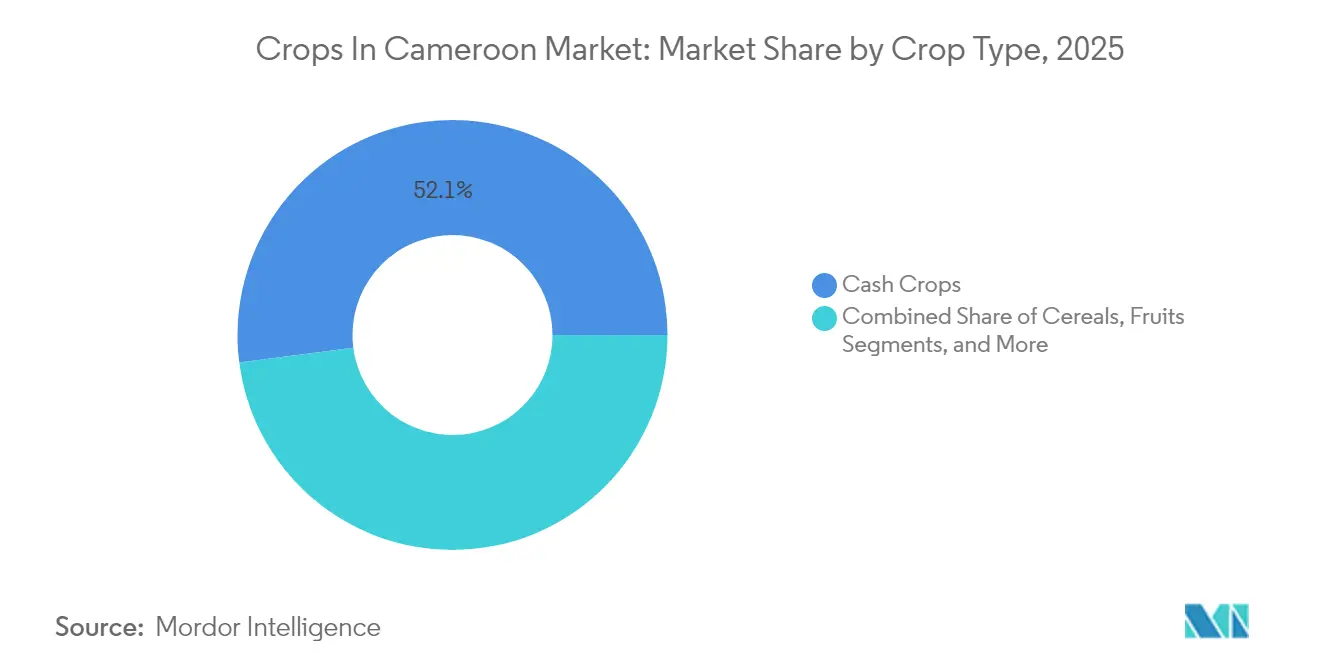
- By crop type, cash crops led with a 52.05% revenue share of the Cameroon agriculture market in 2025, while cereals are projected to expand at a 6.85% CAGR through 2031.
- By region, the Humid Forest Zone commanded 53.00% of the Cameroon agriculture market share in 2025, and the Northern Sahelian Zone records the fastest regional CAGR at 5.95% to 2031.
Note: Market size and forecast figures in this report are generated using Mordor Intelligence’s proprietary estimation framework, updated with the latest available data and insights as of 2026.
Cameroon Agriculture Market Trends and Insights
Drivers Impact Analysis*
| Driver | (~) % Impact on CAGR Forecast | Geographic Relevance | Impact Timeline |
|---|---|---|---|
| Rising domestic demand for cereals and roots | +1.2% | National, with a concentration in urban centers | Medium term (2-4 years) |
| AfCFTA-enabled regional export access | +0.8% | National, with early gains in the Douala, Yaoundé corridors | Long term (≥ 4 years) |
| Public irrigation/rice-valley megaprojects | +0.6% | Northern Sahelian Zone, Far North Region | Long term (≥ 4 years) |
| Mobile-enabled produce marketplaces | +0.4% | National, with higher penetration in the Western Highlands | Short term (≤ 2 years) |
| Carbon-credit income for agroforestry cocoa | +0.3% | Humid Forest Zone, Centre and Southwest Regions | Medium term (2-4 years) |
| Ag-insurance and parametric weather covers | +0.2% | Northern regions, expanding to national coverage | Medium term (2-4 years) |
| Source: Mordor Intelligence | |||
Rising domestic demand for cereals and roots
Urbanization already covers 58% of the population and is shifting diets toward rice, maize, cassava, yams, and plantains. The PIISAH initiative seeks to trim the USD 242 million rice import bill by amplifying local production, a move that also supports feed demand from Cameroon’s expanding poultry sector[1]Source: Coface, “Cameroon: Agro-food Industry Overview,” coface.com. Farmers are, therefore, reallocating land and inputs from traditional export crops to cereals, signaling a structural realignment in the crops in the Cameroon market.
AfCFTA-enabled regional export access
Trade facilitation reforms could lower customs times by up to 2.7 days on imports and 1.7 days on exports, cutting trade costs and boosting agricultural exports by 8.1%[2]Source: Centre for Economic Policy Research, “AfCFTA and Intra-African Trade Costs,” cepr.org. Cameroon’s gateway position to Central Africa allows processed cocoa, coffee, and palm-based products to reach Chad and the Central African Republic more competitively. The USD 380 million upgrade of the Douala–Ndjamena corridor is pivotal for pushing bulk grains and packaged foods into landlocked neighbors, Africa Newsroom. Harmonized phytosanitary rules remain a prerequisite for full tariff-free benefits.
Public irrigation/rice-valley megaprojects
Only 3% of arable land currently uses managed water, yet rainfall variability is most acute in the north. Government-backed rice-valley schemes capture seasonal floods and deliver low-cost farmer-managed irrigation. Early projects suggest yield rises of 40-60% for rice and 20-25% for sorghum once water control is in place. Extension support and improved seed systems determine whether these physical investments translate into durable farm-gate earnings.
Mobile-enabled produce marketplaces
About 80% of farmers own a mobile phone, but just 20% have smartphones, so SMS-based services remain critical. Start-ups such as TENGSIM and Agro-Sell link growers to urban wholesale buyers, shrinking post-harvest losses and raising net prices. DEMRI’s web/SMS tool sends local weather and price alerts to low-literacy users, improving planting and marketing decisions. A wider impact relies on improved rural power access and digital literacy training, particularly for women producers.
Restraints Impact Analysis*
| Restraint | (~) % Impact on CAGR Forecast | Geographic Relevance | Impact Timeline |
|---|---|---|---|
| Intensifying climate volatility (Sahelian North) | -0.9% | Northern Sahelian Zone, Far North Region | Short term (≤ 2 years) |
| Fall armyworm and viral plant disease spikes | -0.7% | National, with the highest impact in maize-growing areas | Short term (≤ 2 years) |
| Input-price shocks (fertilizer and diesel) | -0.6% | National, with disproportionate impact on smallholders | Medium term (2-4 years) |
| Rural land-tenure uncertainty delays mechanization | -0.4% | National, with a concentration in customary land areas | Long term (≥ 4 years) |
| Source: Mordor Intelligence | |||
Intensifying climate volatility (Sahelian North)
Floods in 2024 damaged 85,253 ha of crops and affected 158,620 people. Rainfall distribution is increasingly erratic, causing drought during critical cereal growth phases and sudden inundation later in the season. Soil erosion compounds water stress, cutting yields for millet and sorghum that anchor food security. Adaptation efforts are pivoting toward drought-tolerant varieties, micro-dams, and early-warning systems.
Fall armyworm and viral plant disease spikes
Unchecked fall armyworm could slash maize yields by up to 20 million metric tons. Warmer temperatures shorten pest life cycles, enlarging affected zones. FAO’s global action framework urges biopesticides, pheromone traps, and resistant hybrids. Rwandan field trials show entomopathogenic nematodes can match chemical control while lifting yields by 1 ton/ha. Scaling biological methods requires local production facilities and farmer extension.
*Our forecasts treat driver/restraint impacts as directional, not additive. The impact forecasts reflect baseline growth, mix effects, and variable interactions.
Segment Analysis
By Crop Type: Cash Crops Drive Export Revenue
Cash crops held 52.05% of the crops in the Cameroon agriculture market in 2025. Cocoa output ranked fifth worldwide at 295,028 metric tons, buoyed by international prices surpassing USD 10,000/ton. Coffee delivers Arabica and Robusta streams to niche buyers, while cotton integrates farming, ginning, and marketing under SODECOTON. Palm oil expansion is accelerating as investors add new mills and replant aging groves. Export receipts from this cluster anchor rural incomes and offset foreign exchange needs.
Cereals register the fastest growth at 6.85% CAGR through 2031 as public policy pivots toward food security. Maize remains pivotal for household diets and feed mills, yet fall armyworm threats reinforce the case for resistant hybrids. Northern rice schemes already produce two-thirds of domestic output but still cover under 40% of local demand, underlining potential import substitution gains. Fruits and vegetables ride the wave of urban diet diversification, with banana exports rising 19% year on year to 15,543 metric tons in May 2024.


Geography Analysis
The Humid Forest Zone accounted for 53.00% of the Cameroon agriculture market share in 2025, capitalizing on reliable rainfall, fertile soils, and port proximity. South West and Centre regions generate more than 80% of cocoa output, supported by local grinders and exporters. Yield modeling suggests 39-60% gains by mid-century if agroforestry best practices are adopted. Maintaining forest cover is a prerequisite for European Union market access, encouraging growers to integrate shade trees and carbon projects.
The Northern Sahelian Zone posts a 5.95% CAGR to 2031, driven by small-scale irrigation, resilient crop varieties, and improving feeder roads. Cotton remains the cash engine, while rice valleys convert monsoon floods into controlled irrigation. Flood-recession farming is gaining traction as a dual adaptation and production strategy. Western Highlands focus on temperate staples such as potatoes and tomatoes, benefiting from cool climates and access to urban markets.
Western Highlands and Coastal Urban Hubs form a complementary axis. Highlands delivers potatoes, maize, and market vegetables, supported by 2,266 intensively managed farms. Urban zones around Douala and Yaoundé drive demand for perishables and host new flour and oil milling capacity. The corridor upgrade will tighten the production-to-consumption loop and spur regional trade in processed staples.
Regulatory Landscape
Cameroon agriculture policy is anchored in the National Development Strategy 2020-2030 (SND30) and the Integrated Import-Substitution Agropastoral and Halieutic Plan (PIISAH) for 2024-2026, which focuses food security and inflation-control actions on strategic commodities and local value addition. Sector programs are implemented under the Ministry of Agriculture and Rural Development (MINADER), including production and productivity support as well as agricultural and rural infrastructure development, with PIISAH resources stated at 572.49 billion CFA francs for 2024-2026.
Compliance has tightened around tariff harmonization and resource governance. From January 1, 2026, Cameroon applies the CEEAC Common External Tariff aligned with the CEMAC framework, with duty bands spanning 0% to 40% depending on product category, which affects the landed cost of imported inputs and competing food products. On resource management, Decree No. 2024/00176/PM (February 26, 2024) sets the terms for managing water used for agricultural purposes and maintaining hydraulic infrastructure in irrigated areas, reinforcing governance for irrigation schemes and public waterworks used by farmers.
Market Opportunities and Future Outlook
Import-substitution programs create near-term whitespace in staples and input systems where domestic supply gaps persist. PIISAH (2024-2026) concentrates public resources on expanding local production and productivity for priority food products, and the rice import bill cited in the market context (USD 242 million) points to the scale of substitution opportunity for rice and adjacent cereal value chains. Irrigated rice basin investment planning has moved into implementation through the Rice Value Chain Development Project (RVCDP), which adopted a 24 billion CFA franc investment plan for 2026 covering farm-to-market roads and equipment across Ndop, Santchou, and Maga, linking primary production to aggregation and off-take.
Opportunities also extend to higher-value cash crop processing and compliance-linked sustainability, supported by policy incentives and export-market requirements. The 2026 Finance Bill introduced simplified tax systems for agricultural undertakings and referenced investment incentives under Ordinance No. 2025/002 of July 18, 2025, strengthening the operating framework for formal agribusiness investments. On the export side, cocoa is a critical earnings lever (26.3% of export revenue in 2025 per the evidence pack), and programs and partnerships that deepen domestic processing capacity, strengthen certified seed systems (including MINADER distributions tied to a 70,000-ton certified seed target for 2026), and support agroforestry and climate-smart production (such as UN Cameroon CONVERGEFOOD) connect productivity goals with market-access needs.
Recent Industry Developments
- July 2026: The African Development Bank approved EUR 81.2 million to boost agro-industrial development in Cameroons northern regions. The package supports investment-linked upgrades across production and value chain nodes, strengthening the investable pipeline for structured outgrower and processing models.
- June 2026: Cameroons Ministry of Trade issued Decree No. 0215/MINCOMMERCE/CAB, setting a cocoa export fee of 125 FCFA/kg for raw beans and a preferential 20 FCFA/kg rate tied to local processing. The fee differential increases the relative attractiveness of domestic grinding and encourages exporters and processors to re-balance volumes toward in-country value addition.
- December 2024: The African Development Bank approved USD 380 million for upgrades along the Douala-Ndjamena corridor to ease logistics constraints. Improved transit reliability and lower inland transport friction support greater movement of bulk staples and higher-frequency shipments of perishables from production basins to urban and regional markets.


Research Methodology Framework and Report Scope
Market Definition and Coverage
For this study, the market is defined as the annual farm-gate value of crops and livestock produced within Cameroon and either sold or consumed locally, reported in current US dollars.
Scope exclusions: Downstream food and beverage processing, forestry output, and informal cross-border trade are not counted in this market value.
Segmentation Overview
- By Crop Type (Production Analysis (Volume), Consumption Analysis (Volume and Value), Import Analysis (Volume and Value), Export Analysis (Volume and Value), and Price Trend Analysis)
- Cereals
- Maize
- Rice
- Sorghum and Millet
- Wheat
- Fruits
- Bananas and Plantains
- Pineapple
- Mango and Citrus
- Vegetables
- Leafy Greens (Huckleberry, Waterleaf)
- Solanaceae (Tomato, Pepper, Eggplant)
- Root and Tuber Vegetables
- Cash Crops
- Cocoa
- Coffee (Arabica and Robusta)
- Cotton
- Oil Palm
- Cereals
- By Region (within Cameroon)
- Northern Sahelian Zone
- Western Highlands
- Humid Forest Zone
- Coast and Urban Hubs (Douala, Yaound)
Data Sources, Market Sizing, and Validation
Desk Research
Desk research was used to build the first structure of the model, especially the crop and livestock production base, pricing references, and trade direction. Public sources such as FAOSTAT, the World Bank agriculture value added series, UN Comtrade trade statistics, IMF macro series, and national publications from Cameroon agencies (such as MINADER and INS) were reviewed to keep definitions and time periods consistent.
Along with these, we checked company filings, investor presentations, association websites, and reputable press to understand farm-gate price movement, input availability, and export crop context. Select paid subscriptions were used only where they helped cross-check company financials, major news flow, patent activity, and shipment-level trade signals, particularly when public data lagged. The desk sources named here are illustrative, and other references were also used for data collection, validation, and clarification.
Primary Interviews and Surveys
We speak with growers, traders, processors, distributors, agricultural service providers, and public-sector specialists in Cameroon. Their input helps clarify crop prices, yields, demand, imports, exports, and regional supply conditions where secondary data are incomplete. Responses are compared with the model before assumptions and final results are approved.
Distribution of primary research fieldwork respondents
| Company type | Respondent position |
|---|---|
| Top tier: 27% | CXOs: 15% |
| Mid tier: 48% | Functional/Unit leaders: 33% |
| Smaller Players: 25% | Managers: 52% |
Market-Sizing & Forecasting
Sizing starts with a top-down reconstruction that links Cameroon production volumes by major crop and livestock groups with farm-gate price series, then converts the totals into current USD using the year-average exchange rate. Once the base totals are built, selective bottom-up checks are applied using sampled price x volume builds from key producing areas, aggregator channel checks, and sanity checks against export cash crop flows, so the final number stays aligned with what is observed on the ground.
Inputs used in the model include harvested area and yields, livestock herd and offtake patterns, farm-gate and wholesale price spreads (to avoid mixing levels), export crop export volumes, and weather and seasonality signals that affect supply timing. Where local data gaps exist, we used proxy indicators from trade and macro series, then adjusted the split using primary feedback so missing pieces do not get overstated.
Forecasting uses scenario analysis supported by simple multivariate regression, where production trend, price inflation, and the exchange rate outlook are treated as the main drivers. Expert views are used to stress test optimistic and conservative paths, and the final forecast is locked after the scenarios are reconciled.
Data Validation & Update Cycle
Model outputs are triangulated against independent signals such as agriculture value added direction, trade movement for major export crops, and observable farm-gate price bands discussed in interviews. When outliers appear, assumptions are revisited, and follow-up calls are triggered if the variance cannot be explained by seasonality, weather shocks, or currency movement.
Before sign-off, the numbers go through multiple analyst review steps, including checks on definitions, unit conversions, and year mapping. The report is refreshed annually, with interim updates when material events occur, such as policy changes, large weather disruptions, or sharp FX shifts. Right before delivery, we run a final pass to ensure the latest available data and news are reflected.
Mordor Intelligence's Cameroon Agriculture Market Size Versus Other Published Estimates
Published market sizes for Cameroon agriculture can look different even when the titles sound similar, because each publisher draws the market boundary in its own way and uses different price levels and currency timing. In practice, the biggest shifts usually come from what is counted as agriculture, whether values are farm-gate or later in the chain, and how missing informal flows are treated.
The table shows a clear spread that mainly comes from scope alignment and the value layer used, plus how closely the variables are checked against production reality. In Mordor Intelligence's model, only crops and livestock produced inside Cameroon and valued at farm-gate prices are included, and forestry and informal cross-border trade are left out, which keeps the total from being inflated by adjacent activities.
Benchmark comparison
| Source | Market Size | Gaps in Research Methodology |
|---|---|---|
| Mordor Intelligence | USD 10.20 B (2025) | |
| Industry Data Portal A | USD 8.95 B (2024) | Uses agriculture, forestry, and fishing value added as the main measure, which is a national accounts construct and includes forestry and fishing, and it is also a different year which can shift USD totals due to FX and inflation. |
| Regional Consultancy B | USD 11.40 B (2024) | Often reflects a broader value chain view where parts of post-harvest handling, trading margins, or early processing are blended into the total, and the year-level currency conversion approach is not always stated clearly. |
Looking across the three numbers, most of the difference is explained by whether the figure represents farm-gate agriculture only, a national accounts value added line that includes forestry and fishing, or a wider chain view that can pull in margins beyond the farm. By keeping the scope specific and then cross-checking against production, prices, and trade signals, the resulting estimate stays easier to replicate and explain to decision makers.


Key Questions Answered in the Report
What is the current value of the crops in Cameroon market?
The crops in Cameroon market is valued at USD 10.65 billion in 2026.
How fast is the market projected to grow?
It is forecast to expand at a 4.45% CAGR, reaching USD 13.24 billion by 2031.
Which crop segment is growing the fastest?
Cereals post the sharpest rise with a projected 6.85% CAGR through 2031, reflecting strong food-security initiatives.
Why does the Humid Forest Zone dominate production?
Reliable rainfall, fertile soils, and close proximity to Douala port allow high-value cocoa and palm outputs to thrive, giving the zone a 53.00% market share in 2025.
What role does AfCFTA play in market expansion?
AfCFTA trade facilitation could cut customs times and trim trade costs up to 7%, potentially increasing Cameroonian agricultural exports by 8.1%.
How is climate risk being mitigated?
Cameroon is scaling small-scale irrigation, drought-resistant varieties, and parametric weather insurance that already covers over 135,000 contracts, improving resilience for smallholders.
Page last updated on:


 Your data is secure and never sold or shared.


