Brazil Agriculture Market Analysis by Mordor Intelligence
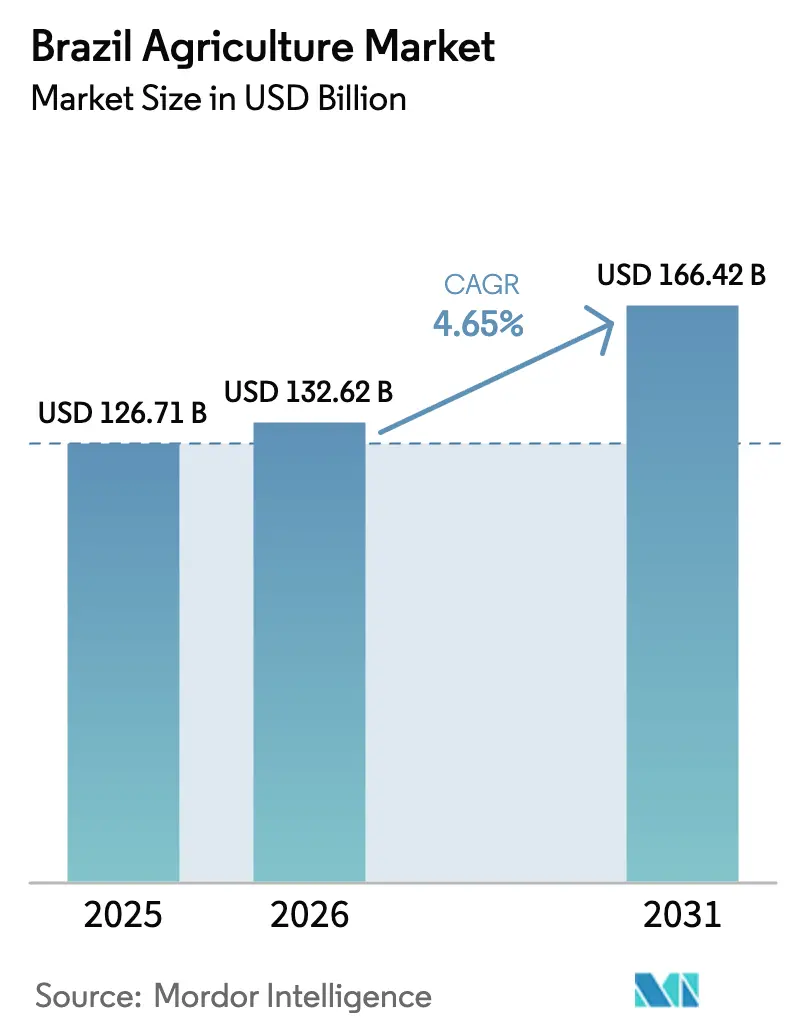
The Brazil agriculture market size is projected to expand from USD 126.71 billion in 2025 and USD 132.62 billion in 2026 to USD 166.42 billion by 2031, registering a CAGR of 4.65% between 2026 to 2031. This steady growth positions Brazil as a leading global supplier in the agriculture market. Key drivers include sustained demand for grains and oilseeds from China and Southeast Asia, increasing ethanol blending mandates, and the widespread adoption of double-cropping practices. These factors are supporting output growth despite challenges such as lower international prices and occasional logistics bottlenecks. Government initiatives, such as the Plano Safra rural credit program, carbon-credit schemes that incentivize regenerative practices, and precision agriculture technologies that improve fertilizer efficiency, are helping to stabilize farm margins against price fluctuations. While multinational traders continue to dominate crushing and origination capacities, cooperatives and mid-sized processors are expanding their operations in frontier regions, where land costs are lower compared to the Central-West region. Strategic investments in northern arc ports, inland rail networks, and corn ethanol production facilities are projected to gradually reduce freight costs, diversify domestic grain utilization, and enhance Brazil's export competitiveness in the agriculture market through 2031.
Key Report Takeaways
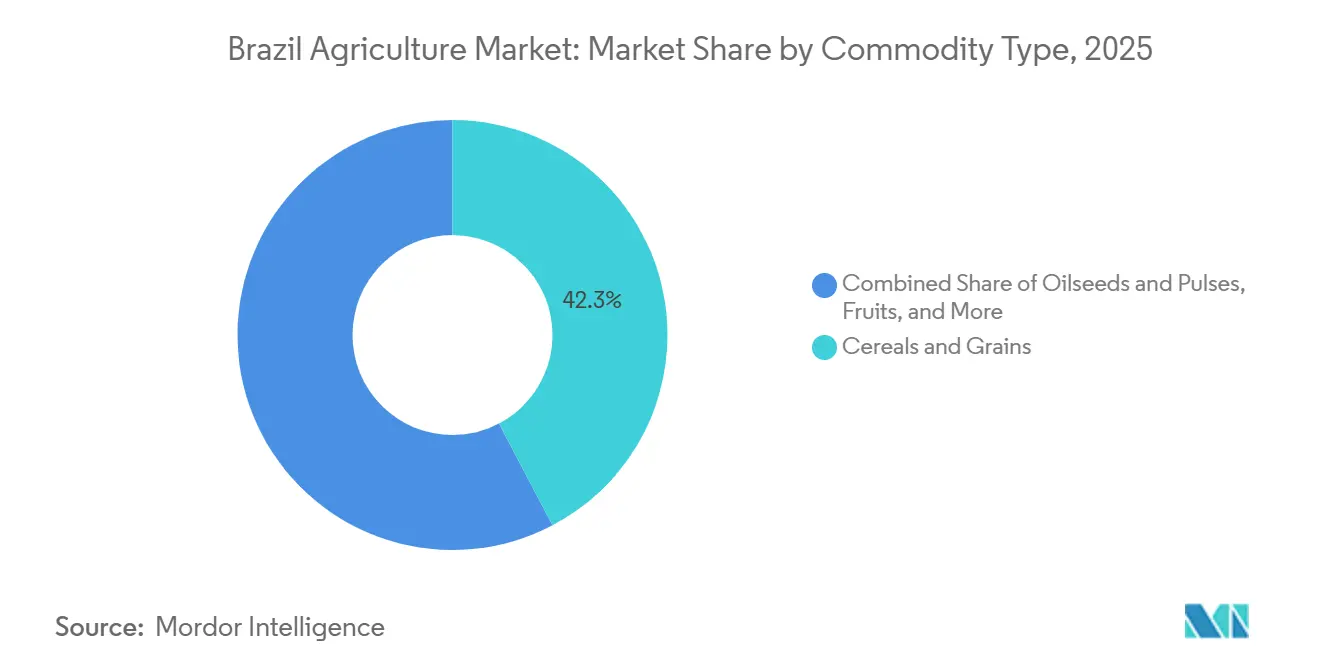
- By commodity type, cereals and grains led with 42.3% of the Brazil agriculture market share in 2025, while oilseeds and pulses are advancing at a 5.0% CAGR through 2031, the fastest among all segments.
Note: Market size and forecast figures in this report are generated using Mordor Intelligence’s proprietary estimation framework, updated with the latest available data and insights as of January 2026.
Brazil Agriculture Market Trends and Insights
Drivers Impact Analysis*
| Driver | (~) % Impact on CAGR Forecast | Geographic Relevance | Impact Timeline |
|---|---|---|---|
| Rising global demand for Brazilian soybeans | +1.0% | China, European Union, and Southeast Asia | Medium term (2-4 years) |
| Expansion of double-cropping systems | +0.7% | Mato Grosso, Goiás, Paraná, and MATOPIBA | Long term (≥ 4 years) |
| Preferential rural credit programs | +0.5% | Nationwide with focus on Central-West and South | Short term (≤ 2 years) |
| On-farm digitalization and precision agriculture adoption | +0.4% | Mato Grosso, Paraná, Rio Grande do Sul, and MATOPIBA | Medium term (2-4 years) |
| Carbon-credit monetization via regenerative farming | +0.3% | Mato Grosso, Goiás, and Mato Grosso do Sul | Medium term (2-4 years) |
| Corn-ethanol build-out boosting domestic grain pull | +0.2% | MATOPIBA, and Central-West | Long term (≥ 4 years) |
| Source: Mordor Intelligence | |||
Rising Global Demand for Brazilian Soybeans
Chinese feed manufacturers imported 112 million metric tons of Brazilian soybeans in 2024, accounting for 77% of Brazil’s total soybean exports and nearly half of China’s crushing requirements [1]Source: United States Department of Agriculture Foreign Agricultural Service, “Brazil Soybean Exports to China Hit Record 112 Million Tons in 2024,” fas.usda.gov. Favorable freight rates from northern arc ports and competitive farmgate prices, influenced by an 8% depreciation of the Brazilian Real, further widened Brazil’s price advantage over shipments from the United States Gulf. The National Supply Company forecasts soybean production at 177 million metric tons for the 2025-26 season, supported by a 4% expansion in cultivation area in MATOPIBA and the adoption of drought-tolerant varieties developed by the Brazilian Agricultural Research Corporation. European Union buyers remain a premium market for deforestation-free soybeans that meet the traceability standards outlined in the European Union Deforestation Regulation. Meanwhile, Vietnam and Thailand increased imports by 18% in 2024 to secure protein meal for the aquaculture and poultry industries. These structural factors provide a stable foundation for export volumes, even during periods of lower prices.
Expansion of Double-Cropping Systems
Safrinha corn achieved a record production of 115.6 million metric tons in 2024, accounting for 92% of the total corn output. This was driven by the replanting of nearly all soybean land in Mato Grosso and Goiás with early-maturing hybrids that utilize residual soil moisture[2]Source: National Supply Company, “Acompanhamento da Safra Brasileira de Grãos 2024-25,” conab.gov.br. This practice has reduced the fallow period from six months to nearly zero, effectively doubling land-use efficiency without causing additional deforestation. According to the Ministry of Agriculture, 18 million hectares are currently under double cropping, with a target to expand this to 25 million hectares by 2030. Seed companies have introduced 90-day corn hybrids and high-oleic soybeans designed for tighter planting schedules, while precision planters enhance spacing accuracy and boost yields. Frost risk in Paraná and Mato Grosso do Sul remains a challenge, particularly when late rains delay the soybean harvest. Crop insurance and forward contracts are increasingly being used to help farmers secure margins despite weather-related uncertainties.
Preferential Rural Credit Programs
The Plano Safra 2024-25 increased subsidized lending to BRL 475.5 billion (USD 88.2 billion), with interest rates ranging from 4% to 8%, thereby protecting growers from commercial rates exceeding 12%. During the first half of the crop year, disbursements reached BRL 320 billion (USD 59.4 billion), facilitating significant pre-purchases of fertilizer as prices declined by 24% from their 2022 peak. The Brazilian Development Bank has allocated an additional BRL 25 billion (USD 4.6 billion) to support investments in irrigation pivots, grain storage facilities, and variable-rate machinery, with a focus on MATOPIBA, where storage capacity remains insufficient. Cooperatives have integrated these credit lines with input packages and deferred repayment options, ensuring planting areas are maintained even during periods of price volatility. This approach mitigates sudden reductions in acreage and helps stabilize agricultural output in Brazil across different market cycles.
Corn-Ethanol Build-Out Boosting Domestic Grain Pull
In Brazil, corn ethanol production differs from that of other countries due to its reliance on second-season corn, which accounts for approximately 99% of the corn produced in the Center-South region. According to the Brazilian Sugarcane and Bioenergy Industry Association (UNICA), during the 2024/2025 harvest season, the corn ethanol sector processed 6.5 million metric tons of corn, producing 8.2 billion liters of ethanol. Projections from the Brazilian Ministry of Mines and Energy (MME) indicate that this volume could increase to 14 billion liters by 2033. This growth is supported by RenovaBio carbon-intensity credits and increased gasoline blending mandates[3]Source: Brazilian Sugarcane Industry Association, “Corn Ethanol Capacity Forecast,” unica.com.br. Mato Grosso accounts for 60% of the ethanol mills, leveraging its surplus safrinha corn for on-site processing, which offsets logistical challenges. Each additional billion liters of ethanol production utilizes approximately 700,000 metric tons of corn, reducing exportable surpluses and supporting domestic basis levels. Archer Daniels Midland Company has committed USD 60 million to a new mill, which is projected to commence operations in 2026. The feed coproduct, distillers dried grains with solubles, is contributing to an 8% reduction in poultry feed costs, creating value across the supply chain.
Restraints Impact Analysis*
| Restraint | (~) % Impact on CAGR Forecast | Geographic Relevance | Impact Timeline |
|---|---|---|---|
| Commodity price volatility and trade-war exposure | -0.8% | Nationwide, especially Mato Grosso, Paraná, and Rio Grande do Sul | Short term (≤ 2 years) |
| Logistics bottlenecks (ports, roads, rail) | -0.6% | Santos and Paranaguá corridors, northern arc spillover | Medium term (2-4 years) |
| Water-use conflicts in MATOPIBA regions | -0.5% | Export regions shipping to European Union and China | Medium term (2-4 years) |
| Tighter sanitary and phytosanitary barriers on residue-sensitive crops | -0.3% | Maranhão, Tocantins, Piauí, and Bahia | Long term (≥ 4 years) |
| Source: Mordor Intelligence | |||
Commodity Price Volatility and Trade-War Exposure
Soybean futures on the Chicago Board of Trade declined by 25% in 2024, reducing Brazilian farm margins by 30%, as only 40% of the crop was forward-sold at the time of planting. Corn prices fluctuated between USD 4.20 and USD 5.80 per bushel, creating uncertainty in revenue projections. While currency depreciation provided partial relief, it was insufficient to recover the profitability levels of the previous cycle. Trade disputes between the United States and China have the potential to shift Brazil’s export premiums by USD 25 per metric ton in either direction with minimal warning. In response, cooperatives have introduced minimum-price contracts to transfer risk to aggregators. This approach depletes working capital and slows investments in storage and logistics infrastructure.
Water-Use Conflicts in MATOPIBA Regions
The National Water Agency projects that 30% to 40% of irrigation demand in the MATOPIBA region could remain unmet between 2025 and 2040 without the development of new reservoirs, pipelines, and on-farm water harvesting systems. The expansion of soy and cotton cultivation has intensified competition for water resources with household consumption and hydropower reservoirs. During drought years, authorities often impose pumping bans, which can reduce agricultural yields by as much as 15%. The Sustainable Agriculture Plan has allocated BRL 10 billion (USD 1.9 billion) for low-pressure pivots and drip irrigation systems, which can reduce water usage by up to one-third. Delays in environmental licensing have hindered the implementation of these projects. Long-term solutions are focused on watershed governance frameworks, which are still under negotiation among state agencies and grower associations.
*Our forecasts treat driver/restraint impacts as directional, not additive. The impact forecasts reflect baseline growth, mix effects, and variable interactions.
Segment Analysis
By Commodity Type: Cereals and Grains Anchor Volume While Oilseeds and Pulses Drive Value
Cereals and grains accounted for 42.3% of Brazil's agriculture market share in 2025, driven primarily by corn, which fulfilled both feed demand and fuel blending requirements. Ethanol mills consumed 10 million metric tons of corn in 2024. Safrinha corn production reached 115.6 million metric tons, enabling exports of 45 million metric tons, positioning Brazil as the second-largest global supplier after the United States. Wheat production in Paraná and Rio Grande do Sul totaled 8.5 million metric tons, and domestic milling shortfalls necessitated the import of 6 million metric tons from Argentina. Rice production reached 10.6 million metric tons in irrigated paddies in Rio Grande do Sul, catering to domestic consumption but rarely entering export markets. Yield improvements through precision fertilizer application and hybrid seeds are projected to increase corn productivity by 2.3% annually, ensuring cereals remain a critical component of Brazil's agriculture market growth through 2031.
Oilseeds and pulses represent the fastest-growing segment, with a projected compound annual growth rate (CAGR) of 5.0% through 2031. Brazil is projected to increase soybean production from 169 million metric tons in the 2024-25 season to an estimated 177 million metric tons in the following season. Domestic crushing facilities operated at 90% capacity in 2024, processing 53.5 million metric tons of soybeans into meal and oil to meet feed and biodiesel requirements. The biodiesel blending mandate increased from B14 in 2024 to B15 in 2025, necessitating an additional 1.2 million metric tons of soybean oil. This has led processors in Paraná and Mato Grosso to optimize plant operations. The market size for soybean derivatives is expanding both at the production level and within the value-added chain. Collectively, these factors position oilseeds as the largest contributor to future value growth in Brazil's agriculture market.


Geography Analysis
In 2024, the Central-West region accounted for 48% of Brazil's national grain and oilseed output, driven by Mato Grosso's production of 75 million metric tons of soybeans and corn. Rail and barge corridors directed freight northward to Itaituba and Santarém, reducing transportation costs by USD 20 per metric ton compared to the Santos route. Rising land prices and stagnating yield improvements have prompted producers to explore new acreage in the MATOPIBA frontier. Land costs in this region are 50% lower than in the Central-West, and soybean cultivation expanded by 2.5 million hectares between 2020 and 2024. Water scarcity remains a significant challenge, emphasizing the importance of effective irrigation and watershed management to fully realize the region's agricultural potential in Brazil.
The South produced 52 million metric tons of grains in 2024, with strong performance in winter wheat and irrigated rice. Soybean yields in the region were 12% higher than the national average, supported by consistent rainfall and fertile soils. Ports at Paranaguá and Rio Grande managed 60% of the region's shipments, though aging equipment has led to prolonged vessel delays. Coamo's investment in a dedicated terminal at Paranaguá reduced freight costs for its members by USD 10 per metric ton. Meanwhile, the Southeast, encompassing São Paulo and Minas Gerais, produced 360 million metric tons of sugarcane, 2.1 million metric tons of coffee, and 12 million metric tons of oranges in 2024. The region benefits from dense processing clusters and proximity to urban demand centers, which strengthen supply chains and enhance value addition, contributing to the overall growth of Brazil's agricultural market beyond raw commodity production.
The North produced 8 million metric tons of grains in 2024. Strict enforcement of deforestation limits has constrained farmland expansion, but carbon-credit programs and low-carbon beef protocols have introduced alternative revenue streams. Ports at Miritituba and Santarém handled 15 million metric tons of cargo, utilizing the Tapajós River to reduce freight costs from Mato Grosso by USD 25 per metric ton. However, draft restrictions during dry months continue to limit economies of scale. Dredging initiatives under the Ministry of Infrastructure aim to deepen channels by 2027, addressing these challenges. Combined with regenerative farming incentives, these developments position the North as a strategic yet environmentally sensitive area for growth within Brazil's agricultural market.
Competitive Landscape
The Brazil agriculture market is characterized by the presence of major players such as Cargill, Incorporated, Bunge Limited, Archer-Daniels-Midland Company, and Louis Dreyfus Company B.V. These companies are enhancing vertical integration by adding two million metric tons of new crushing capacity and expanding their proprietary port terminals, which reduces vessel wait times by 40%. Bunge's deployment of blockchain traceability in 2024 positions major traders to comply with European Union Deforestation Regulation audits, increasing entry barriers for smaller exporters. Cooperatives such as Coamo, Caramuru, and Amaggi are gradually increasing their volume share by offering bundled services, including input finance, agronomy, and marketing, which enhance member returns. In 2024, Coamo processed 4.2 million metric tons of beans and inaugurated a half-million-ton Paranaguá terminal to internalize logistics margins.
The second tier comprises land-owning operators, such as SLC Agrícola and BrasilAgro, which focus on scaling operations in the MATOPIBA frontier, where arable land is more affordable. This allows production costs to be up to USD 50 per metric ton lower than in the Central-West region. In 2024, SLC Agrícola implemented internet-connected sensors across 400,000 hectares, resulting in a 12% reduction in diesel consumption and a strengthening of its cost advantage. Agtech companies such as Solinftec and Agrosmart raised USD 120 million in 2022 to provide artificial intelligence-driven decision support, democratizing agronomic insights that were previously limited to multinational firms. Rabobank’s Acorn project introduces a carbon-offset revenue stream, expanding strategic opportunities. Control over port slots and rail capacity remains a critical factor in price realization, driving joint ventures among cooperatives, pension funds, and traders to secure export corridors.
The competitive environment is projected to intensify as the European Union, China, and other major buyers increase their sustainability requirements, favoring operators with comprehensive monitoring capabilities. Smaller growers face the risk of exclusion unless they align with digital platforms or cooperatives that provide compliance infrastructure and support. Multinational companies are likely to leverage their logistics capabilities and processing margins to expand downstream investments, while regionally focused cooperatives will rely on member loyalty and localized expertise. Overall, market positioning through 2031 will be shaped by a strategic emphasis on traceability, regenerative agricultural practices, and the integration of ethanol.
Recent Industry Developments
- November 2025: Brazil launched the RAIZ (Resilient Agriculture Investment for Net-Zero Land Degradation) initiative during the COP30 summit in Belém. This program aims to mobilize public and private investments to restore degraded agricultural lands, enhance food security, and mitigate the impacts of climate change.
- November 2025: PepsiCo, in collaboration with Griffith Foods and Milhão, has launched a direct farmer incentive pilot program designed to advance regenerative agriculture in Brazil's Cerrado region. This area is one of the world's most biodiverse savannas and an important agricultural frontier.
- March 2025: The Food and Agriculture Organization of the United Nations (FAO) has strengthened its partnership with Brazil to prioritize agrifood systems during the COP30 climate negotiations in Belém. This collaboration emphasizes food security, resilient agriculture, and sustainable forest management as essential strategies for achieving the goals of the Paris Agreement.


Research Methodology Framework and Report Scope
Market Definition and Key Coverage
Our study defines the Brazilian agriculture market as the on-farm value created by field-grown crops, cereals, grains, oilseeds, pulses, sugar crops, fiber crops, fruits, vegetables, coffee, and cocoa harvested by commercial enterprises and smallholders across the five macro-regions. Value equals domestic output multiplied by average annual farm-gate prices.
Scope Exclusion: Livestock, aquaculture, forestry, and ancillary agri-services are outside the present estimate.
Segmentation Overview
- By Commodity Type
- Cereals and Grains
- Production Analysis
- Overview
- Area Harvested and Yield
- Consumption Analysis (Value and Volume)
- Trade Analysis (Value and Volume)
- Import Market Analysis
- Overview
- Key Supplying Markets
- Export Market Analysis
- Overview
- Key Destination Markets
- Import Market Analysis
- Wholesale Price Trend Analysis and Forecast
- Seasonality Analysis
- Production Analysis
- Oilseeds and Pulses
- Production Analysis
- Overview
- Area Harvested and Yield
- Consumption Analysis (Value and Volume)
- Trade Analysis (Value and Volume)
- Import Market Analysis
- Overview
- Key Supplying Markets
- Export Market Analysis
- Overview
- Key Destination Markets
- Import Market Analysis
- Wholesale Price Trend Analysis and Forecast
- Seasonality Analysis
- Production Analysis
- Fruits
- Production Analysis
- Overview
- Area Harvested and Yield
- Consumption Analysis (Value and Volume)
- Trade Analysis (Value and Volume)
- Import Market Analysis
- Overview
- Key Supplying Markets
- Export Market Analysis
- Overview
- Key Destination Markets
- Import Market Analysis
- Wholesale Price Trend Analysis and Forecast
- Seasonality Analysis
- Production Analysis
- Vegetables
- Production Analysis
- Overview
- Area Harvested and Yield
- Consumption Analysis (Value and Volume)
- Trade Analysis (Value and Volume)
- Import Market Analysis
- Overview
- Key Supplying Markets
- Export Market Analysis
- Overview
- Key Destination Markets
- Import Market Analysis
- Wholesale Price Trend Analysis and Forecast
- Seasonality Analysis
- Production Analysis
- Cash Crops
- Production Analysis
- Overview
- Area Harvested and Yield
- Consumption Analysis (Value and Volume)
- Trade Analysis (Value and Volume)
- Import Market Analysis
- Overview
- Key Supplying Markets
- Export Market Analysis
- Overview
- Key Destination Markets
- Import Market Analysis
- Wholesale Price Trend Analysis and Forecast
- Seasonality Analysis
- Production Analysis
- Cereals and Grains
Detailed Research Methodology and Data Validation
Primary Research
Mordor analysts spoke with cooperative agronomists, crop-input dealers, grain traders, mill managers, and rural-credit officers in the South, Southeast, and Center-West. These conversations clarified input-cost swings, emerging yield expectations, and typical farm-gate discounts, letting us cross-check ratios and refine any contentious assumptions.
Desk Research
We first extracted area and production series from IBGE PAM, MAPA-CONAB harvest bulletins, and FAO FAOSTAT, which anchor long-term volume trends. Trade balances were mapped with COMEXSTAT customs data, while farm-gate and spot pricing cues came from CEPEA indices and B3 futures settlements. Additional context flowed from peer-reviewed agronomy journals, Central Bank rural-credit releases, and reputable media, then was enriched with company signals from D&B Hoovers and Dow Jones Factiva. These references framed baseline assumptions before interviews.
The sources noted are illustrative; many further publications and datasets supported data collection, validation, and clarification.
Market-Sizing & Forecasting
We applied a top-down harvested-area × yield × price construct to rebuild 2024 crop value by commodity, and then corroborated results with selective bottom-up checks that rolled up sampled elevator throughputs, processor crush capacities, and channel price audits. Key variables include planted area, yield trend, rural-credit disbursement, BRL to USD path, domestic feed demand, and China-bound export volumes. Forecasts to 2030 employ multivariate regression blended with scenario analysis so weather oscillations and policy shifts remain visible. Where granular data lagged, gaps were imputed with regional analogs and vetted with experts before final lock.
Data Validation & Update Cycle
Outputs pass automated variance screens, senior analyst peer review, and a fresh reconciliation against external markers such as GDP share and land-use satellite reads. We refresh each dataset annually, with interim revisions when droughts, policy moves, or currency shocks materially alter base drivers.
Why Our Brazil Agriculture Baseline Commands Reliability
Published estimates often diverge because firms define agriculture differently, rely on distinct price baskets, or update at uneven cadences.
Key gap drivers include the inclusion of livestock by some publishers, the use of list rather than transacted prices, and longer forecast horizons that stretch assumptions. Mordor fixes scope on crop output only, holds a uniform price basket, and revisits inputs every year.
Benchmark comparison
| Market Size | Anonymized source | Primary gap driver |
|---|---|---|
| USD 128.6 bn (2025) | Mordor Intelligence | - |
| USD 126.6 bn (2024) | Global Consultancy A | Calendar averages; no double-cropping adjustment; limited primary validation |
| USD 100.2 bn (2022) | Industry Intelligence Firm B | Older base year; excludes fruits and vegetables |
| USD 380 bn (2024) | Regional Advisory C | Adds livestock and agri-services; applies wholesale mark-ups |
When consistent crop scope, validated price baskets, and yearly refreshes are applied, Mordor delivers a balanced, transparent baseline that decision-makers can trust.


Key Questions Answered in the Report
What is the estimated size of the Brazil agriculture market in 2026, and what is the forecast for 2031?
The Brazil agriculture market size stands at USD 132.62 billion in 2026 and is projected to reach USD 166.42 billion by 2031.
What is the projected growth rate for Brazil’s agricultural sector?
The market is forecast to expand at a 4.65% compound annual growth rate between 2026 and 2031.
Which commodity segment holds the largest share?
Cereals and Grains led with 42.3% share in 2025, driven by record corn production that feeds both livestock and ethanol demand.
Which segment is growing the fastest?
Oilseeds and Pulses, dominated by soybeans, is set to grow at a 5.0% CAGR through 2031 because of strong overseas and biodiesel demand.
How are logistics constraints being addressed?
Investments of BRL 15 billion (USD 2.8 billion) are planned for port upgrades while northern arc terminals and new rail links aim to cut freight costs and vessel waiting times.
Page last updated on:


