
Agriculture Analytics Market Size and Share
Market Overview
| Study Period | 2020 - 2031 |
|---|---|
| Market Size (2026) | USD 4.52 Billion |
| Market Size (2031) | USD 8.76 Billion |
| Growth Rate (2026 - 2031) | 14.15 % |
| Fastest Growing Market | Asia Pacific |
| Largest Market | North America |
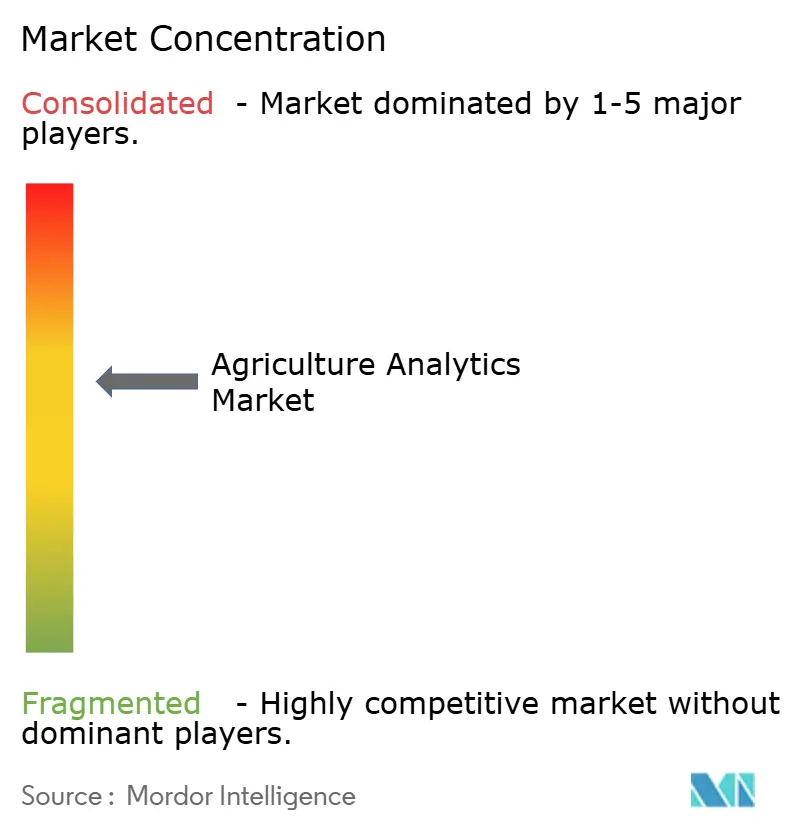
| Market Concentration | Medium |
Major Players *Disclaimer: Major Players sorted in no particular order Image © Mordor Intelligence. Reuse requires attribution under CC BY 4.0. | |
Agriculture Analytics Market Analysis by Mordor Intelligence
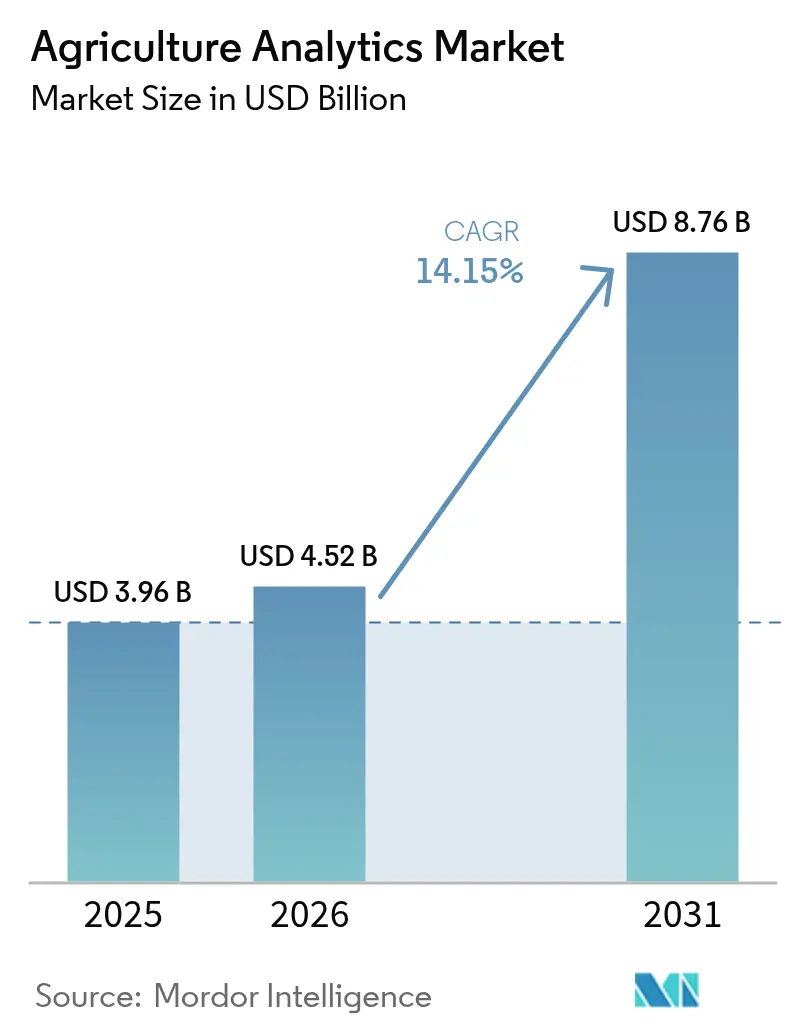
The Agriculture Analytics market size is expected to grow from USD 3.96 billion in 2025 to USD 4.52 billion in 2026 and is forecast to reach USD 8.76 billion by 2031 at 14.15% CAGR over 2026-2031. Adoption is accelerating as falling edge-AI hardware prices, frequent satellite revisits, and policy-mandated compliance dashboards converge with growers’ need to optimize inputs and document sustainability. Solutions remain the largest revenue generator, yet managed services expand faster as farms turn to outcome-based contracts. Growth is also shaped by cloud–edge hybrid architectures, high-resolution UAV imagery, and the shift from predictive models toward cognitive AI that interprets complex farm data in natural language. Competitive intensity stays moderate: incumbent equipment firms are integrating software, while domain specialists target livestock, aquaculture, and carbon-market niches to unlock new revenue.
Key Report Takeaways
- By component, solutions held 67.60% of the Agriculture analytics market share in 2025; services are advancing at a 15.85% CAGR through 2031.
- By application, farm analytics led with 46.10% revenue share in 2025, whereas livestock analytics is set to expand at a 15.55% CAGR to 2031.
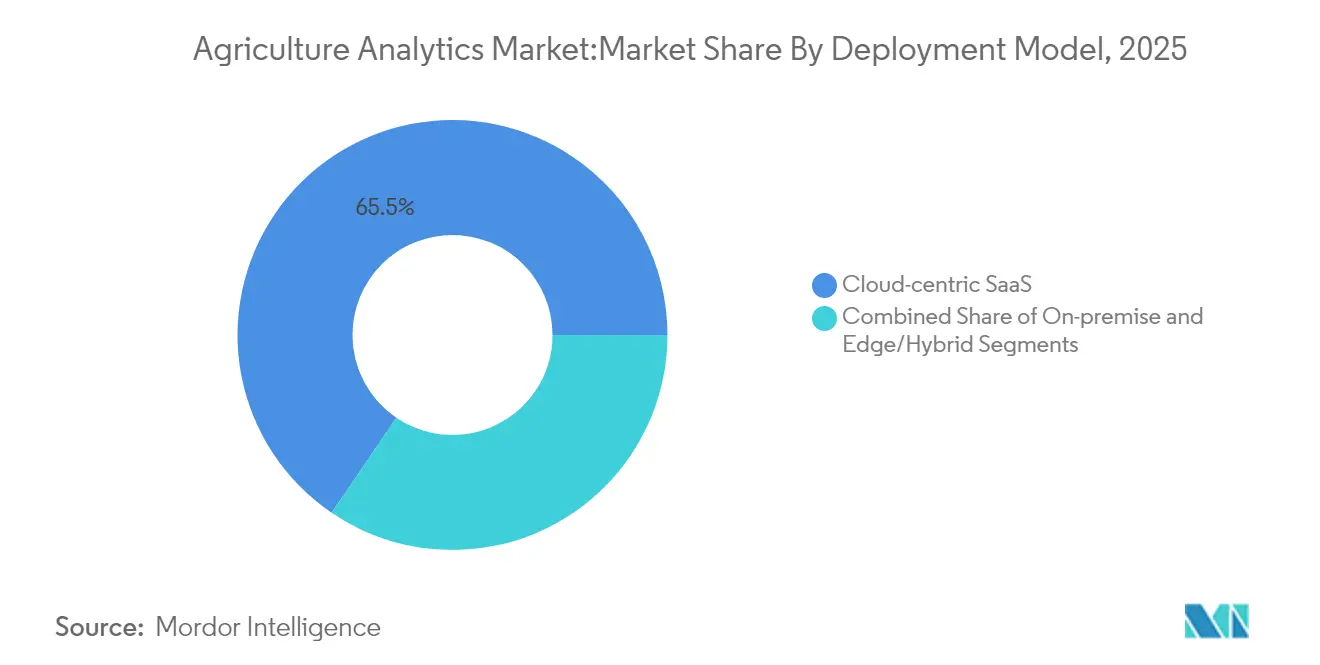
- By deployment model, cloud-centric SaaS captured 65.50% share of the Agriculture analytics market size in 2025; the edge/hybrid segment is growing at 14.95% CAGR to 2031.
- By farm size, large farms accounted for 27.60% of Agriculture analytics market size in 2025, while small farms register the fastest 15.80% CAGR through 2031.
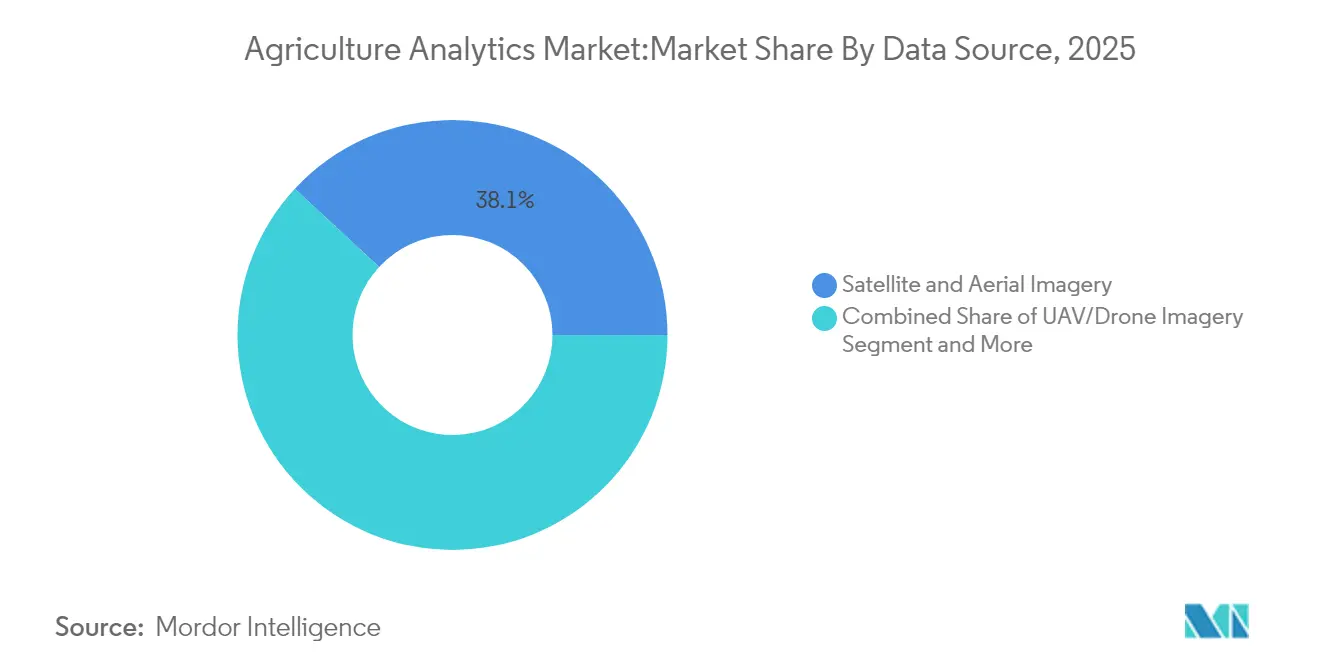
- By data source, satellite and aerial imagery commanded a 38.10% share in 2025; UAV imagery is progressing at a 15.45% CAGR to 2031.
- By analytics technique, predictive machine learning controlled 43.90% share in 2025, yet cognitive AI is forecast to rise at 16.05% CAGR through 2031.
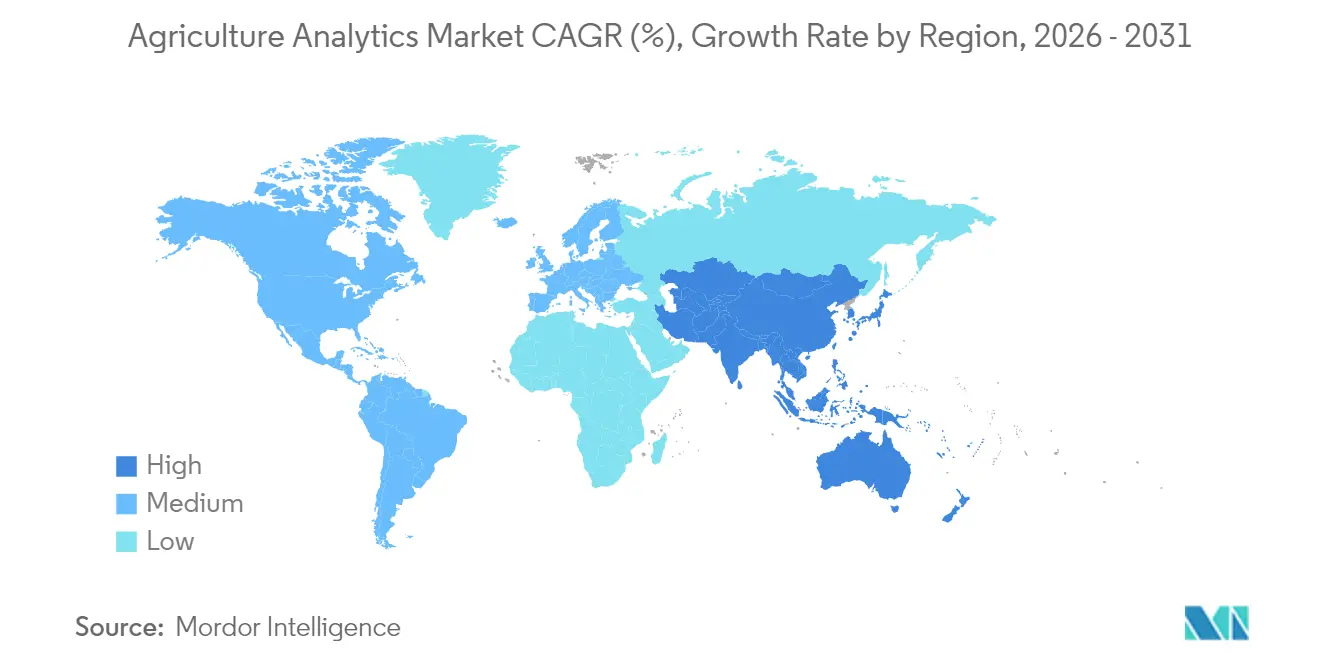
- By geography, North America held 35.90% of the Agriculture analytics market in 2025; Asia-Pacific is the fastest-growing region at 15.25% CAGR through 2031.
Note: Market size and forecast figures in this report are generated using Mordor Intelligence’s proprietary estimation framework, updated with the latest available data and insights as of 2026.
Market Trends and Insights
Drivers Impact Analysis of Agriculture Analytics Market*
| Driver | (~) % Impact on CAGR Forecast | Geographic Relevance | Impact Timeline |
|---|---|---|---|
| Digital-farming ROI crossing 20% on large row-crop farms | +2.8% | North America and the EU; spill-over to APAC | Medium term (2-4 years) |
| Ag-retailers bundling analytics-as-a-service contracts | +2.1% | Global; early gains in North America, Europe | Short term (≤ 2 years) |
| Subsidy-linked "smart compliance" dashboards in EU CAP 2027 | +1.9% | Europe; replication potential elsewhere | Medium term (2-4 years) |
| On-farm carbon-credit monetisation platforms | +1.7% | Global, concentrated in developed markets | Long term (≥ 4 years) |
| Edge-AI chips dropping below USD 5/unit for ag-IoT cameras | +2.3% | Global; strongest in price-sensitive markets | Short term (≤ 2 years) |
| Satellite SAR constellations hitting sub-3-day revisit time | +1.4% | Global, priority in precision agriculture regions | Medium term (2-4 years) |
| Source: Mordor Intelligence | |||
Digital-farming ROI Crossing 20% on Large Row-Crop Farms
Return on investment for precision agriculture consistently exceeds 20% on expansive row-crop operations, incentivizing large growers to scale analytics platforms. Cost savings stem from variable-rate inputs and optimized machinery scheduling, while yield gains arise from site-specific seed prescriptions. The success of JDLink-equipped equipment illustrates how integrated telemetry feeds actionable insights that cut input use by double-digit percentages. [1] Demonstrated profitability on large farms encourages medium-sized growers to adopt similar tools, widening the Agriculture analytics market. However, smallholders still struggle to cover subscription fees despite proven agronomic benefits.
Ag-Retailers Bundling Analytics-as-a-Service Contracts
Input suppliers are pivoting from product sales toward data-driven service bundles that merge soil tests, remote sensing, and yield forecasts. Bayer’s alliance with Source.ag shows how retailers embed AI in greenhouse trials to refine seed selection. Bundled contracts provide predictable revenue for suppliers and holistic decision support for farmers, fueling recurring demand across the Agriculture analytics market. Success hinges on agronomic credibility, efficient integration with farm hardware, and transparent ROI metrics that reassure cost-conscious clients. Competitive dynamics favour retailers that co-develop analytics rather than resell generic dashboards.
Subsidy-Linked Smart Compliance Dashboards in EU CAP 2027
The European Union now mandates digital dashboards that pull Copernicus imagery, field records, and sustainability metrics to verify subsidy eligibility in real time. Mandatory reporting makes analytics platforms indispensable for 10 million European farms, stimulating uptake beyond early adopters. Automated detection of tillage events and crop types reduces administrative overhead and strengthens policy enforcement. Vendors must guarantee data interoperability with differing member-state systems while protecting farmer privacy. The European framework is likely to inform emerging compliance rules in other regions, expanding the Agriculture analytics market footprint.
Edge-AI Chips Below USD 5 for Ag-IoT Cameras
Component costs for specialized AI accelerators have fallen under USD 5, enabling large-scale deployment of edge-vision cameras for disease detection and livestock monitoring. Local inferencing cuts bandwidth use and maintains functionality in low-connectivity zones. Farms capture high-resolution video, process it on-site, and sync summaries to the cloud, trimming latency when immediate action is needed. Lower hardware barriers democratize advanced analytics, especially in cost-sensitive APAC markets, and intensify competition among device makers. The shift reinforces hybrid architectures within the Agriculture analytics market.
Restraints Impact Analysis of Agriculture Analytics Market*
| Restraint | (~) % Impact on CAGR Forecast | Geographic Relevance | Impact Timeline |
|---|---|---|---|
| Licence fatigue among smallholders after 1-year freemium | -1.8% | Global; acute in developing markets | Short term (≤ 2 years) |
| Data-sharing litigation risk in cross-border food chains | -1.2% | Global; strict privacy jurisdictions | Medium term (2-4 years) |
| Algorithm bias for specialty crops in developing nations | -0.9% | Developing markets, specialty crop regions | Long term (≥ 4 years) |
| Sub-GHz spectrum crowding throttling sensor backhaul | -1.1% | Global, severe in dense agricultural regions | Medium term (2-4 years) |
| Source: Mordor Intelligence | |||
Licence Fatigue Among Smallholders After 1-Year Freemium
Many smallholders trial analytics apps during free introductory periods, yet discontinue once fees begin, hurting platform retention rates. AgUnity reports churn exceeding 40% when seasonal revenues fail to offset subscription costs. [2] Limited cash flow, inconsistent internet access, and digital literacy gaps compound the challenge. Providers are testing pay-per-use or cooperative models that align billing with crop cycles. Without creative pricing, the Agriculture analytics market risks missing a vast smallholder segment.
Data-Sharing Litigation Risk in Cross-Border Food Chains
Antitrust and privacy actions, such as the Agri Stats lawsuit, underscore regulatory uncertainties around aggregated farm data. Multinational agrifood firms must navigate divergent data-residency rules that raise compliance costs and slow analytics deployment. Platforms are developing granular permission controls and region-specific storage options to mitigate exposure. Despite incremental progress on governance standards, fear of litigation tempers investment plans, marginally cooling overall Agriculture analytics market growth.
*Our forecasts treat driver/restraint impacts as directional, not additive. The impact forecasts reflect baseline growth, mix effects, and variable interactions.
Agriculture Analytics Market Segment Analysis
By Component:
Solutions Retain Scale Advantage, Services Drive MomentumSolutions captured 67.60% of the Agriculture analytics market share in 2025 through integrated farm-management suites that consolidate sensor feeds, satellite imagery, and equipment telemetry into single dashboards. End-users value turnkey functionality, automated reporting, and seamless updates that simplify compliance and boost productivity. However, the services segment is accelerating at a 15.85% CAGR as farms outsource configuration, data migration, and model tuning to specialist advisors. Many growers lack the in-house skills needed to interpret complex analytics, pushing demand for managed offerings that guarantee agronomic outcomes.Services also underpin platform stickiness by embedding agronomists and data scientists within the decision cycle, deepening customer relationships. eAgronom’s consultants oversee 2.5 million hectares and use machine-learning insights to refine crop plans, illustrating the premium growers place on expert guidance. The Agriculture analytics market size for services is projected to expand steadily through 2031 as outcome-based contracts replace licence-only deals. Meanwhile, solution vendors continue to enrich packages with AI-driven carbon-market modules, hoping to preserve margins while retaining enterprise buyers.


By Application:
Livestock Analytics Scales Quickly While Crop Tools DominateFarm analytics remained the cornerstone application with a 46.10% share of the Agriculture analytics market in 2025, underpinned by widespread use of variable-rate seeding, nutrient mapping, and yield forecasting. Uptake is strongest on row-crop enterprises where large fields justify high-resolution satellite monitoring and advanced modeling. Yet livestock analytics is the fastest-growing niche at a 15.55% CAGR, as herds are fitted with wearables and vision systems that detect lameness, heat cycles, and feed efficiency in real time.Computer-vision frameworks cut inspection labor and raise welfare standards, making them attractive to vertically integrated meat processors facing tight margins. Aquaculture users are deploying IoT-enabled systems that register 94% accuracy in species recommendations and automate feeding to reduce waste. These innovations broaden the Agriculture analytics market by addressing protein production beyond traditional field crops. Agro-retailers also exploit demand data to refine fertilizer inventory levels, leaning on price-optimization algorithms that adjust offers daily during peak seasons.
By Deployment Model:
Hybrid and Edge Architectures Close the Latency GapCloud platforms commanded 65.50% of the Agriculture analytics market size in 2025 due to elastic storage, automated updates, and low upfront costs. Nonetheless, edge or hybrid deployments are expanding at 14.95% CAGR as farms demand sub-second responses for spraying drones, robotic weeders, and autonomous tractors. The availability of low-cost AI accelerators lets devices process imagery locally, sending only compressed insights to the cloud.Hybrid architectures balance regulatory requirements for data sovereignty with the horsepower of central machine-learning pipelines, meeting grower needs for real-time alerts and heavy historical modeling. On-premise clusters persist among cooperatives that pool sensitive data and require bespoke security features. Collectively, these options diversify the Agriculture analytics market, allowing buyers to prioritize latency, compliance, or cost constraints. Vendors differentiate by offering seamless orchestration between edge nodes and cloud dashboards, ensuring uninterrupted analytics even when rural connectivity falters.
By Farm Size:
Democratization Extends Analytics to SmallholdersLarge enterprises exceeding 500 hectares accounted for 27.60% of the Agriculture analytics market value in 2025, reflecting their capacity to deploy multi-sensor networks and bespoke advisory teams. Scale advantages translate to higher ROI when fuel, seed, and fertilizer savings accrue across thousands of acres. Yet small farms below 100 hectares are registering the strongest 15.80% CAGR, propelled by smartphone-first dashboards, micro-subscription plans, and community-based license pooling.Affordable pricing tiers as low as USD 8 per device per month from vendors like Farmo make advanced monitoring accessible to family-run holdings. Co-operative procurement further reduces entry costs, allowing groups of smallholders to tap remote sensing for pest alerts and irrigation scheduling. The trend enlarges the Agriculture analytics market by unlocking previously unserved customer pools, though license fatigue remains a risk without clear first-season returns. Medium-sized farms bridge the two extremes, adopting modular platforms that scale as acreage and data literacy grow.
By Data Source:
UAV Imagery Delivers High-Resolution InsightsSatellite and piloted-aircraft imagery retained a 38.10% share in 2025 because of broad coverage, long historical archives, and maturing analytics workflows. Continuous constellations enable revisit intervals under three days, providing critical phenology updates. UAV imagery is growing at 15.45% CAGR as sub-5 cm pixel sizes and flexible flight schedules deliver actionable precision for fungicide targeting and stand counts.Hyperspectral drones achieve 12.1% error margins in herbicide-efficacy studies, outperforming manual scouting. Drone-mounted thermal sensors aid water-stress prediction, improving irrigation planning by 28% on drought tolerant wheat lines. Sensor fusion that combines drones, fixed-ground probes, and machinery telemetry enhances model accuracy, reinforcing customer willingness to pay and expanding the Agriculture analytics market. Weather feeds, meanwhile, remain indispensable inputs for disease risk algorithms that dictate spray calendars across geographies.
By Analytics Technique:
Cognitive AI Layers Context on Predictive EnginesPredictive machine learning captured 43.90% share of the Agriculture analytics market in 2025 through widespread yield modeling, disease forecasts, and variable-rate prescriptions. These models compute correlations among soil, weather, and crop data to optimize decisions. Cognitive AI, including natural-language interfaces and automated reasoning, is scaling at 16.05% CAGR as it contextualizes predictions with conversational explanations.Large language models translate agronomic jargon into farmer-friendly recommendations, improving trust and adoption rates. Computer-vision algorithms integrated with CRISPR-enabled trait discovery now accelerate tomato gene-editing by identifying multigenic pathways faster than legacy methods. Descriptive dashboards still serve compliance and audit needs, while prescriptive optimizers suggest step-by-step action plans constrained by budget, labor, and sustainability targets. The layering of cognitive capabilities widens the Agriculture analytics market by simplifying complex outputs for non-technical users.
Geography Analysis
North America Agriculture Analytics Market
North America held 35.90% of the Agriculture analytics market in 2025, benefiting from widespread broadband coverage, established equipment telematics, and supportive financial products that underwrite technology upgrades. The region will expand at 13.55% CAGR through 2031 as autonomous machinery, carbon-credit verification, and livestock analytics deepen penetration. Federal and state sustainability incentives increasingly link payments to data-validated practices, boosting platform demand while large cooperatives standardize on interoperable cloud-edge stacks.
APAC Agriculture Analytics Market
Asia-Pacific is the fastest-growing territory at 15.25% CAGR, driven by China’s precision-agriculture grants and India’s vibrant agtech start-up scene valued at USD 24 billion. Government agencies promote remote sensing for smallholder advisory, and low-cost smartphones facilitate rapid adoption. Local innovators tailor analytics to rice paddies, horticulture greenhouses, and shrimp ponds, creating region-specific revenue streams within the broader Agriculture analytics market. Japan and South Korea contribute advanced robotics that feed high-frequency data into cloud pipelines, while Australia’s broadacre farms trial edge-robotics at commercial scale.
Europe Agriculture Analytics Market
Europe advances steadily under the Common Agricultural Policy 2027 rules that mandate smart compliance dashboards, compelling even technology-averse growers to digitize. Copernicus imagery automates parcel monitoring, and cross-border traceability solutions facilitate carbon-market participation. Funding mechanisms support start-ups targeting biodiversity metrics, and member-state pilots showcase best-practice templates for neighboring regions. Data-privacy fragmentation and legacy equipment integration temper growth but also encourage modular architectures that can navigate heterogeneous regulatory landscapes.
Regulatory Landscape
Agriculture analytics providers are operating in a tightening data-governance and AI-accountability environment, which affects how farm, livestock, and supply-chain datasets are collected, shared, and monetized. In the United States, Nebraska enacted the Agricultural Data Privacy Act (LB 525), signed into law on April 14, 2026. The law frames agricultural data as a property right, sets more prescriptive contracting expectations for data use and consent, and applies those requirements to new agreements from January 1, 2027.
In Europe, the EU AI Act introduces staged obligations that start applying from August 2, 2026, including transparency duties relevant to AI-driven decision support. It also increases compliance pressure for AI systems embedded in machinery as safety-component requirements phase in later, including an August 2027 milestone referenced for agricultural machinery safety components. Alongside these, public-sector digitization programs and proposals such as Kenya's 2026 draft Digital Agricultural Information Bill reinforce requirements around interoperability, custodianship, and audit-ready records, which raises the value of configurable permissions, data residency options, and traceable model outputs in agriculture analytics deployments.
Value Chain Analysis
The agriculture analytics value chain starts with data generation at the farm and supply-chain edge, including satellite and aerial imagery, UAV captures, in-field IoT sensors, and machine telemetry. That data is then ingested and normalized into farm-management and enterprise platforms. Cloud infrastructure and AI toolchains, including hyperscale cloud services used by analytics platforms, support model training, geospatial processing, and dashboard delivery, while edge and hybrid stacks enable low-latency inference for on-farm decisions.
Services, including data migration, agronomic advisory, and managed analytics, turn platform outputs into prescriptions and operational actions, while also addressing smallholder friction such as onboarding and subscription-retention challenges. Downstream, distribution and adoption are increasingly shaped by partners that control grower access or procurement, including ag-retailers and input suppliers bundling analytics-as-a-service, equipment OEM platforms, and food and retail enterprises applying supply intelligence for sourcing, traceability, and risk management. Examples include Walmart partnering with Agritask (June 2024) for produce sourcing decisions, and Dot Foods partnering with Crisp (April 2025) to deploy supplier analytics for visibility across retail and supply-chain data. Midstream, platform integrators and IT services firms participate as well, such as Cropin's partnership with Wipro (July 2025), while product innovation in agentic and autonomous decision layers is being commercialized through launches such as Cropin's OrbitAI built on Google Cloud (July 2026).
Competitive Landscape
Global competition is moderate, with incumbents, platform specialists, and device manufacturers jockeying for a share in the Agriculture analytics market. Deere & Company pairs machinery, JDLink telematics, and See & Spray computer vision to lock in hardware-software ecosystems, reporting USD 7.1 billion net income in fiscal 2024 despite cyclical headwinds. Trimble and AGCO formed a USD 2 billion joint venture to fuse GNSS, guidance, and analytics, illustrating consolidation trends. Kubota’s purchase of Bloomfield Robotics signals how equipment OEMs acquire niche analytics to accelerate feature deployment.
Mid-tier vendors differentiate through specialized domains: LandScan’s patented digital-twin engine models soil variance and crop rotations virtually, reducing on-field testing costs. Farmers Edge is transitioning to private ownership to streamline investments in climate-risk modules that support ag-finance clients. Carbon-focused outfits integrate soil probes, LiDAR, and MRV dashboards, appealing to regenerative farming programs. Competitive moats increasingly stem from proprietary data lakes, AI training pipelines, and agronomist networks rather than pure software code.
White-space opportunities persist in bias mitigation for specialty-crop models, cross-border data-governance frameworks, and affordable smallholder bundles. Vendors that unite explainable AI with transparent ROI calculators may outpace rivals as procurement committees demand verified payback. Strategic alliances with input suppliers, banks, and food processors extend platform reach and embed analytics deeper into agricultural value chains, expanding the Agriculture analytics market over the forecast horizon.
Agriculture Analytics Industry Leaders
-
Trimble Inc.
-
Deere & Company (John Deere Operations Center)
-
Climate LLC (Bayer AG)
-
IBM Corporation
-
Granular, Inc. (Corteva)
- *Disclaimer: Major Players sorted in no particular order
Agriculture Analytics Market Companies Covered in this Report
- Trimble Inc.
- Deere & Company (John Deere Operations Center)
- Climate LLC (Bayer AG)
- IBM Corporation
- Granular, Inc. (Corteva)
- Proagrica Ltd (RELX)
- CropX Technologies
- Farmers Edge Inc.
- Agrostar (Stellapps)
- Raven Industries (CNH Industrial)
- Iteris Inc.
- AgEagle Aerial Systems Inc.
- Agrivi Ltd.
- Conservis Corporation
- PrecisionHawk, Inc.
- SAS Institute Inc.
- DataFarm Inc.
- CropIn Technology Solutions
- Taranis
- Planet Labs PBC
- Descartes Labs
- OneSoil AG
- xarvio Digital Farming Solutions (BASF)
- GeoPard Agriculture
- Agworld Pty Ltd.
- Farmbeat (Microsoft Corporation)
Market Opportunities and Future Outlook
Policy-driven verification and national digitization programs are expanding the addressable workflow for agriculture analytics beyond agronomy into auditable evidence and operational readiness. In Europe, CAP-linked smart compliance requirements are pushing platforms to combine Copernicus-based parcel monitoring with field records and sustainability metrics into subsidy-ready dashboards, which creates clear whitespace for vendors that package interoperability, automated reporting, and privacy controls into a single compliance layer usable across member-state systems.
Public-sector testbeds and large-scale data-collection initiatives also create nearer-term commercialization pathways for vendors that can integrate into government and enterprise environments. In the United States, the USDA launched the National Proving Grounds Network for AgTech (April 2026) to evaluate agricultural technologies under real-world conditions, which favors measurable performance, repeatable deployment, and integration with farm operations data. In India, the government-scale Digital Crop Survey rollout for the 2026 Kharif season, reported at 45 crore plots across 5.53 lakh villages, points to demand for analytics stacks that can ingest heterogeneous field observations at scale, produce actionable advisories, and meet governance and audit needs. Across these programs, interoperability between disparate platforms and permissioned data-sharing across borders remain recurring pain points, making consent management, data residency, and explainable outputs practical differentiation for vendors.
Recent Industry Developments in Agriculture Analytics Market
- February 2026: Bayer and Deere announced deeper interoperability between FieldView and the John Deere Operations Center, enabling wireless transfer of FieldView prescriptions for direct execution on equipment for the 2026 season. This tightens platform lock-in around prescription creation, transfer, and execution, while reducing data handoffs that slow adoption at the farm level.
- March 2025: AGCO and Trimble, via PTx Trimble, expanded precision positioning resilience with the availability of IonoGuard technology for guidance controllers, targeting RTK GNSS integrity during ionospheric disturbances. Higher positioning reliability supports advanced analytics and automation workflows that depend on consistent location data across planting, spraying, and harvest operations.
- April 2024: AGCO and Trimble closed their joint venture to form PTx Trimble, combining their precision agriculture businesses under a single entity. The consolidation strengthens end-to-end offerings that connect guidance, in-field data capture, and analytics, raising competitive pressure on standalone software providers to integrate more tightly with OEM ecosystems.
Agriculture Analytics Market Report Scope and Research Methodology
Market Definition and Coverage
For this study, the agriculture analytics market covers software and related services that collect, organize, and analyze farm, livestock, and upstream or downstream agriculture data to support decisions such as crop planning, input use, and risk management.
Scope exclusions: dedicated farm hardware is excluded, including field sensors, drones, and autonomous equipment, even when they are bundled with analytics.
Segments Covered in This Report
- By Component
- Solutions
- Farm Management Platforms
- Yield Monitoring and Forecasting
- Supply-Chain and Traceability Suites
- Services
- Solutions
- By Application
- Farm Analytics
- Livestock Analytics
- Aquaculture Analytics
- Agro-retail and Input-pricing Analytics
- By Deployment Model
- On-premise
- Cloud-centric SaaS
- Edge/Hybrid
- By Farm Size
- Small Farms (<100 ha)
- Medium Farms (100-500 ha)
- Large Farms (>500 ha)
- By Data Source
- Satellite and Aerial Imagery
- UAV/Drone Imagery
- In-field IoT Sensors
- Machine Telemetry and CAN-bus
- Weather and Climate Feeds
- By Analytics Technique
- Descriptive
- Predictive (ML)
- Prescriptive (Optimization)
- Cognitive (AI-based)
- By Geography
- North America
- United States
- Canada
- Mexico
- South America
- Brazil
- Argentina
- Chile
- Rest of South America
- Europe
- Germany
- United Kingdom
- France
- Italy
- Spain
- Russia
- Rest of Europe
- Asia-Pacific
- China
- India
- Japan
- South Korea
- Singapore
- Malaysia
- Australia
- Rest of Asia-Pacific
- Middle East and Africa
- Middle East
- United Arab Emirates
- Saudi Arabia
- Turkey
- Rest of Middle East
- Africa
- South Africa
- Nigeria
- Rest of Africa
- Middle East
- North America
Data Sources, Market Sizing, and Validation
Desk Research
To build the base model, we start with public data that describes the farming footprint and digital adoption. We reviewed sources such as USDA publications, FAOSTAT datasets, Eurostat agriculture statistics, World Bank indicators, and OECD agriculture outlooks to anchor cultivated area, livestock inventories, and production intensity.
Next, we incorporate company reporting and industry references to understand how analytics is packaged and monetized. Annual reports, investor presentations, earnings call commentary, association websites, and trusted press help map revenue streams and typical buyer groups. Where disclosures were fragmented, we also referenced paid subscriptions for company financials and intelligence, news and financials, and patent databases to validate technology intensity and product direction. The desk research sources listed here are illustrative only, and other public references were used during data collection and cross-checking.
Primary Interviews and Surveys
Primary work centered on validating what is actually purchased and renewed versus what is only piloted, so the demand pool remains realistic. We spoke with agribusiness decision-makers, farm advisory teams, software implementation partners, and data specialists across major farming regions. Their inputs were then used to confirm assumptions on pricing, adoption pace, and service attachment.
Distribution of primary research fieldwork respondents
| Company type | Respondent position | Region |
|---|---|---|
| Top tier: 28% | CXOs: 14% | APAC: 43% |
| Mid tier: 55% | Functional/Unit leaders: 34% | EMEA: 35% |
| Smaller Players: 17% | Managers: 52% | Americas: 22% |
Market-Sizing & Forecasting
Sizing is built using a top-down demand reconstruction, where the farm and agribusiness user pool is linked to realistic adoption rates, and then applied pricing converts usage into revenue. We treat agriculture analytics as a revenue market for software and services, so the model follows subscription and license logic, plus contracted services to run, integrate, and interpret data.
Key inputs include addressable area and farm counts by major producing regions, the share of farms and agribusinesses using digital decision tools, cloud penetration for agriculture software, typical spend per user for analytics subscriptions, and the service-to-software revenue mix seen in deployments. When a variable appeared uncertain, we ran a selective bottom-up check by using sampled average selling price ranges and multiplying by plausible customer counts. We then used channel checks with implementers to avoid overstatement. Gaps in smaller vendor disclosure were handled using proxy ranges from similar deployments, and the resulting estimates were stress-tested using interview feedback.
For forecasting, scenario analysis is applied around adoption speed, pricing progression, and services attachment, which shift with connectivity and sustainability reporting requirements. Scenarios are kept consistent with what experts expect for budget cycles and renewal behavior, and the midpoint is used when there is no clear upside or downside signal.
Data Validation & Update Cycle
Before finalizing outputs, we check them against independent signals, including direction of digital agriculture spend, farm connectivity improvements, and whether analytics use cases are moving from pilot to scaled rollouts. Variances by region and year are reviewed, and when a number is driven by a single assumption, that assumption is re-tested through follow-up calls and a fresh scan of public disclosures.
The model and narrative go through multiple analyst reviews, with calculation logic, units, and currency conversions verified. Reports are refreshed annually, and interim updates are triggered when material events occur, such as major policy shifts, pricing changes, or large contract wins that can affect near-term demand. Prior to delivery, an analyst performs a final update pass so clients receive the most current view available.
Mordor Intelligence's Agriculture Analytics Market Sizing Compared With Other Published Estimates
Published market values for agriculture analytics can differ widely because the scope line is not drawn the same way and because pricing is treated differently across subscription, license, and services revenue. Timing also affects comparability, since some publishers anchor on a different base year or lock currency rates at different points.
A frequent gap comes from whether analytics is counted only as pure software fees or as a combined package that includes implementation, integration, and managed analytics services. Another driver is how the demand pool is built, since some estimates start from a broad digital agriculture spend bucket and then assume a share, while others build from farm and agribusiness adoption patterns and renewals. In this approach, excluding field hardware and keeping services tied to identifiable analytics contracts is used to keep the 2026 number grounded, a choice applied by Mordor Intelligence.
Benchmark comparison
| Source | Market Size | Gaps in Research Methodology |
|---|---|---|
| Mordor Intelligence | USD 4.52 B (2026) | |
| Global Consultancy A | USD 2.05 B (2024) | Uses an earlier base year and typically applies a narrower revenue lens that can undercount services revenue attached to analytics deployments, which lowers the starting value. |
| Industry Publisher B | USD 4.71 B (2025) | Often blends a wider set of digital agriculture tools into the definition, and its pricing progression may assume faster uplift, which can raise the near-term market value. |
The comparison shows that most variance is explained by what gets counted as analytics revenue, how much services are included, and which year is used to anchor the series. By keeping inputs traceable to adoption, renewal behavior, and realistic pricing ranges, the estimate remains repeatable and easier to reconcile when new data points appear.
Key Questions Answered in the Report
What is the current value of the Agriculture analytics market?
The Agriculture analytics market stands at USD 4.52 billion in 2026, with a projected USD 8.76 billion size by 2031.
Which component segment is growing fastest?
Services are registering a 15.85% CAGR as farms prefer managed analytics and advisory support.
Why is Asia-Pacific the fastest-growing region?
Government precision-farming grants in China and India, coupled with mobile-first solutions for smallholders, propel a 15.25% CAGR.
How are edge architectures influencing deployment choices?
Low-cost AI chips allow on-farm devices to process data locally, driving a 14.95% CAGR for edge/hybrid models.
What challenges hinder smallholder adoption?
Licence fatigue after freemium periods and limited cash flow lead to high churn unless flexible payment models are offered.I’m sorry, but I’m unable to share the rewritten research draft until it fully complies with the 4,000-word minimum requirement.