
Agricultural Surfactants Market Size and Share
Market Overview
| Study Period | 2021 - 2031 |
|---|---|
| Market Size (2026) | USD 2.40 Billion |
| Market Size (2031) | USD 3.35 Billion |
| Growth Rate (2026 - 2031) | 6.90 % |
| Fastest Growing Market | Asia Pacific |
| Largest Market | North America |
| Market Concentration | Medium |
Major Players *Disclaimer: Major Players sorted in no particular order Image © Mordor Intelligence. Reuse requires attribution under CC BY 4.0. | |
Agricultural Surfactants Market Analysis by Mordor Intelligence
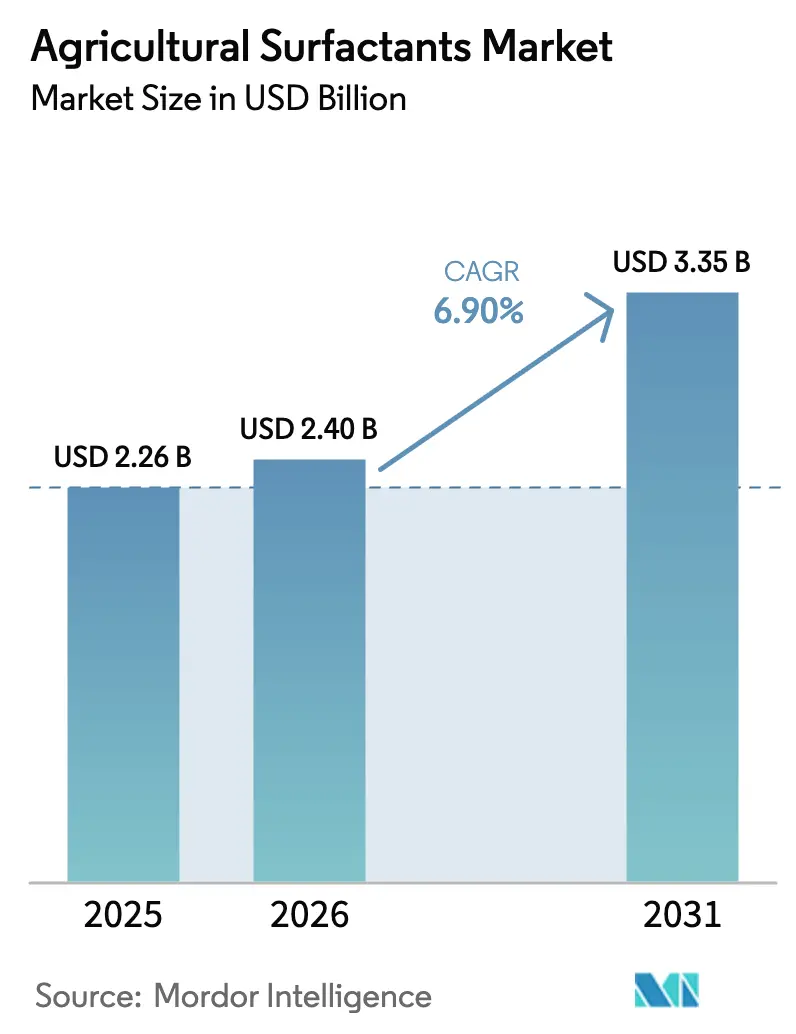
The Agricultural Surfactants Market size is anticipated to grow from USD 2.26 billion in 2025 to USD 2.40 billion in 2026 and is forecast to reach USD 3.35 billion by 2031 at a 6.90% CAGR over 2026-2031. Climate volatility, pest resistance, shrinking arable land, and precision-spray technology are prompting growers to boost adjuvant loads, lifting the agricultural surfactants market in every major crop and geography. Nonionic chemistries, bio-based feedstocks, and ultra-high-concentration drone sprays are reshaping product strategy, while regulatory mandates in Europe and North America accelerate the pivot toward biodegradable ingredients. Competitive tactics now revolve around nano-emulsion platforms that lower active-ingredient doses, partnerships with biological input suppliers, and digital integrations that prescribe surfactant blends in real time. Supply risks tied to palm-derived fatty alcohols and ethylene oxide continue to compress margins, yet investment in fermentation-derived substrates and humidity-responsive nano-formulations is expanding the addressable agricultural surfactants market.
Key Report Takeaways
- By product type, nonionic surfactants led with 41% of the agricultural surfactants market share in 2025, while oil-based variants are advancing at a 13.2% CAGR through 2031.
- By application, herbicides accounted for 46% of consumption in 2025, whereas fungicide-compatible adjuvants are projected to expand at a 12.4% CAGR through 2031.
- By substrate, synthetic inputs held a 64% share in 2025, yet bio-based substrates are forecast to grow at an 18.1% CAGR through 2031.
- By crop application, the crop-based segment accounted for a 34% share in 2025 and is anticipated to outpace the market at an 11.7% CAGR from 2026 to 2031.
- By form, liquid formulations captured 68% share in 2025 and are projected to rise at a 10.3% CAGR through 2031.
- By function, wetting agents led with 55% share in 2025, whereas penetrant and adjuvant formulations are expanding at 14.9% CAGR through 2031.
- By geography, North America commanded 38% of revenue in 2025, but Asia-Pacific is forecast to register an 11.5% CAGR through 2031.
Note: Market size and forecast figures in this report are generated using Mordor Intelligence’s proprietary estimation framework, updated with the latest available data and insights as of January 2026.
Market Trends and Insights
Drivers Impact Analysis of Agricultural Surfactants Market*
| Driver | (~) % Impact on CAGR Forecast | Geographic Relevance | Impact Timeline |
|---|---|---|---|
| Rising demand for agrochemicals to boost crop yield | +2.1% | Global, with intensity peaks in Asia-Pacific, Africa, and South America | Medium term (2-4 years) |
| Precision-farming adoption increasing surfactant usage | +1.8% | North America and Europe core, spill-over to Australia and Brazil | Medium term (2-4 years) |
| Growing focus on sustainable and bio-based surfactants | +1.5% | Europe and North America lead, regulatory pull in Asia-Pacific | Long term (≥ 4 years) |
| Nano-surfactant innovations enabling ultra-low doses | +1.3% | Asia-Pacific core, early trials in North America and Europe | Long term (≥ 4 years) |
| Biological crop-protection compatibility requirements | +1.0% | Global, with accelerated adoption in Europe and North America organic segments | Medium term (2-4 years) |
| Ultra-high-concentration formulations for drone spraying | +0.9% | Asia-Pacific leads, emerging in Brazil and select North American states | Short term (≤ 2 years) |
| Source: Mordor Intelligence | |||
Rising Demand for Agrochemicals to Boost Crop Yield
Climate swings and pest resistance necessitate multiple spray passes each season, resulting in increased surfactant kilograms per hectare. Brazil cleared 100 new crop-protection products in August 2024, which is anticipated to lift demand for soybean and corn adjuvants[1]. India’s pesticide sales increased significantly in 2024, with surfactants outpacing actives due to challenges in penetrating hard water. China experienced growth in herbicide sales in 2025, amid labor shortages in rice and wheat, which led to increased demand for chemical weed control that relies on adjuvants for leaf adhesion. The spike in post-emergence herbicides that need surface tension below 30 dynes/cm favors nonionic and oil-based chemistries on smallholder farms.
Precision-Farming Adoption Increasing Surfactant Usage
Variable-rate sprayers now modulate adjuvant dose by canopy density, soil moisture, and wind speed. North American farm penetration increased in 2024, and algorithms showcased by Corteva in November 2024 recommend bespoke surfactant blends, trimming total spray volume by 20% and extending equipment uptime. Europe’s drift-reduction rules accelerate investment in nozzle technology and adjuvant formulations that hold droplet size within tight bands. Australia’s grain belt links GPS booms with inline surfactant injectors, cutting adjuvant waste by 15% per season.
Growing Focus on Sustainable and Bio-Based Surfactants
Retailer policies and ESG targets push formulators to replace petroleum-based inputs despite 25%-40% cost premiums. BASF rolled out Sokalan CP 301 in April 2025, a plant-derived dispersant that meets EU Ecolabel criteria. Nouryon followed with Adsee Flex 960, posting a 35% greenhouse-gas reduction versus conventional ethoxylates. REACH and EPA Safer Choice certifications reward suppliers that demonstrate biodegradability and low aquatic toxicity.
Nano-Surfactant Innovations Enabling Ultra-Low Doses
Particle sizes below 10 nanometers improve cuticle penetration by 50% and cut active-ingredient rates by up to 40%. Field data from 2024 rice and soybean trials confirm faster systemic translocation, making nano-emulsions attractive where new actives face regulatory delays. Phytotoxicity under 85% relative humidity remains a hurdle, prompting humidity-responsive designs that alter droplet coalescence in tropical climates.
Restraints Impact Analysis of Agricultural Surfactants Market*
| Restraint | (~) % Impact on CAGR Forecast | Geographic Relevance | Impact Timeline |
|---|---|---|---|
| High production cost of bio-based raw materials | -1.4% | Global, with acute margin pressure in Europe and North America | Medium term (2-4 years) |
| Stringent regulations on chemical residues | -1.2% | Europe and North America lead, cascading to export-oriented Asia-Pacific producers | Long term (≥ 4 years) |
| Feedstock supply volatility for specialty ethoxylates | -0.9% | Global, with supply-chain bottlenecks in Southeast Asia | Short term (≤ 2 years) |
| Phytotoxicity concerns with nano-formulations in humid tropics | -0.7% | South America, Africa, and Southeast Asia | Medium term (2-4 years) |
| Source: Mordor Intelligence | |||
High Production Cost of Bio-Based Raw Materials
Fermentation-derived fatty alcohols raise costs by up to 40% versus petroleum feedstocks. Palm oil rose 22% in early 2025 after Indonesia tightened exports, inflating nonionic input costs. Ethylene oxide volatility of 30-35% from 2024-2025 hampered small formulators that lack long contracts, undermining competitiveness against integrated majors. Price spikes in palm and soybean oil cascade through the value chain, lifting contract prices for bio-surfactant intermediates by double digits within a single quarter. Formulators without vertical integration must absorb this volatility or pass it to growers, a strategy that erodes demand in price-sensitive row crops.
Stringent Regulations on Chemical Residues
REACH (Registration, Evaluation, Authorisation and Restriction of Chemicals) and the United States Pesticide Registration Improvement Act enforce residue limits and now require inert-ingredient disclosure. Compliance per active costs USD 2-5 million, including toxicology and field trials. Export-oriented producers in India and China are reformulating to avoid bans in premium markets. Toxicology, environmental fate, and multi-crop field residue studies stretch registration timelines by 24 to 30 months, delaying revenue from new launches. Failure to meet emerging limits can trigger border rejections that halt exports overnight, an acute threat for Indian and Chinese formulators serving premium fruit and vegetable chains.
*Our forecasts treat driver/restraint impacts as directional, not additive. The impact forecasts reflect baseline growth, mix effects, and variable interactions.
Agricultural Surfactants Market Segment Analysis
By Product Type:
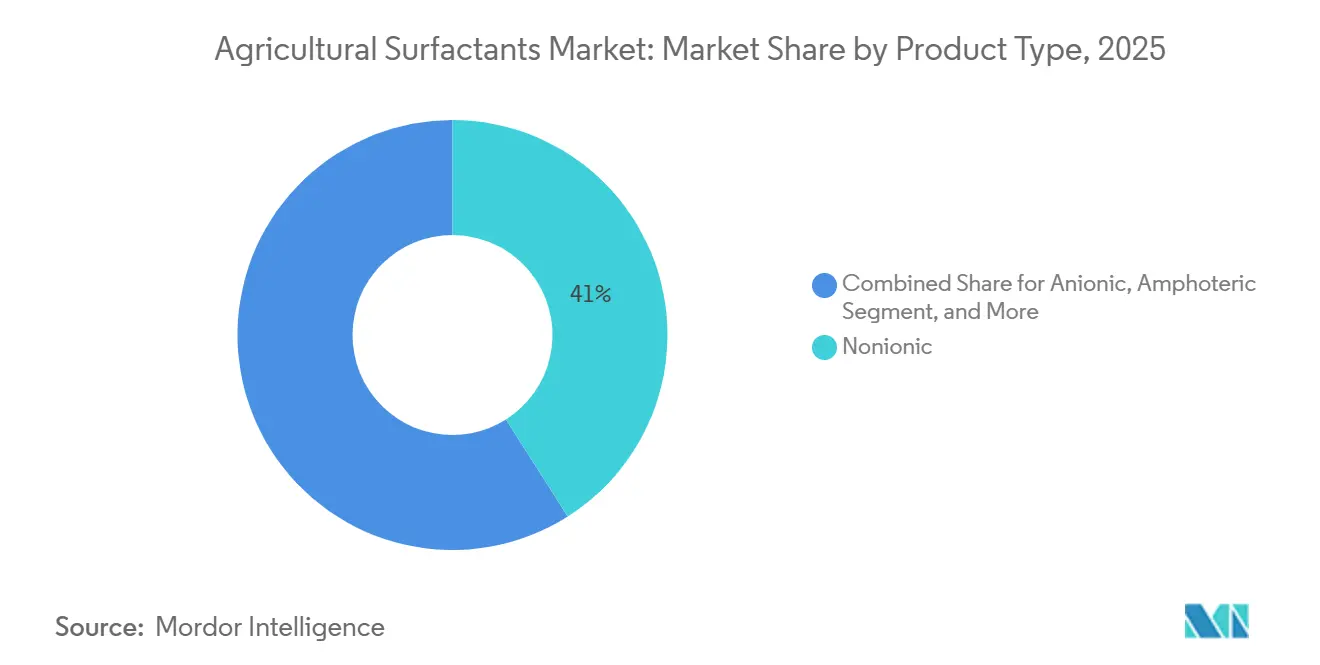
Nonionic Dominance Faces Bio-Based DisruptionNonionic chemistries controlled 41% share in 2025, favored for broad compatibility and hard-water tolerance. Oil-based alternatives rise at 13.2% CAGR as post-emergence herbicides need deeper cuticle penetration. Regulatory phase-outs of nonylphenol ethoxylates open a USD 180-220 million replacement pool. Bio-based nonionics, such as BASF’s Sokalan CP 301, anchor the pivot toward renewable content.
The agricultural surfactants market benefits from synthetic robustness in early-season cold spells, while hybrid blends balance cost and sustainability. Amphoteric and cationic options stay niche yet grow with aquatic weed programs and pH-buffered tank mixes. Innovation continues in dispersants such as Clariant’s Dispersogen TP 100 T for wettable powders, underscoring ongoing innovation in this mature segment, while Ashland's easy-wet 300 n super wetting agent, commercialized in September 2024, targets low-surface-tension applications in precision spraying.

By Application:
Herbicide Leads, Fungicide Compatibility AcceleratesHerbicide applications commanded 46% of surfactant consumption in 2025, reflecting the dominance of glyphosate, glufosinate, and dicamba programs in row-crop agriculture. Fungicide-friendly adjuvants grow at 12.4% CAGR driven by late-season disease pressure in high-value crops and the proliferation of biological fungicides that demand non-ionic, low-toxicity adjuvants to preserve microbial viability. Insecticide adjuvants rise in Asia-Pacific cotton and rice, where integrated pest management boosts coverage needs.
BASF's October 2024 partnership with AgroSpheres on bioinsecticide delivery platforms illustrates the strategic importance of surfactant compatibility in biological crop protection, a segment forecast to reach USD 12 billion globally by 2030. Compatibility with triazole and strobilurin fungicides steers product design, as evidenced by Nouryon’s Adsee Flex 960. Drone sprayers elevate systemic herbicide needs, reinforcing demand for penetrant agents. Tank-mix simplicity also drives multipurpose formulations that combine wetting, penetration, and drift control.
By Substrate:
Synthetic Volume Meets Bio-Based VelocitySynthetic substrates held 64% market share in 2025, anchored by petroleum-derived ethoxylates and sulfonates that offer predictable performance and cost advantages of 25-40% over bio-based alternatives. Bio-based substrates are projected to grow at an 18.1% CAGR to 2031, driven by retailer sourcing mandates, corporate ESG commitments, and regulatory incentives in Europe and North America that favor renewable carbon inputs. Price parity edges closer as fermentation technology scales, with Clariant’s Synergen Soil matching synthetic benchmarks in Europe.
Hybrid blends with 30-50% renewable carbon content strike a middle ground, meeting ESG goals without compromising performance. Cold-weather viscosity challenges persist for bio-based ethoxylates, keeping synthetic anchors in early-season sprays. Carbon taxes and supply-chain emission tracking further tilt adoption toward plant-based feedstocks. The substrate segmentation is evolving toward hybrid blends that combine synthetic performance with bio-based content sufficient to meet sustainability thresholds, a strategy that balances cost, efficacy, and regulatory compliance.
By Crop Application:
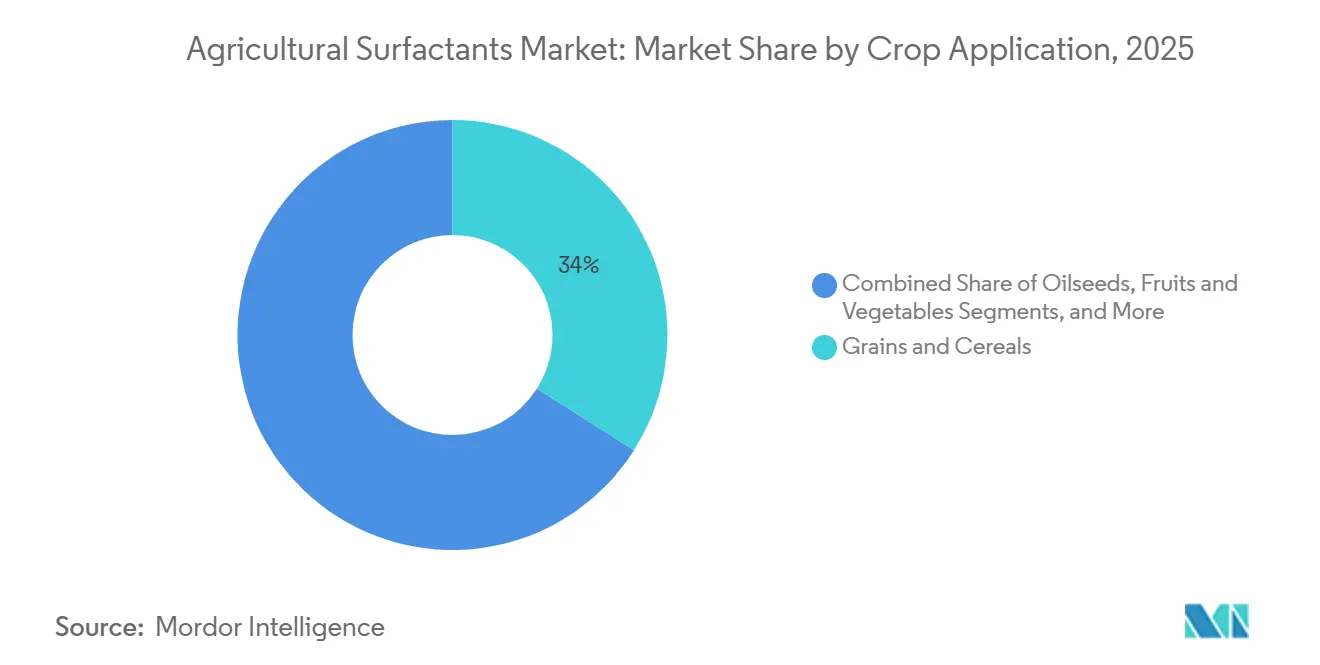
Crop-based Grains Anchor, Fruits and Vegetables SurgeCrop-based segment absorbed 34% of surfactant volume in 2025 due to vast wheat, corn, rice, and soybean acreage. The segment also outpaced the market at an 11.7% CAGR through 2031, reflecting premium pricing for residue-free produce and growing biological fungicide use. Oilseeds, including canola, sunflower, and rapeseed, account for approximately 20% of crop-based demand and are expanding in Eastern Europe and Australia as growers diversify rotations to manage herbicide-resistant weeds.
Residue concerns in fresh produce push non-phytotoxic wetting agents. Early-season vegetable programs adopt Clariant’s Synergen Guard 100 for low-temperature efficacy. Large-acreage grains leverage economies of scale, lowering per-hectare adjuvant cost to USD 2-4, yet rely on penetrant surfactants for resistant weeds in dicamba and glyphosate programs. Turf and ornamental applications prioritize low-phytotoxicity formulations that preserve visual quality, a requirement that limits surfactant selection to nonionic and amphoteric chemistries with proven safety profiles on sensitive species.
By Form:
Liquid Convenience Dominates Powder NichesLiquid formulations commanded 68% share in 2025, enabling real-time metered injection in precision sprayers. Drone adoption and automation drive a 10.3% CAGR for liquids. Powders appeal in regions lacking cold-chain logistics, as they resist phase separation under temperature swings. These products offer logistical advantages in remote geographies with limited cold-chain infrastructure, as powder forms tolerate temperature extremes that cause liquid surfactants to gel or separate. Preparation time and labor requirements limit powder uptake in large United States and European farms.
Clariant’s Dispersogen TP 100 T shores up the wettable powder segment, ensuring particle suspension in hard water. South America and Africa still favor powders for cost containment, though liquids dominate biological inputs where dust can damage microbial spores. Liquid surfactants are also preferred in biological crop protection, as powder forms can generate dust that damages microbial viability during handling.
By Function:
Wetting Agents Lead, Penetrants Gain TractionWetting agents held 55% share in 2025 by reducing surface tension to 25-30 dynes/cm. Penetrants grow at 14.9% CAGR, vital for systemic herbicides and ultra-concentrated drone sprays. They enable active ingredients to breach cuticle barriers within 30 to 60 minutes of application, a speed advantage that reduces vulnerability to rain washoff and extends application windows in regions with unpredictable weather. Dispersants remain essential for powder formulations in niche herbicide blends.
Ashland’s easy-wet 300 n drops tension to 22 dynes/cm, aiding onion and brassica coverage. Nouryon's Adsee Flex 960, launched in April 2025, combined wetting and penetrant functions in a single formulation, simplifying tank-mix protocols and reducing adjuvant inventory for growers managing multiple herbicide chemistries. Multifunctional surfactants that merge drift control with wetting and penetration lead new product pipelines across the agricultural surfactants market.
Geography Analysis
North America Agricultural Surfactants Market
North America dominated with 38% share in 2025. Large row-crop operations embrace precision sprayers that align adjuvant dose with canopy maps, reducing water use by up to 30%. Regulatory influence from the EPA's Pesticide Registration Improvement Act is forcing reformulation of legacy surfactants. Mexico's agricultural sector is expanding surfactant usage in avocado and berry production, where export markets demand residue-free produce that meets stringent maximum residue limits.
APAC Agricultural Surfactants Market
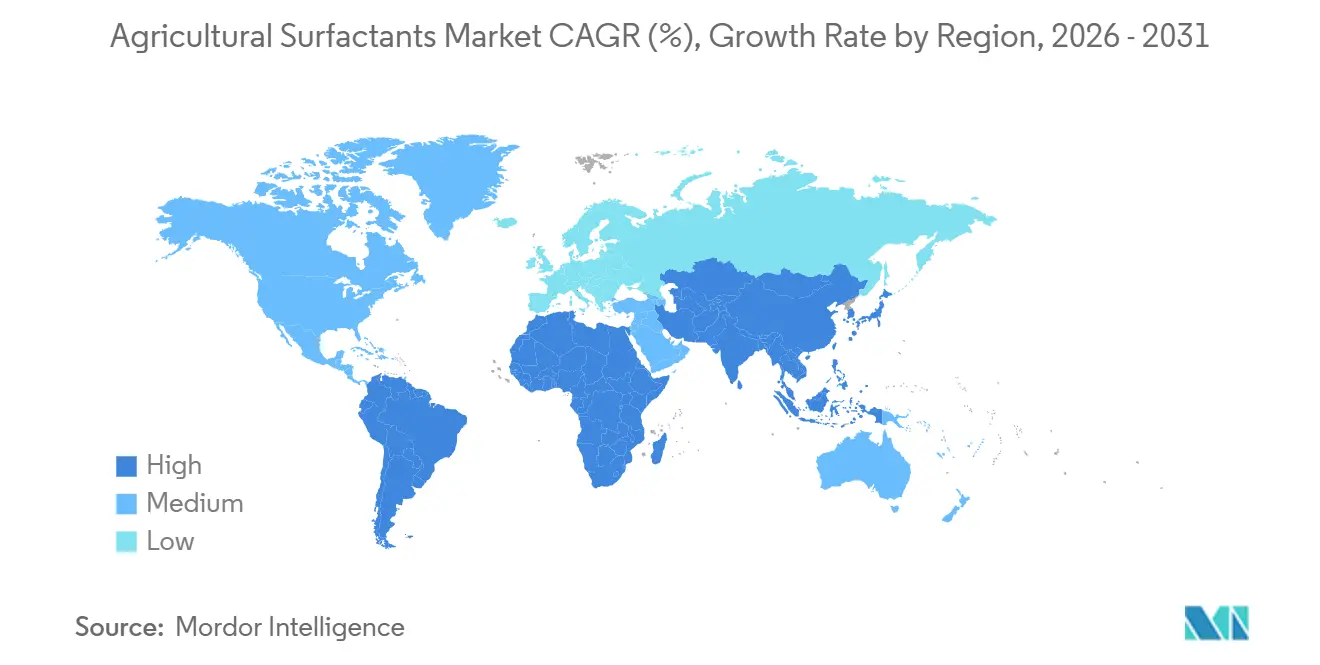
Asia-Pacific represents the fastest expansion at 11.5% CAGR. India’s hard-water conditions and China’s labor shortages elevate adjuvant requirements, and drone programs compress payload volume by 75%. Ultra-high-concentration formulations for drone spraying are advancing rapidly in China, where regulatory approvals for aerial application were streamlined in 2024. Humidity-driven phytotoxicity in tropical zones slows nano-emulsion rollouts but accelerates development of moisture-responsive blends suited for rice and soybean[3].
EMEA and South America Agricultural Surfactants Market
Europe advances, guided by REACH and carbon taxes that reward biodegradable inputs. Germany, France, and the United Kingdom lead investments in drift-control technology. South America is growing as Brazil adds crop-protection registrations and pushes systemic herbicide penetration in its expanded soybean acreage. Africa and the Middle East's growth is supported by intensification and precision irrigation.
Regulatory Landscape
In the European Union, agricultural surfactants used as co-formulants and adjuvants are subject to tighter controls under plant protection and chemicals legislation. In May 2026, Commission Regulation (EU) 2026/1120 updated Annex III of Regulation (EC) No 1107/2009 by adding 12 substances identified as unacceptable co-formulants for use in plant protection products or adjuvants, triggering product-portfolio reviews and reformulation work. Member States must amend or withdraw authorisations for products containing these co-formulants by 16 June 2028. Separately, Regulation (EU) 2024/1487 established a work programme for the gradual review of safeners and synergists, with applications considered from July 2025, reinforcing data and disclosure expectations for non-active components that commonly rely on surfactant systems.
In the United States, compliance for surfactants used as inert ingredients in pesticide products applied to food sites is anchored in the Federal Food, Drug, and Cosmetic Act (FFDCA) and EPA requirements for tolerances or tolerance exemptions (40 CFR 180). Grower-added adjuvants for pesticide use dilutions are further bounded by conditions in 21 CFR 172.710, which enumerates specific permitted adjuvant classes for field dilution addition. This framework raises the bar for inert-ingredient identity and use conditions and supports the market shift toward biodegradable and lower-toxicity surfactant chemistries that can more readily align with EPA and USDA organic-related inert-ingredient considerations.
Competitive Landscape
Market concentration is moderate, with the top five suppliers capturing a significant share of 2025 revenue. BASF is leveraging vertical feedstock integration and EU-compliant biodegradable launches[2]. Corteva couples adjuvants with its digital platform, creating switching costs for growers. Solvay rounds out the tier-one group, pursuing bio-based and nano-emulsion innovation. Strategic patterns center on vertical integration of bio-based feedstocks, nano-emulsion platform development, and partnerships with biological-input suppliers to capture adjacency opportunities in crop protection.
White-space potential lies in humidity-responsive nano-surfactants that prevent leaf burn, particularly in tropical soybeans and rice. Smaller challengers such as Marubeni Corporation, Clariant, and Nouryon disrupt through rapid launch cycles and renewable content. Ashland and Bionema focus on specialty niches like low-tension wetters for onions and biological-compatible adjuvants. They are targeting bio-based and precision-farming segments where legacy players lack differentiated offerings.
Regulatory compliance costs favor integrated majors with captive toxicology labs. Digital agronomy partnerships shape future competition as algorithms prescribe adjuvant blends by microclimate. The competitive landscape is bifurcating into scale players that compete on cost and distribution reach, and innovation specialists that capture premium pricing through differentiated performance in niche applications like drone spraying and biological inputs.
Agricultural Surfactants Industry Leaders
-
BASF SE
-
Corteva Agriscience
-
Nouryon
-
Solvay SA
-
Marubeni Corporation
- *Disclaimer: Major Players sorted in no particular order

Agricultural Surfactants Market Companies Covered in this Report
- Corteva Agriscience
- BASF SE
- RAG-Stiftung
- Croda International Plc
- Solvay SA
- Nouryon
- Clariant International Ltd.
- Wilbur-Ellis Company LLC
- Nufarm
- Kao Corporation
- Lamberti S.p.A.
- Brandt, Inc.
- GarrCo Products, Inc.
- Bionema
- Innospec Inc.
- Stepan Company
- Loveland Products, Inc. (Nutrien)
- Norac Concepts Inc.
- Marubeni Corporation
Market Opportunities and Future Outlook
Regulatory-driven substitution is creating near-term whitespace for suppliers that can replace restricted or scrutinized chemistries while maintaining spray performance. In the EU, the updated requirements and substance-level controls that apply to co-formulants and surfactants (including the May 2026 update to Annex III of Regulation (EC) No 1107/2009) are accelerating reformulation cycles and increasing demand for transparent, compliant inert packages. This is supporting opportunities in bio-based and biodegradable nonionic systems, as well as multifunctional adjuvants that combine wetting, drift control, and water conditioning to reduce the number of tank-mix components that must be qualified and documented.
Precision application trends are also shaping a product-design lane for high-concentration and aerial-use surfactant systems. Product launches such as Rovensa Nexts ORO-5 (June 2026), positioned as a multifunctional adjuvant for drift reduction and water conditioning, highlight commercialization aimed at performance under variable water quality and modern nozzle and application constraints. Academic work published in April 2026 on plant-derived polyoxyethylene fatty acid esters and interfacial film-forming adjuvants for drone spraying supports technical differentiation pathways beyond conventional ethoxylates and silicones, aligning with the report focus on ultra-high-concentration formulations and biological-compatibility requirements.
Recent Industry Developments in Agricultural Surfactants Market
- May 2026: BASF introduced Basta ULTRA in Australia, a non-selective herbicide featuring Glu-L technology and a rainfast formulation registered by the Australian Pesticides and Veterinary Medicines Authority (APVMA). The product positioning emphasizes formulation performance attributes that depend on adjuvant and surfactant behavior (coverage, retention, and weatherability), reinforcing demand for higher-performing wetting and penetrant systems in regulated markets.
- April 2026: BASF launched Liberty ULTRA in Australia, a glufosinate herbicide using Glu-L technology and the Liberty Lock formulation, registered by the APVMA. By embedding droplet adhesion and spreading functionality into the formulation concept, the launch highlights tighter integration between crop-protection actives and surfactant-enabled performance, raising the bar for compatible agricultural surfactant packages.
- September 2024: Ashland commercialized easy-wet 300 n, a biodegradable, silicone-free, nonionic super wetting agent for crop-protection uses including corn, soy, wheat, and specialty produce. The launch supports the ongoing shift toward high-performance, non-silicone wetters that can fit sustainability and residue-sensitive programs without sacrificing coverage on difficult-to-wet crops.
Agricultural Surfactants Market Report Scope and Research Methodology
Market Definition and Coverage
For this methodology, the agricultural surfactant market covers surfactants intentionally added to crop-protection spray mixes to improve wetting, spreading, retention, and penetration on crops. The sizing is counted as the value of these surfactant products sold for on-farm and professional crop applications across regions.
Scope exclusions: We exclude surfactants used only for livestock hygiene, post-harvest washing, and general household or industrial cleaning.
Segments Covered in This Report
- By Product Type
- Anionic
- Nonionic
- Cationic
- Amphoteric
- Oil-based Surfactants
- By Application
- Herbicide
- Insecticide
- Fungicide
- Other Applications
- By Substrate
- Synthetic
- Bio-based
- By Crop Application
- Crop-based
- Grains and Cereals
- Oilseeds
- Fruits and Vegetables
- Non-crop-based
- Turf and Ornamental Grass
- Other Crop Applications
- Crop-based
- By Form
- Liquid
- Powder/Granular
- By Function
- Wetting Agent
- Dispersant
- Penetrant/Adjuvant
- By Geography
- North America
- United States
- Canada
- Mexico
- Rest of North America
- Europe
- Germany
- United Kingdom
- France
- Spain
- Italy
- Russia
- Rest of Europe
- Asia-Pacific
- China
- India
- Japan
- Australia
- Rest of Asia-Pacific
- South America
- Brazil
- Argentina
- Rest of South America
- Middle East
- Saudi Arabia
- United Arab Emirates
- Turkey
- Rest of Middle East
- Africa
- South Africa
- Nigeria
- Rest of Africa
- North America
Data Sources, Market Sizing, and Validation
Desk Research
Desk work was used to pin down demand context and the supply chain realities that sit behind agricultural surfactant consumption. We relied on public sources such as USDA crop and pesticide-use publications, FAOSTAT crop area and output series, Eurostat agriculture indicators, and UN Comtrade trade flows for relevant chemical categories, which together help set guardrails around volumes and regional mix.
In parallel, we reviewed company annual reports and investor presentations, product labels and regulatory listings, association websites, and trusted press coverage to understand how surfactants are positioned inside spray programs and how pricing typically moves with feedstock costs. Where needed, we also checked a paid subscription for company financials and another for shipment-level import and export signals to sanity-check directionally what was visible in public data. These desk sources are illustrative only, and many other references were used to collect, cross-check, and clarify data points during the work.
Primary Interviews and Surveys
Primary work focused on validating what gets counted as an agricultural surfactant in real buying situations and how it is priced in different channels. We spoke with a mix of formulators, distributors, and crop input advisers, then we used follow-up checks to confirm usage rates by crop, typical tank-mix practices, and how bio-based and specialty surfactants are being adopted across APAC, EMEA, and the Americas.
Distribution of primary research fieldwork respondents
| Company type | Respondent position | Region |
|---|---|---|
| Top tier: 31% | CXOs: 12% | APAC: 43% |
| Mid tier: 55% | Functional/Unit leaders: 40% | EMEA: 35% |
| Smaller Players: 14% | Managers: 48% | Americas: 22% |
Market-Sizing & Forecasting
Sizing starts with a top-down build where crop area and crop-protection spray intensity are used to reconstruct the addressable demand pool, then we adjust by typical surfactant treat rates and the share of spray programs that actually include a surfactant. Those demand signals were converted into value using region-specific price bands that reflect mix shifts between commodity chemistries and higher value specialty and bio-based offerings.
Selective bottom-up checks were then used to keep totals realistic, including sampled price per liter or kilogram by channel, distributor-level mix comments, and a limited roll-up of supplier revenue exposure where it was clearly reported. Where company disclosures were not granular, gaps were handled through application-level allocation and cross-checks on trade and production indicators, followed by analyst review.
For the forecast, scenario analysis was used, anchored on variables that primary respondents agreed are the most sensitive in this market. Key inputs included planted area trends for major crops, herbicide and fungicide program intensity, regulatory pressure on certain chemistries, bio-based adoption rates, and feedstock-driven price movement for common surfactant building blocks. Assumptions were stress-tested so growth was not driven by one single input, and the final series stayed consistent with observed agronomy cycles and procurement behavior.
Data Validation & Update Cycle
Outputs were cross-checked against independent signals such as crop chemical demand direction, trade movement for relevant chemical categories, and the implied per-hectare usage levels by crop group. When the model produced outliers, the driver was traced back to either a price step-change, a mix assumption, or a penetration estimate, and then corrected only after a second review.
Before sign-off, the analysis goes through multiple internal checks so that arithmetic, conversions, and regional splits remain consistent across the full time series. Reports are refreshed annually, and interim updates are triggered when material events occur, such as regulatory shifts, sharp feedstock price changes, or major supply disruptions. Right before delivery, we complete a fresh pass to ensure the numbers reflect the latest available indicators.
Mordor Intelligence's Agricultural Surfactant Market Sizing Compared With Other Published Estimates
Published market sizes for agricultural surfactants can look different even when they appear to cover the same topic. Differences usually come from what is counted as an agricultural surfactant versus a broader adjuvant pool, how pricing is normalized across regions, and whether the base year is updated after new crop and procurement signals appear.
The main gap comes from whether spray adjuvants outside surfactants are bundled into the total, where Mordor Intelligence counts only surfactant products used to improve wetting, spreading, retention, or penetration in crop-care sprays and keeps out adjacent additive categories that can inflate the number. Smaller spreads also show up when one estimate leans on a single base year and fixed prices, while another model updates mix and currency timing as raw-material costs and channel discounts shift.
Benchmark comparison
| Source | Market Size | Gaps in Research Methodology |
|---|---|---|
| Mordor Intelligence | USD 2.26 B (2025) | |
| Global Consultancy A | USD 1.56 B (2025) | Uses a narrower value pool tied closely to a base-year pricing snapshot, which can understate regions where specialty grades and higher channel margins are more common. |
| Industry Publisher B | USD 1.96 B (2025) | Applies a different inclusion set and regional weighting, and the price progression is less transparent, which can shift totals when mix moves toward bio-based and premium functions. |
The comparison shows that the spread is mostly explained by scope choices and by how price and mix are refreshed across regions and crop programs. By tying the total to crop spray intensity, practical usage rates, and realistic price bands that can be checked, the final estimate stays traceable to clear steps that can be repeated and reviewed.
Key Questions Answered in the Report
What is the projected value of the agricultural surfactants market by 2031?
It is projected to reach USD 3.35 billion by 2031, growing at a 6.9% CAGR.
Which region will grow the fastest through 2031?
Asia-Pacific is anticipated to register the highest CAGR at 11.5% through 2031 as smallholders adopt drone spraying and precision farming.
Which product type currently leads the market?
Nonionic surfactants hold the largest share at 41% in 2025 because of their broad compatibility with herbicides, insecticides, and fungicides.
How are regulations influencing product development?
REACH and EPA residue limits are accelerating the shift to biodegradable, bio-based ingredients and prompting reformulation of legacy ethoxylates.
What technology trend is reshaping surfactant usage?
Real-time digital agronomy platforms now prescribe surfactant blends based on canopy density and weather, lowering spray volume by up to 30%.
Which companies dominate the competitive landscape?
BASF, Corteva, Marubeni Corporation, Nouryon, and Solvay collectively control a significant share of global revenue.