
Agricultural Biologicals Testing Market Size and Share
Market Overview
| Study Period | 2021 - 2031 |
|---|---|
| Market Size (2026) | USD 3.37 Billion |
| Market Size (2031) | USD 7.09 Billion |
| Growth Rate (2026 - 2031) | 16.09 % |
| Fastest Growing Market | Asia Pacific |
| Largest Market | Europe |
| Market Concentration | Medium |
Major Players *Disclaimer: Major Players sorted in no particular order Image © Mordor Intelligence. Reuse requires attribution under CC BY 4.0. | |
Agricultural Biologicals Testing Market Analysis by Mordor Intelligence
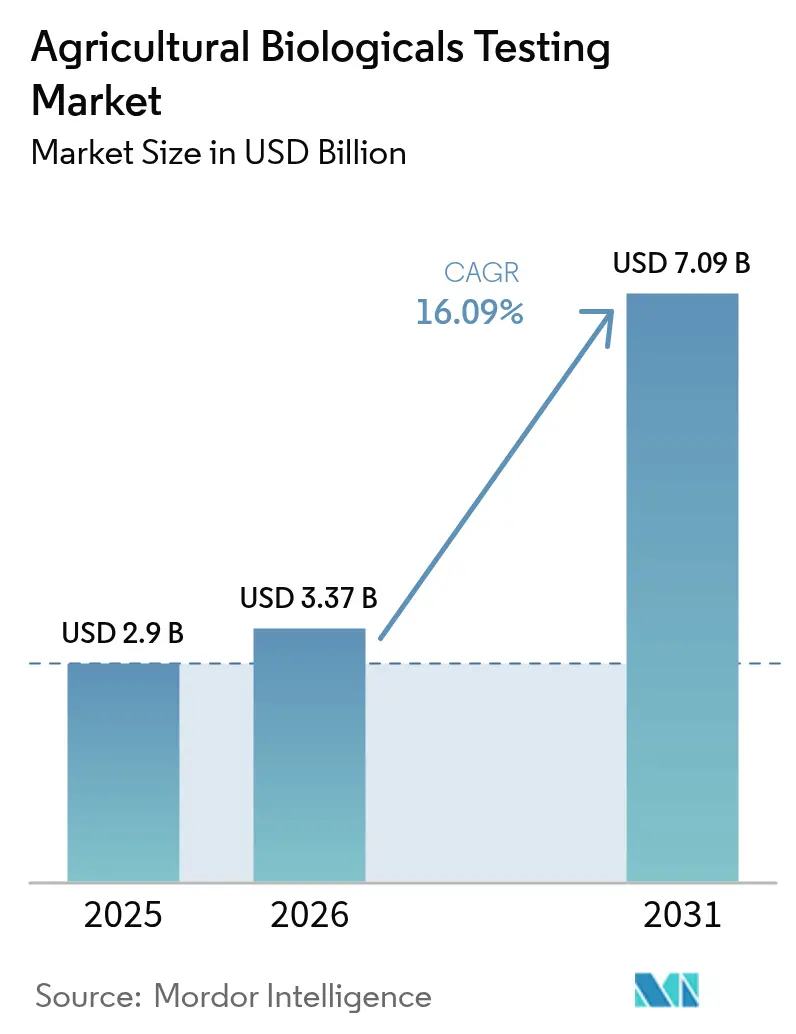
The agricultural biologicals testing market size was valued at USD 2.9 billion in 2025 and estimated to grow from USD 3.37 billion in 2026 to reach USD 7.09 billion by 2031, at a CAGR of 16.09% during the forecast period (2026-2031). This rapid growth is rooted in tighter global regulations that demand exhaustive efficacy and safety evidence for biological inputs, rising adoption of sustainable crop protection, and the spread of next-generation sequencing in laboratory workflows[1]Source: “Biochemical Pesticides,” Environmental Protection Agency, epa.gov. Independent laboratories are expanding automated high-throughput platforms that shorten study timelines, while harmonized templates between major regulators are beginning to cut duplicative submissions[2]Source: “Pest Management Regulatory Agency,” Health Canada, canada.ca. Flexible outsourcing models let biological start-ups gain premium testing capacity without the fixed cost of Good Laboratory Practice (GLP) facilities, and digital traceability mandates are transforming reports into real-time blockchain-ready data streams[3]Source: “Digital Product Passports,” European Commission, ec.europa.eu.
Key Report Takeaways
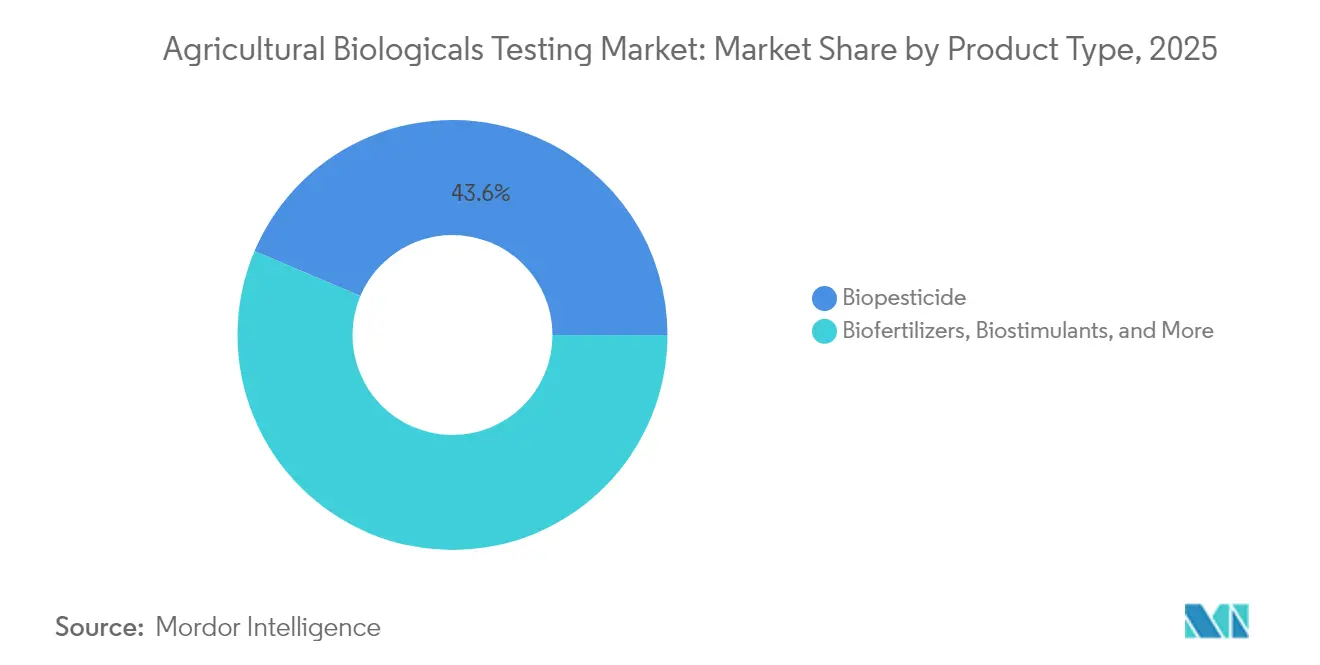
- By product type, biopesticides held 43.62% of the agricultural biologicals testing market share in 2025, and biostimulants testing is projected to advance at a 17.15% CAGR through 2031.
- By application, field support dominated with a 40.12% revenue share in 2025, while analytical services are anticipated to expand at a 17.44% CAGR through 2031.
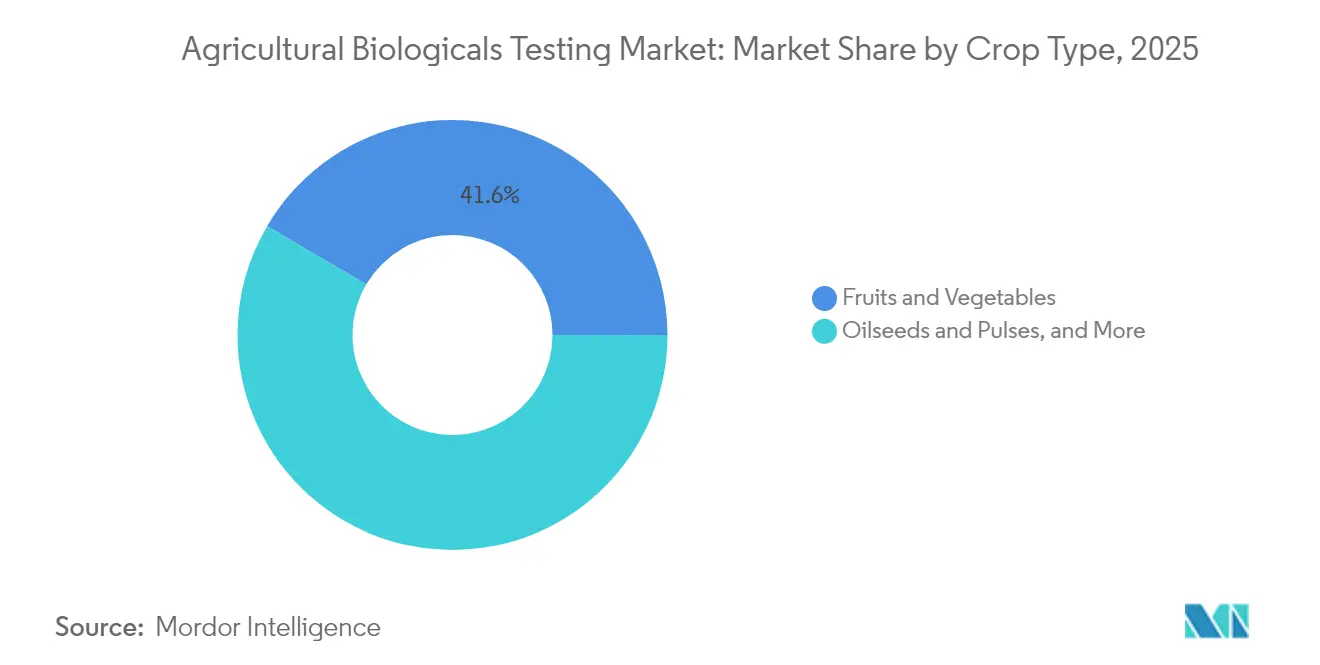
- By crop type, fruits and vegetables accounted for a 41.55% slice of the agricultural biologicals testing market size in 2025, and oilseeds and pulses are forecast to climb at a 16.22% CAGR between 2026 and 2031.
- By geography, North America led the 2025 landscape with a 34.68% share in revenue, while Asia-Pacific is poised to advance at a 16.12% CAGR through 2031.
- The top five players, including Eurofins Scientific SE, SGS SA, Intertek Group plc, Bureau Veritas SA, and ALS Limited, collectively controlled a majority share of the agricultural biological testing market revenues in 2024.
Note: Market size and forecast figures in this report are generated using Mordor Intelligence’s proprietary estimation framework, updated with the latest available data and insights as of 2026.
Global Agricultural Biologicals Testing Market Trends and Insights
Drivers Impact Analysis*
| Driver | (~)% Impact on CAGR Forecast | Geographic Relevance | Impact Timeline |
|---|---|---|---|
| Expansion of Organic Farming Acreage | +2.8% | Europe and North America lead, global effect | Medium term (2-4 years) |
| Stringent Global Regulations Favoring Biologicals | +3.2% | North America, Europe, and Asia-Pacific | Long term (≥ 4 years) |
| Rising Consumer Demand for Residue-Free Food | +2.5% | Developed markets worldwide | Medium term (2-4 years) |
| Accelerated Research and Development Investments by Agro-Chemical Majors | +2.1% | North America and Europe | Long term (≥ 4 years) |
| Outsourcing Surge from Mid-Tier Biological Start-Ups | +1.9% | North America and Europe, expanding in the Asia-Pacific | Short term (≤ 2 years) |
| Digital Traceability and Crop Passport Mandates | +1.7% | Europe drives the global roll-out | Medium term (2-4 years) |
| Source: Mordor Intelligence | |||
Expansion of Organic Farming Acreage
Organic acreage continues to grow at a faster rate than conventional land, and certification bodies now require multi-season field trials, residue analytics, and soil microbiome studies before approving biological inputs. The United States National Organic Program has intensified residue surveillance, which requires laboratories to integrate advanced chromatographic and molecular workflows [4]Source: “National Organic Program,” United States Department of Agriculture, usda.gov . Europe’s organic scheme mirrors these testing demands and adds blockchain traceability, compelling labs to upgrade digital infrastructure. Field trials are conducted across diverse climatic zones to capture variability, thereby increasing testing volume over two to three harvests. Premium pricing for organic-certified products offsets the elevated testing spend, creating a durable funding loop for laboratory services. As regulators tighten organic input lists, manufacturers rely on independent Good Laboratory Practice (GLP) data to protect product positioning in lucrative organic channels.
Stringent Global Regulations Favoring Biologicals
The Environmental Protection Agency now requires molecular characterization and comprehensive toxicology for biochemical pesticides, while China’s Institute for the Control of Agrochemicals, Ministry of Agriculture (ICAMA), has adopted parallel microbial registration protocols [5]Source: “Institute for the Control of Agrochemicals, Ministry of Agriculture and Rural Affairs,” icama.org.cn. This convergence harmonizes fundamental data packages but raises documentation thresholds, favoring large GLP-certified providers. Post-market surveillance clauses extend testing well beyond launch, creating recurring laboratory revenue. Mutual recognition of data within selected trade blocs prevents full duplication, yet still necessitates region-specific residue and environment studies. Accelerated review lanes reward dossiers that include exhaustive analytics, pushing sponsors to invest in premium lab partners from the outset. The net effect is a larger, more predictable testing pipeline anchored to long-term regulatory compliance.
Rising Consumer Demand for Residue-Free Food
Retail and processor scorecards are increasingly requiring third-party verification that biological inputs leave no detectable chemical residues. High-sensitivity liquid chromatography-mass spectrometry (LC-MS) platforms now quantify active metabolites at part-per-billion levels, and the results are fed directly into supplier dashboards [6]Source: “Pesticide Residue Monitoring Program,” Food and Drug Administration, fda.gov. QR codes on produce packages let shoppers view the testing certificate, linking transparency to brand loyalty. Social media awareness campaigns amplify residue concerns and stimulate premium market segments, especially for fresh fruits and vegetables. Emerging economies emulate Western residue limits as export goals widen, expanding the addressable testing base. Continuous residue monitoring also informs risk communication strategies that maintain public trust in biological crop protection.
Accelerated Research and Development Investments by Agro-Chemical Majors
Global agrochemical leaders now channel up to 40% of discovery budgets into biological programs, a shift that generates demand for microbial bioassays, formulation stability screens, and multi-location efficacy trials. Outsourced testing bridges expertise gaps in molecular biology and metagenomics, where internal capabilities lag. Patent filings for biological agents have climbed 45% each year since 2024, swelling the backlog of studies needed for regulatory packages. Strategic alliances between multinationals and contract labs lock in multi-year volume commitments, letting labs secure financing for facility expansion. Artificial-intelligence discovery suites speed candidate selection but simultaneously multiply confirmatory assays, keeping the laboratory pipeline loaded across the decade.
Restraints Impact Analysis*
| Restraint | (~)% Impact on CAGR Forecast | Geographic Relevance | Impact Timeline |
|---|---|---|---|
| Lack of harmonized biological testing guidelines | -1.8% | Emerging markets feel the greatest impact | Long term (≥ 4 years) |
| High cost and duration of multi-location field trials | -2.1% | Asia-Pacific most affected | Medium term (2-4 years) |
| Limited reference material libraries for new microbes | -1.5% | Global, acute in novel categories | Medium term (2-4 years) |
| Scarcity of bioassay statisticians and QA auditors | -1.3% | North America and Europe | Short term (≤ 2 years) |
| Source: Mordor Intelligence | |||
Lack of Harmonized Biological Testing Guidelines
Regulatory fragmentation forces companies to repeat studies for each jurisdiction, multiplying cost and time. Disagreements over statistical endpoints and environmental safety benchmarks slow Organisation for Economic Co-operation and Development (OECD) harmonization efforts, particularly for RNA-based pesticides. Emerging markets often publish draft guidelines without enforcement clarity, deterring early testing investments. Smaller firms face disproportionate burdens, as parallel programs exhaust limited capital and personnel. Until standard terms and endpoints converge, laboratories must tailor protocols for every submission, reducing economies of scale and extending development cycles.
High Cost and Duration of Multi-Location Field Trials
Biological efficacy trials can exceed USD 500,000 per active ingredient and typically run across several growing seasons to capture environmental variability[7]Source: United States Department of Agriculture, “National Organic Program Handbook,” usda.gov. Weather volatility driven by climate change forces additional replicates to reach statistical significance, swelling budgets further. Insurance premiums for open-field deployment of novel microbes rise annually, and limited qualified sites create bottlenecks that delay project starts. Supply-chain hurdles, from shipping live inoculants to maintaining cold chains, compound logistical risk and expense. Collectively, these factors discourage smaller innovators and constrain market entry.
*Our forecasts treat driver/restraint impacts as directional, not additive. The impact forecasts reflect baseline growth, mix effects, and variable interactions.
Segment Analysis
By Product Type: Biopesticides Anchor Demand
The biopesticide segment held 43.62% agricultural biologicals testing market share in 2025, supported by mature regulatory frameworks and standardized GLP protocols. The agricultural biologicals testing market size associated with biopesticide registration is projected to keep rising through 2031 as microbial, botanical, and RNA-based products move through pipelines. Laboratories capitalize on established demand patterns, enabling predictable scheduling and utilization rates. Biofertilizers captured a 27.68% share as soil health gained global attention under EU Regulation 2019/1009. Growing clarity around biostimulant definitions propels that category to the fastest 17.15% CAGR, with test menus expanding into plant metabolomics and gene expression profiling. Labs are diversifying into these niches ahead of impending regulatory milestones that should unlock incremental volume.
Coupled with regulatory harmonization, product-type diversification buffers laboratories against cyclicality. Equipment amortization is spread across assay types, and cross-training scientists allows flexible staffing. As RNA-interference products approach launch, demand grows for molecular assays that verify mode of action and off-target effects, deepening service complexity and revenue per study.


By Application: Field Support Remains Core
Field support activities, multi-location trials, environmental fate studies, and application optimization accounted for 40.12% sales in 2025. This slice of the agricultural biologicals testing market is deeply integrated into growers’ commercialization timelines. Large-scale trials validate efficacy under real farm conditions, and their findings drive label claims and marketing messages. Regulatory dossiers, the second-largest application at a significant share, maintain steady demand due to ongoing registration renewals. The agricultural biologicals testing market size for analytical services, which include molecular diagnostics and sequencing, is expanding at an 17.44% CAGR as sponsors seek deeper insight into strain genetics and product purity.
Routine formulation stability and shelf-life work fills laboratory calendars during off-season months, helping even out capacity utilization. High-throughput analytics slash per-sample costs, encouraging smaller companies to request broader study panels that were once cost-prohibitive. Laboratories differentiate by bundling field and analytical programs into end-to-end packages, offering clients single-contract convenience and unified data reporting.
By Crop Type: Specialty Produce Dominates
High-value fruits and vegetables held a 41.55% share of the agricultural biologicals testing market size in 2025 because fresh-produce buyers enforce the toughest residue limits. Cereals and grains represented a significant share on the back of broad acreage and seed-treatment demand. Oilseeds and pulses posted the fastest 16.22% CAGR outlook, propelled by plant-protein market growth and expanding biological options. The remaining share is derived from ornamentals, turf, and forestry, segments that open additional seasonal laboratory windows and mitigate peak-capacity constraints. Crop diversification ensures balanced revenue throughout the agricultural calendar, allowing laboratories to manage workforce levels efficiently.
Regional production patterns deepen these dynamics and push laboratories to diversify crop expertise. California berry growers seek rapid turnaround residue tests to protect export channels, while Midwest corn producers commission large-plot field trials that validate seed treatment performance across variable soil types. In Europe, greenhouse tomato operations order continuous microbial monitoring to meet digital passport requirements, adding recurrent revenue streams. The agricultural biologicals testing market size tied to cereals and grains is also climbing because exporters must align with tightening import standards in high-value Asian markets. Collectively, crop-specific regulations and buyer protocols ensure sustained demand growth that is resilient across commodity cycles.
Geography Analysis
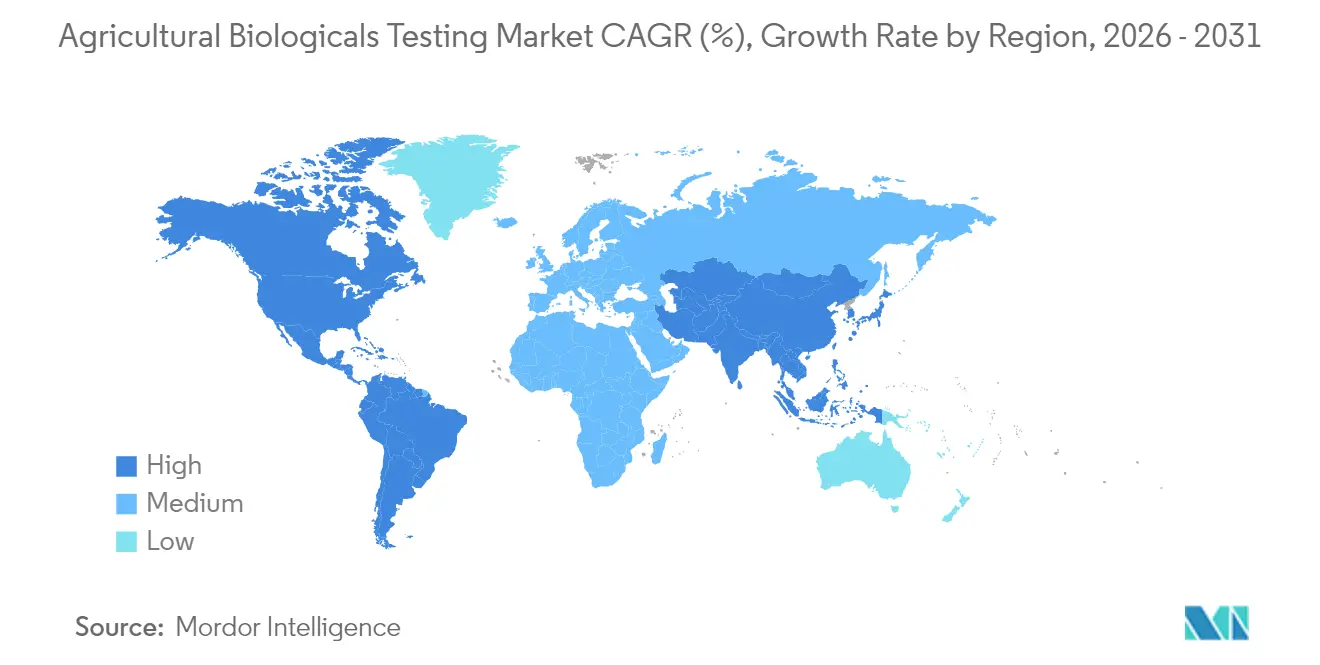
The Asia-Pacific region is the fastest-growing, with a 16.12% CAGR through 2031, as China enforces molecular data requirements for every microbial pesticide under its Association of Southeast Asian Nations (ICAMA) rules and Japan rolls out RNA-interference test protocols that necessitate advanced molecular diagnostics. China’s vast acreage generates steady demand because both domestic and multinational firms must run local trials to register new strains, while India’s organic acreage is expanding more than 12% each year and drives additional efficacy studies for certification bodies. South Korea is pairing biological inputs with smart-farm sensors, so laboratories there are upgrading data platforms that plug directly into Internet of Things dashboards. Lower labor costs also enable Asian testing companies to run large, multi-location trials at prices that undercut many Western providers. A nascent Association of Southeast Asian Nations (ASEAN) harmonization effort is underway to align study templates, which is expected to reduce regulatory friction across Southeast Asia over the next few years.
North America still holds the largest revenue share, at nearly 34.68% in 2025, as more than 200 GLP-certified facilities already cover the full spectrum of biological assays. A common template adopted by the United States Environmental Protection Agency and Canada’s est Management Regulatory Agency (PMRA) now saves sponsors up to 20% in duplicative study spend while keeping scientific rigor intact. Mexico’s export growers are sending testing volumes up 18% annually as they pursue residue-free certificates for shipments to the United States and Europe. Artificial-intelligence tools embedded in many United States labs cut data-review time by roughly one-quarter, freeing capacity for novel microbial containment studies. The region also benefits from strong university partnerships that pilot next-generation protocols before they spread worldwide.
Europe advances as Regulation 2019/1009 delivers the world’s most detailed roadmap for biostimulant testing. Germany and France account for more than 40% of regional revenue thanks to large farming sectors and strict compliance cultures. The United Kingdom’s post-Brexit rules set forces dual submissions, adding roughly 10% in extra study work for products sold on both sides of the Channel. Digital product passport rules that take effect later in the decade will require blockchain-ready test files, a shift that favors labs with sophisticated data infrastructure. Green Deal incentives and specialty hubs such as the Netherlands for greenhouse crops keep the regional pipeline full even as climatic zones vary widely across the continent.

Regulatory Landscape
Agricultural biologicals testing demand is closely tied to regulator-defined data packages for microbial, biochemical, and other biological inputs, with the United States Environmental Protection Agency (EPA) operating under FIFRA for pesticides and additional oversight pathways under the US Coordinated Framework for Regulation of Biotechnology. In the United States, EPA finalized the 2026 National Pollutant Discharge Elimination System (NPDES) Pesticide General Permit (PGP) in December 2024, covering discharges from pesticide applications (including products that leave a residue) with an effective term from October 31, 2026, through October 30, 2031. This raises documentation and reporting rigor for relevant applications and reinforces the need for validated residue, environmental, and use-pattern datasets.
Outside North America, regulators are formalizing dedicated regimes for bioinputs and tightening technical expectations for dossiers, which increases the value of GLP-aligned testing and life-cycle data management. Brazil enacted Law 15.070/2024 in December 2024 to regulate production, registration, commercialization, and inspection of bioinputs, and Brazil’s Ministry of Agriculture and Livestock (MAPA) held public consultation and technical meetings in January 2026 on a decree to operationalize the law, including registration processes and life-cycle management. In Europe, the policy direction continues to favor biocontrol and sustainable plant protection, building on updated data requirements for micro-organisms and placing greater emphasis on structured, submission-ready evidence across efficacy and safety endpoints.
Competitive Landscape
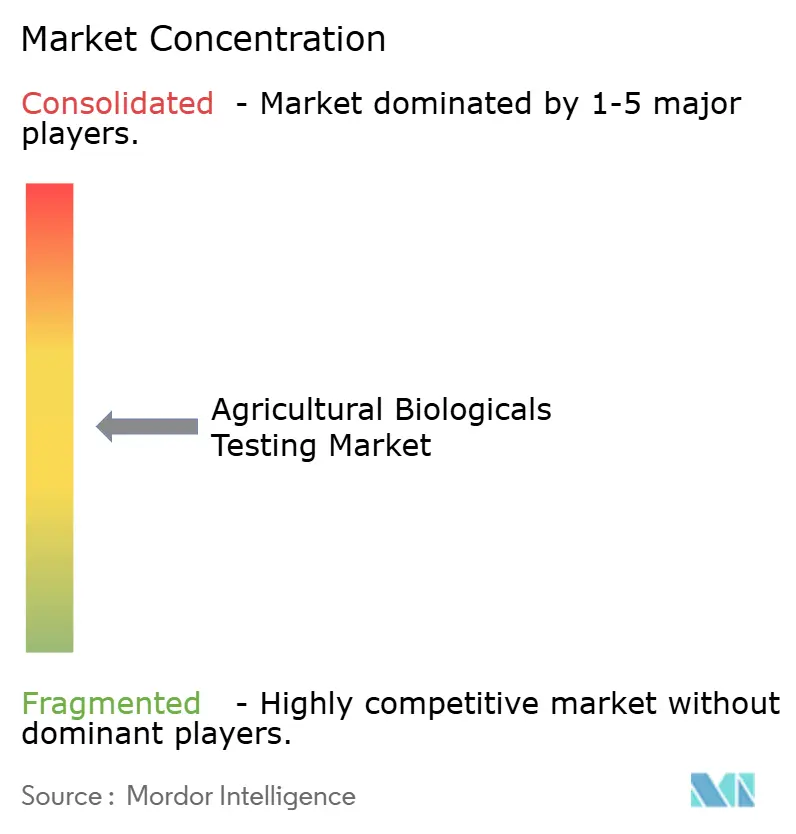
The agricultural biologicals testing market shows moderate concentration, because the five largest players together hold majority of global revenue, while many regional specialists fill local niches. Scale matters for regulatory expertise and capital investments, yet country-specific agronomy often rewards small firms that can turn reports around quickly and in local languages. Pricing power resides mainly with laboratories that combine GLP credentials with a global footprint, but clients still split work to keep competition alive. As a result, both multinational networks and agile independents capture profitable pockets of demand.
Eurofins Scientific leads with a major share and continues to grow through acquisitions such as Verdelab Bioscience, which added deep phytopathology skills in 2024. SGS SA is another prominent player in the industry and is further expanding its North American capacity and signing multi-year contracts with several crop-protection majors. Intertek put USD 18 million into European automation that pairs robotic handlers with artificial-intelligence analytics, while Bureau Veritas and ALS Limited have targeted soil microbiome and Asia-Pacific field services, respectively. These moves illustrate how capital spending and niche expertise both serve as effective growth levers.
Technology adoption remains the main battleground. Next-generation sequencing shortens microbial identification work, and automated high-throughput platforms shave weeks off efficacy trials. Cloud portals now give clients real-time study dashboards, which have quickly become a baseline expectation. White-space opportunities lie in RNA-based pesticides and complex microbial consortia that still lack standardized methods, so the first laboratories to master these assays will enjoy outsized pricing and early mover loyalty.
Agricultural Biologicals Testing Industry Leaders
Eurofins Scientific SE
SGS SA
Intertek Group plc
Bureau Veritas SA
ALS Limited
- *Disclaimer: Major Players sorted in no particular order

Market Opportunities and Future Outlook
Opportunities for agricultural biologicals testing providers center on three practical gaps: (1) containment-ready microbiology capacity for microbial pesticides, (2) higher-throughput analytical packages that reduce turnaround time for multi-season programs, and (3) localized quality control that shortens sample logistics and supports enforcement of biofertilizer and biostimulant standards. Private and public investments point to where capacity demand is being built: Smithers announced an operational BSL-2 compliant microbiology laboratory for biopesticide testing in April 2025, including analytical dose-verification and 5-batch analysis, and Yara International expanded laboratory facilities at its Hanninghof Research Centre in Dulmen, Germany, in March 2026 to support development and validation of biological crop solutions.
A second whitespace area is decentralization of testing capacity into producing regions, which can support faster lot release, complaint investigation, and authenticity checks for microbials and formulated products. In June 2026, the Punjab Agriculture and Farmers Welfare Department inaugurated Punjab’s first bio-fertiliser quality control laboratory in Bathinda, India, with capacity to test 1,000 samples annually, reflecting heightened regulatory and market attention to standardized quality verification. Alongside these investments, global efforts to harmonize methods and data expectations, including OECD workstreams on pesticides and sustainable pest management, create room for labs that can translate standardized protocols into consistent multi-country submissions, particularly when sponsors need combined packages spanning efficacy, ecology, and environmental fate.
Recent Industry Developments
- May 2026: BASF commissioned a new fermentation BioHub at Ludwigshafen to support production of biological fungicides and bio-based crop protection products. Additional fermentation capacity increases the volume and batch cadence of biological actives that must be characterized for identity, purity, and stability, expanding demand for analytical and QC testing across the product life cycle.
- April 2025: Smithers announced that a new Biosafety Level 2 (BSL-2) compliant microbiology laboratory is operational for biopesticide testing, including analytical dose-verification and 5-batch analysis. The added containment and method capability supports registration-grade microbial work and helps sponsors compress timelines by consolidating critical studies within a single compliant setting.
- December 2024: Fera Science Ltd. opened an advanced containment unit for microbial pesticide trials, including climate-stress chambers designed to simulate extreme weather conditions. This facility expansion strengthens capacity for biosafety and performance assessments under variable environmental scenarios, supporting more robust datasets for regulatory dossiers and commercialization decisions.


Research Methodology Framework and Report Scope
Market Definition and Coverage
The agricultural biologicals testing market is defined as the revenues earned from lab and field-oriented testing services that help validate, register, and monitor agricultural biological products used in crop production, including quality, safety, and performance checks.
Scope exclusions: This sizing excludes the commercial sale of agricultural biologicals products themselves and excludes routine soil and water testing done outside biological product development or regulatory workflows.
Segmentation Overview
- By Product Type
- Biopesticides
- Biofertilizers
- Biostimulants
- Other Product Types
- By Application
- Field Support
- Regulatory
- Analytical
- Other Applications
- By Crop Type
- Cereals and Grains
- Fruits and Vegetables
- Oilseeds and Pulses
- Others
- By Geography
- North America
- United States
- Canada
- Mexico
- Rest of North America
- Europe
- United Kingdom
- Germany
- France
- Italy
- Spain
- Russia
- Rest of Europe
- Asia-Pacific
- China
- India
- Japan
- Australia
- Rest of Asia-Pacific
- South America
- Brazil
- Argentina
- Rest of South America
- Middle East
- Turkey
- Saudi Arabia
- Rest of Middle East
- Africa
- South Africa
- Kenya
- Rest of Africa
- North America
Data Sources, Market Sizing, and Validation
Desk Research
Desk work starts with clarifying what counts as a testing service and what sits outside it, and then mapping where the spend is generated across regions. We reference public regulatory and standards material and then align it with agriculture adoption signals so the demand logic stays realistic.
Common inputs include sources such as the FAO and World Bank for crop and land-use context, USDA and Eurostat for agriculture and trade statistics, and EPA and European Commission pesticide and biopesticide guidance for regulatory pathways. We also use peer-reviewed journals to understand common test endpoints, along with company filings, investor presentations, and credible industry press for service offerings and lab footprint changes. Where available, paid subscriptions for company financials and news, patent databases, and an import-export shipment-level database are used to fill gaps in corporate activity and cross-border sample flows. These examples are not exhaustive, and many other public documents and datasets were also referenced for collection and cross-checking.
Primary Interviews and Surveys
Primary work is used to pressure-test the desk assumptions on how testing is priced, what tests are bundled, and where demand is actually concentrated across regulatory and commercial stages. We spoke with a mix of independent labs, contract research teams, and biological product developers across APAC, EMEA, and the Americas so regional registration practices and cropping patterns are reflected in the final model.
Distribution of primary research fieldwork respondents
| Company type | Respondent position | Region |
|---|---|---|
| Top tier: 34% | CXOs: 18% | APAC: 41% |
| Mid tier: 48% | Functional/Unit leaders: 32% | EMEA: 36% |
| Smaller Players: 18% | Managers: 50% | Americas: 23% |
Market-Sizing & Forecasting
The core model is built with a top-down approach where the demand pool is reconstructed from biological product development and registration activity, and then translated into testing service spend using realistic test-package and pricing assumptions. To keep the totals grounded, we corroborate results with selective bottom-up approximations such as sampled lab price lists, channel checks on typical study bundles, and a roll-up of a small set of observable supplier revenues, which are then used to adjust outliers.
Key inputs that typically move the numbers include the number of biological active substances and formulations entering registration pipelines, the share of acres shifting toward biological and integrated pest management programs, average study count per product (efficacy, safety, residue, and stability), typical lead times for GLP-style studies, and average selling price progression by test type and region. When data is thin in smaller countries, gaps are handled by using crop mix and regulatory similarity mapping, and then validating the implied spend per product developer with interview feedback.
For forecasting, scenario analysis is used with a base case that is tied to expected biological adoption, regulatory processing timelines, and capacity additions in testing labs, and then checked against expert views on pricing and study complexity. The model is refreshed with updated input ranges each cycle so the growth path does not rely on one fixed assumption.
Data Validation & Update Cycle
Validation is done in layers so the final number is not dependent on a single data stream. We compare the implied testing spend against independent signals like biological product launch cadence, regulatory submission volume direction, and observed lab capacity utilization commentary, and then investigate variances when the implied spend per study or per product looks unusual.
Before sign-off, the model is reviewed step by step, with checks on currency conversions, year alignment, and regional splits so arithmetic and logic errors are caught early. Primary contacts are re-approached when a material mismatch appears between desk indicators and field feedback. Reports are refreshed annually, and interim updates are made when major regulatory changes, capacity expansions, or sharp pricing shifts are identified, followed by a final pre-delivery pass to reflect the latest public information.
Mordor Intelligence's Agricultural Biologicals Testing Market Estimate Compared With Other Published Estimates
Published market sizes for agricultural biologicals testing can look far apart because the scope can slide between service-only testing and broader bundles that include adjacent agriculture testing and related product revenues. Different base years, currency timing, and how firms treat regulatory versus field-support work also create differences that are not obvious from headline numbers.
The main gap comes from whether the estimate counts only third-party testing service revenues or also adds biological product-related goods sold within a testing offering, and in this study Mordor Intelligence keeps the total tied to testing service demand signals and region-specific study packages rather than broader bundled revenues.
Benchmark comparison
| Source | Market Size | Gaps in Research Methodology |
|---|---|---|
| Mordor Intelligence | USD 3.37 B (2026) | |
| Global Consultancy A | USD 2.67 B (2024) | Uses an earlier base year and can include related goods sold within the testing offering, which can shift the value mix and make service-only comparisons less direct. |
| Industry Publisher B | USD 2.70 B (2022) | Anchors the model to an older starting point and often blends multiple end-user and application buckets, which can smooth pricing and understate fast-growing regulatory and efficacy study demand. |
The comparison shows that year choice and what is counted as part of testing revenues explain much of the spread. By keeping the build-up traceable to product pipeline activity, test-package intensity, and region-level pricing logic, the estimate stays easier to reproduce and check with real-world lab and regulatory signals.


Key Questions Answered in the Report
What is the forecast revenue for agricultural biologicals testing in 2031?
The market is projected to reach USD 7.09 billion by 2031.
Which product segment drives the largest share of biologicals testing today?
Biopesticides lead with 43.62% of 2025 revenue.
Which application area is expanding most rapidly?
Analytical services are set to grow at an 17.44% CAGR through 2031.
Why is Asia-Pacific the fastest-growing region?
Stricter Chinese and Japanese protocols and India's organic surge lift regional testing demand at a 16.12% CAGR.
How are digital crop passports influencing laboratory demand?
They mandate blockchain-ready data and real-time access, increasing analytical workload and favoring automated labs.
Page last updated on:


 Your data is secure and never sold or shared.


