
Aggregates Market Size and Share
Market Overview
| Study Period | 2021 - 2031 |
|---|---|
| Market Volume (2026) | 62.14 Billion tons |
| Market Volume (2031) | 84.23 Billion tons |
| Growth Rate (2026 - 2031) | 6.27 % |
| Fastest Growing Market | Asia Pacific |
| Largest Market | Asia Pacific |
| Market Concentration | Medium |
Major Players *Disclaimer: Major Players sorted in no particular order Image © Mordor Intelligence. Reuse requires attribution under CC BY 4.0. | |
Aggregates Market Analysis by Mordor Intelligence
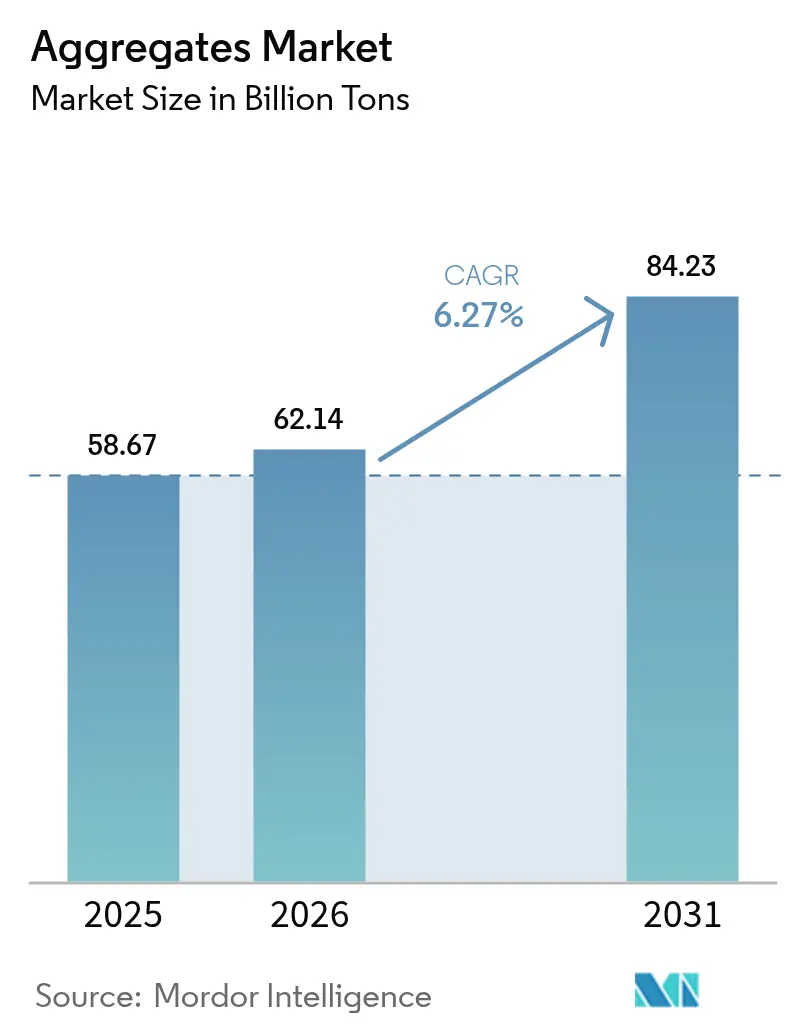
The Aggregates Market size is projected to expand from 58.67 billion tons in 2025 and 62.14 billion tons in 2026 to 84.23 billion tons by 2031, registering a CAGR of 6.27% between 2026 to 2031. Public investment programs, low-carbon procurement rules, and rapid urban migration combine to lift long-term demand for quarried and recycled stone. National infrastructure plans in the United States, India, and Saudi Arabia translate policy budgets into steady tender pipelines that favor producers with assured reserves and multi-modal logistics. Growing reliance on ready-mix concrete raises quality thresholds for particle size and moisture content, which intensifies the need for washed and screened feedstock. Emissions reporting moves from voluntary to mandatory status in key buying regions, so aggregate suppliers that publish Environmental Product Declarations gain a pricing premium.
Key Report Takeaways
- By aggregate type, sand led with 40.69% revenue share in 2025, while other aggregate types are projected to expand at a 7.90% CAGR through 2031.
- By application, construction accounted for 47.59% of the Aggregates market share in 2025 and other applications are forecast to grow at 7.82% CAGR to 2031.
- By geography, Asia-Pacific captured 52.60% of the aggregates industry in 2025 and is advancing at a 7.46% CAGR to 2031.
Note: Market size and forecast figures in this report are generated using Mordor Intelligence’s proprietary estimation framework, updated with the latest available data and insights as of 2026.
Market Trends and Insights
Drivers Impact Analysis of Aggregates Market*
| Drivers | (~) % Impact on CAGR Forecast | Geographic Relevance | Impact Timeline |
|---|---|---|---|
| Continued infrastructure megaproject pipeline | +1.8% | Global, with concentration in Asia-Pacific, Middle East, and North America | Long term (≥ 4 years) |
| Accelerating shift to ready-mix and high-spec concrete mixes | +1.2% | Global, led by urban centers in Asia-Pacific and Europe | Medium term (2-4 years) |
| Government incentives for low-carbon building materials | +0.9% | North America and EU, early adoption in select Asia-Pacific markets | Medium term (2-4 years) |
| Urbanization-led demand growth in cities | +1.5% | Asia-Pacific core, spillover to Middle East and Africa | Long term (≥ 4 years) |
| Heavyweight radiation-shielding aggregates for SMR programs | +0.3% | North America, Europe, and select Asia-Pacific countries with nuclear expansion | Long term (≥ 4 years) |
| Source: Mordor Intelligence | |||
Continued Infrastructure Megaproject Pipeline
Quarry investments now benefit from a decade-long visibility, thanks to extended infrastructure budgets, strengthening the aggregates market. Under the Infrastructure Investment and Jobs Act, the U.S. allocated a hefty sum for roads, bridges, and utilities, leading to a surge in aggregate contracts by 2025. Meanwhile, India's National Infrastructure Pipeline is channeling significant investments into highways and freight corridors, emphasizing the need for robust crushed-stone bases. In the Gulf, Saudi Arabia's ambitious NEOM project, alongside other megaprojects, is projected to consume substantial amounts of stone by 2030, putting a strain on regional reserves. These substantial investments not only justify the capital expenditure on high-capacity crushers and automated conveyors, boosting hourly output, but also encourage producers to secure long-term supply contracts with contractors, effectively managing price and volume risks.
Accelerating Shift to Ready-Mix and High-Spec Concrete Mixes
By 2025, ready mix concrete is projected to account for a significant portion of concrete placements in major cities. Batching plants, adhering to a ±3% sieve tolerance for aggregates and capping moisture at 5%, show a clear preference for washed and graded materials. The Federal Highway Administration's updated guidelines advocate for calcined-clay blends, reducing cement content and simultaneously increasing aggregate volume per cubic meter. While European standard EN 206 mandates reactive-silica testing—incurring compliance costs but enhancing durability—producers investing in on-site laboratories and automated grading equipment gain an edge, achieving preferred-bidder status on public tenders that penalize variations.
Government Incentives for Low-Carbon Building Materials
In 2025, embodied-carbon reporting transitioned from a mere aspiration to a legal mandate. The Inflation Reduction Act allocates substantial funding towards low-carbon concrete initiatives, emphasizing the need for verified environmental declarations[1]. Meanwhile, Canada has set an ambitious target: a significant reduction in embodied carbon for federal projects by 2030, a move that bolsters the adoption of recycled aggregates. The General Services Administration is now prioritizing suppliers who can document emissions from extraction energy and logistics. This shift creates a lucrative opportunity for quarries harnessing renewable electricity. Producers who electrify their haul trucks or integrate solar arrays into their crusher lines are reaping the benefits, enjoying price premiums and recouping their capital investments within a decade.
Urbanization-Led Demand Growth
Between 2025 and 2050, the United Nations forecasts an influx of city residents, predominantly in Asia and Africa, accounting for most of this growth. Each new urban dweller contributes to stone consumption, primarily for housing and transport infrastructure. In 2025, India's Smart Cities Mission spurred a surge in demand across tier-2 municipalities. Southeast Asian metropolitan areas invested in transit and sanitation projects, heavily reliant on sand, gravel, and crushed rock. Notably, high-rise constructions consume more concrete per square meter than their low-rise counterparts, intensifying the per-capita demand for aggregates.
Restraints Impact Analysis of Aggregates Market*
| Restraints | (~) % Impact on CAGR Forecast | Geographic Relevance | Impact Timeline |
|---|---|---|---|
| High last-mile haulage and fuel cost volatility | -1.1% | Global, acute in regions with dispersed quarries and limited rail infrastructure | Short term (≤ 2 years) |
| Lengthy and restrictive environmental permitting for new quarries | -0.8% | North America and EU, emerging in select Asia-Pacific markets | Medium term (2-4 years) |
| Crack-downs on river-sand mining causing regional shortages | -0.6% | Asia-Pacific (India, China, Southeast Asia), localized in coastal and riparian zones | Short term (≤ 2 years) |
| Source: Mordor Intelligence | |||
High Last-Mile Haulage and Fuel Cost Volatility
Transporting aggregates, heavy and low in value, becomes uneconomic beyond a 50-kilometer truck journey. Diesel accounted for a significant portion of the delivered cost, and fluctuations in crude oil prices squeezed margins for haulers lacking hedge programs in the aggregates market. While rail transport becomes cost-effective after 150 kilometers, only a small percentage of U.S. stone was transported by train, primarily because numerous quarries were without rail sidings. Due to higher diesel duties in Europe, operators began experimenting with electric and hydrogen haul trucks. In 2025, pilot fleets were successfully delivered to quarries in Sweden and Germany. Integrated firms that own their fleets and can optimize backhauls stand to benefit from the volatility in logistics.
Lengthy and Restrictive Environmental Permitting for New Quarries
In North America and Europe, obtaining permits now demands an environmental review, public hearings, and appeals, stretching over four to six years[2]. In 2024, procedures under the National Environmental Policy Act in the U.S. tacked on an additional 18 months to the expansion of a limestone pit. In Germany, new gravel pits must provide biodiversity offsets that are double the disturbed area, leading to an increase in upfront capital costs. Such regulatory challenges not only hinder new market entrants but also bolster the position of established players with existing permits. This dynamic curtails regional price competition and dampens supply responsiveness.
*Our forecasts treat driver/restraint impacts as directional, not additive. The impact forecasts reflect baseline growth, mix effects, and variable interactions.
Aggregates Market Segment Analysis
By Aggregate Type:
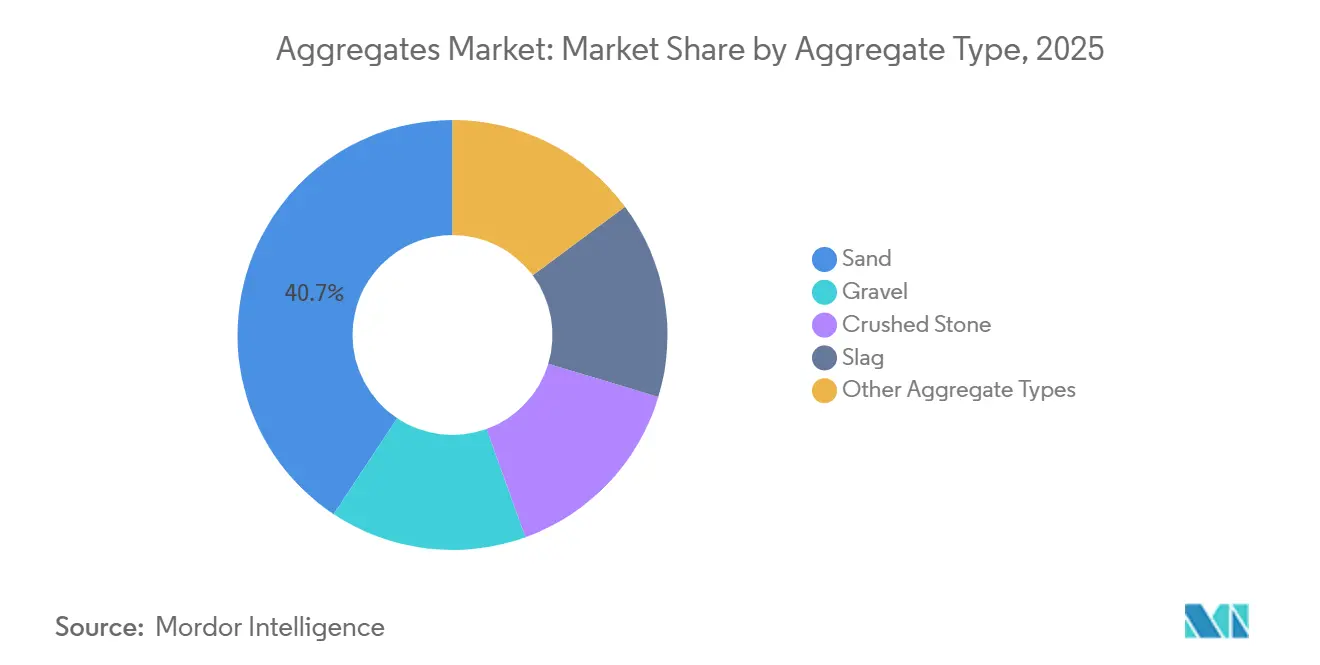
Recycled Material Gains as Sand Dominance ErodesSand held a 40.69% share of the aggregates industry in 2025, reflecting its central role in mortar and concrete finishing. Other aggregate types are projected to post a 7.90% CAGR, the highest across categories, as policy measures limit natural-sand extraction. Manufactured sand's share of India's fine-aggregate needs surged significantly in 2025, largely due to tightened supplies from river-sand bans. Crushed stone continues to be the primary choice for road bases and rail ballast. Gravel finds its niche in drainage layers, where its rounded particles enhance infiltration. Slag aggregates, known for their latent hydraulic properties that boost durability, remain influenced by trends in steel output.
By 2025, the European Union Waste Framework Directive aims to boost recycled concrete usage in Germany and the Netherlands, setting a recovery target for construction and demolition waste. Adhering to ISO 10426 quality norms, which mandate reactivity and chloride testing, is fostering standardized laboratory protocols. Producers investing in mobile crushers close to demolition sites are not only slashing haul distances but also trimming emissions – a metric increasingly monitored by public buyers. As municipal procurement departments prioritize contracts with higher recyclate content, the market for alternative materials in aggregates is poised for steady growth.

By Application:
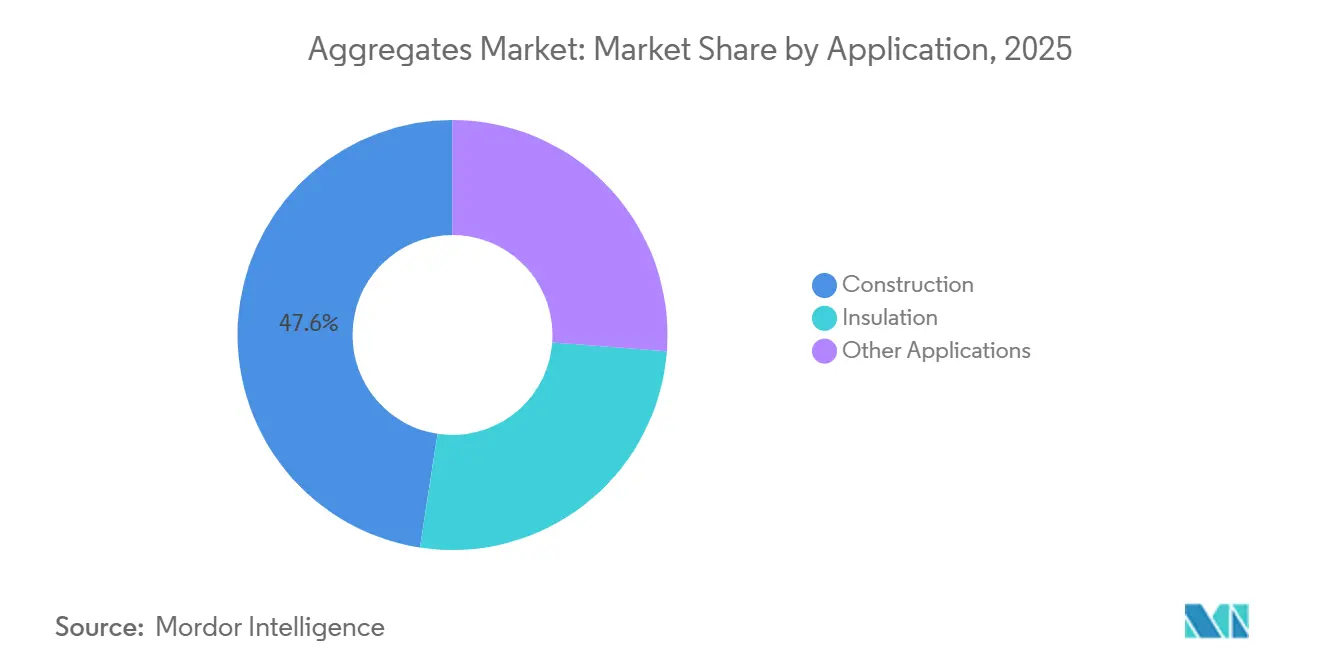
Construction Dominates while Specialty Uses AccelerateIn 2025, construction accounted for 47.59% of the global volume, with roadway projects alone utilizing substantial amounts of base layer per kilometer. Railway upgrades relied on high-strength granite ballast, ensuring abrasion values stayed below a certain threshold. To meet the stricter R-value codes introduced in 2025, building insulation turned to lightweight expanded clay and pumice. Meanwhile, other applications, including offshore wind and nuclear power, are anticipated to expand at a 7.82% CAGR through 2031, especially with the growing prominence of acoustic panels.
Offshore wind is poised to boost the aggregates market, as each turbine foundation requires substantial amounts of scour-protection rock. Additionally, small modular reactors are opting for barite or magnetite stone for radiation shielding, with prices significantly outpacing standard construction materials. While these specialty niches may be modest in tonnage, they offer margin advantages that can counterbalance the tighter margins seen in the more commoditized construction supply. Producers who can certify density and mineralogy find themselves well-positioned in these lucrative segments.
Geography Analysis
APAC Aggregates Market
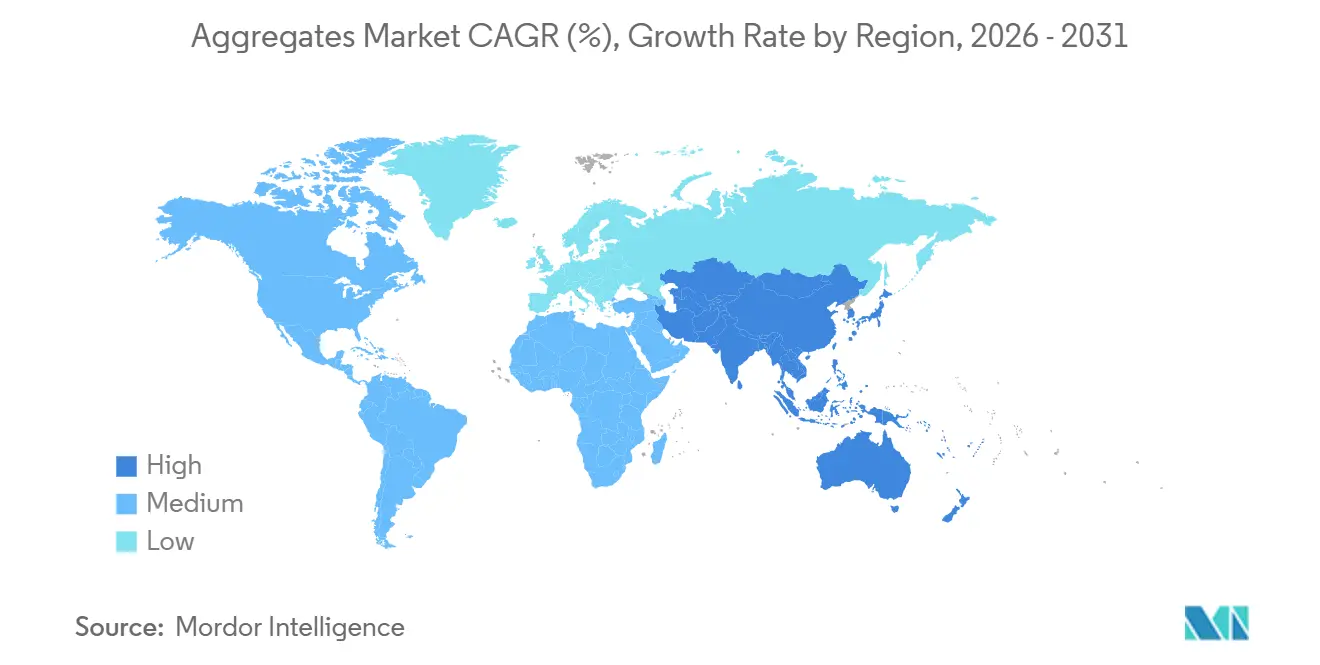
Asia-Pacific commanded 52.60% of the global market volume in 2025 and is forecast to advance at a 7.46% CAGR through 2031. Under the current Five-Year Plan, China's domestic demand has stabilized, bolstered by investments in urban rail and renewable energy grids. India's Bharatmala highway initiative is set to consume a substantial amount of crushed stone by 2027. Indonesia, Vietnam, and the Philippines have collectively committed significant funding towards transit and sanitation projects. Notably, Jakarta's MRT extension has placed an order for a considerable amount of ballast. Despite facing sporadic environmental restrictions on river-sand extraction, these initiatives firmly anchor the aggregates industry in the region.
North America Aggregates Market
In 2025, North America saw a notable uptick in volume, spurred by the Infrastructure Investment and Jobs Act's enactment. The U.S. alone consumed a significant amount, with demand concentrated in Texas, California, and Florida—states that are pivotal growth corridors for both population and freight. In Canada, climate-adaptation initiatives heightened demand in British Columbia and Alberta. Simultaneously, Mexico's trend towards near-shoring has catalyzed a surge in industrial-park construction in Nuevo León and Guanajuato. Given the undersupply of rail infrastructure, the market heavily relies on truck fleets, making it sensitive to fluctuations in fuel prices.
EMEA and South America Aggregates Market
Europe's aggregates industry held steady in 2025. While Germany topped the volume charts, it channeled a larger share of its investments into rail electrification—a move that demands less stone compared to highway resurfacing. Between 2024 and 2026, the UK's HS2 project utilized a significant amount of crushed rock, bolstering regional quarries. Meanwhile, Nordic nations allocated resources to Arctic infrastructure, necessitating frost-resistant aggregates with an absorption rate below two percent. Though South America and Sub-Saharan Africa command smaller volumes, they present lucrative growth opportunities. By 2030, Saudi Arabia's NEOM mega-city and the UAE's Expo 2030 preparations are projected to create an annual demand surge, straining local supply chains.
Value Chain Analysis
The aggregates value chain begins with resource identification and permitting, then moves into extraction (drill-and-blast for hard rock, dredging and processing for sand and gravel, and recovery from construction and demolition waste for recycled aggregates). Processing steps such as crushing, screening, and washing turn run-of-quarry material into graded products, with on-site QA/QC (gradation, moisture, and reactivity testing) becoming more central as ready-mix and high-spec concrete demand tighter tolerances (for example, moisture caps around 5% and narrow sieve tolerances cited by batching plants). After processing, the flow passes through stockpiling and order management, then into fulfillment. Delivery is typically handled by short-haul trucking, with rail and barge used when infrastructure is available to extend economic reach.
Downstream demand is concentrated in ready-mix concrete producers, asphalt producers, and civil contractors executing public works programs. Procurement is increasingly shaped by documentation such as Environmental Product Declarations and emissions reporting. Logistics is the main cost and reliability bottleneck, since aggregates are heavy and low value, making delivery uneconomic beyond about 50 km by truck in many markets and creating sensitivity to fuel-price volatility. Firms with multi-modal access and digital dispatch can reduce idle time and improve backhauls. On the supply side, long permitting timelines (often 4 to 6 years in North America and Europe) and added review steps can constrain new capacity, while recycled aggregates can benefit from proximity to demolition sites using mobile crushers that cut haul distances and align with municipal circularity requirements.
Competitive Landscape
The aggregates market is moderately fragmented. Technology adoption separates leaders from laggards. Drone surveys reduce inventory error, predictive algorithms lift crusher uptime, and GPS dispatch cuts idle fuel burn. Mid-size operators that delay digitization face shrinking bid lists as contractors favor suppliers with real-time inventory portals. Meanwhile, white-space growth is visible in recycled aggregates and carbon-negative materials. Waste-management firms and cleantech startups challenge incumbents in urban recycling hubs, but quarry operators that deploy mobile crushing units close to demolition sites protect share. Incumbents monitor this risk by investing in specialty aggregates that retain relevance in advanced composites. Capital allocation now tilts toward reserves in regions with shorter permit windows, low carbon-intensity power grids, and proximity to megaprojects, underscoring a strategic pivot from raw volume to resilience.
Aggregates Industry Leaders
-
HOLCIM
-
CRH
-
Heidelberg Materials AG
-
Cemex S.A.B DE C.V.
-
Vulcan Materials Company
- *Disclaimer: Major Players sorted in no particular order

Aggregates Market Companies Covered in this Report
- Breedon Group plc
- Buzzi S.p.A.
- Cemex S.A.B DE C.V.
- China Resources Building Materials Technology Holdings
- CRH
- Eurocem Limited
- Heidelberg Materials AG
- HOLCIM
- Luck Stone
- Martin Marietta Materials
- Quikrete Holdings, Inc.
- Rogers Group Inc.
- Vulcan Materials Company
Market Opportunities and Future Outlook
Opportunities are concentrated where buyers and regulators tighten traceability and environmental reporting, and where supply constraints push substitution away from natural sand. In the European Union, the revised Construction Products Regulation (EU) 2024/3110 became fully applicable in January 2026, requiring Declarations of Performance to include specified environmental data such as Global Warming Potential and bio-based content. This raises the value of aggregates suppliers that can provide verified environmental datasets for tendering. In parallel, the Commission deadline in July 2026 to set up the Digital Product Passport registry adds a concrete milestone, benefiting producers and distributors that can link product identifiers to EPD and performance information across shipments.
White-space also opens around circular aggregates and specialty or high-performance applications. River-sand crackdowns in parts of Asia-Pacific are already pushing manufactured sand and recycled alternatives into mainstream concrete supply, while permitting friction for new quarries in North America and Europe increases the strategic importance of urban recycling hubs and mobile crushing near demolition sites. Beyond conventional construction, offshore wind foundations and SMR-related radiation shielding (barite or magnetite) create a higher-margin pathway for operators that can certify density, mineralogy, and consistent grading. Supply-side competition is further shaped by major building materials groups expanding integrated offerings that connect aggregates to downstream solutions, including Holcim transactions across Latin America and CRH pursuing scale in North American infrastructure-facing building materials, reinforcing the shift from standalone volume sales toward bundled supply and service models.
Recent Industry Developments in Aggregates Market
- June 2026: CRH signed an agreement to acquire 100% of Arcosa, Inc. for USD 8.5 billion, adding a US-focused platform in building materials and critical infrastructure products. The deal strengthens downstream pull-through opportunities for aggregates into infrastructure supply chains and increases CRH's exposure to public-works led demand. Completion is subject to approvals and is slated for Q1 2027.
- November 2024: Summit Materials, Inc. entered into a definitive agreement to be acquired by Quikrete Holdings, Inc. for USD 11.5 billion including debt. The combination links aggregates with cement and ready-mix concrete operations under one owner, supporting more secure internal supply and coordinated pricing across the concrete value chain.
- July 2024: Heidelberg Materials AG announced a definitive purchase agreement to acquire Highway Materials, Inc., a leading independent aggregates and asphalt producer in the Greater Philadelphia market. The asset package includes four crushed stone quarries, nine hot-mix asphalt plants, two clean fill operations, a concrete recycling facility, and a construction services business, expanding Heidelberg Materials' vertically integrated footprint in a major US metro corridor.
Aggregates Market Report Scope and Research Methodology
Market Definition and Coverage
This market covers bulk aggregates supplied for construction and related uses, including sand, gravel, crushed stone, slag, and similar materials processed and sold for use in concrete, asphalt, and site works.
Scope exclusions: It excludes cement, asphalt binder, ready-mix concrete, and downstream construction services, even if aggregates are used inside those activities.
Segments Covered in This Report
- By Aggregate Type
- Sand
- Gravel
- Crushed Stone
- Slag
- Other Aggregate Types (Recycled, Manufactured, etc.)
- By Application
- Construction
- Buildings
- Railways
- Roadways
- Others
- Insulation
- Other Applications
- Construction
- By Geography
- Asia-Pacific
- China
- Japan
- India
- South Korea
- ASEAN Countries
- Rest of Asia-Pacific
- North America
- United States
- Canada
- Mexico
- Europe
- Germany
- United Kingdom
- France
- Italy
- Spain
- Russia
- NORDIC Countries
- Rest of Europe
- South America
- Brazil
- Argentina
- Rest of South America
- Middle-East and Africa
- Saudi Arabia
- South Africa
- Rest of Middle-East and Africa
- Asia-Pacific
Data Sources, Market Sizing, and Validation
Desk Research
Desk work starts by building the demand context for aggregates and then anchoring it to public construction and infrastructure indicators. Sources used include items such as national statistics offices for construction output, ministries of transport and public works for road and rail programs, and geological surveys for quarrying and mineral production series.
We also refer to customs and trade statistics portals for cross-border movements of stone and sand categories where relevant, plus building and materials associations that publish consumption patterns and standards. Company annual reports, investor presentations, and reputable press are used to understand capacity additions, plant utilization commentary, and pricing direction at a high level. In a few places, paid subscriptions for company financials and intelligence and an import/export shipment-level database are used to cross-check reported volumes and trade signals. These desk sources are illustrative rather than exhaustive, since other public references were also used for data collection, validation, and clarification.
Primary Interviews and Surveys
Primary inputs come from interviews and surveys with quarry operators, aggregate processors, distributors, contractors, and project-side buyers who track consumption and delivery patterns. Since this is a global market, the fieldwork covers APAC, EMEA, and the Americas to validate volume assumptions, regional mix shifts, and practical constraints such as permits, haul distances, and seasonal demand swings.
Distribution of primary research fieldwork respondents
| Company type | Respondent position | Region |
|---|---|---|
| Top tier: 35% | CXOs: 12% | APAC: 38% |
| Mid tier: 45% | Functional/Unit leaders: 32% | EMEA: 35% |
| Smaller Players: 20% | Managers: 56% | Americas: 27% |
Market-Sizing & Forecasting
Sizing is built mainly through a top-down approach where construction activity and infrastructure build-outs are translated into aggregate demand, and then converted into tons using typical material intensity and mix assumptions. After the demand pool is shaped this way, the final market total is filtered through regional construction cycles and the split of sand, gravel, crushed stone, and other materials.
To keep the model grounded, outputs are corroborated with selective bottom-up approximations, such as sample quarry capacity roll-ups in key countries, channel checks on dispatch volumes, and sanity checks using typical price-per-ton ranges to see if implied value levels look reasonable. Inputs that matter in this market include residential and non-residential starts, road kilometers added or rehabilitated, cement and ready-mix output as a proxy for concrete pull-through, quarry permit activity, and typical haul distance economics that limit supply radius. Forecasts are produced using scenario analysis linked to construction spending outlooks and infrastructure pipeline timing, then adjusted using what respondents expect for utilization, permitting delays, and substitution toward recycled or manufactured aggregates in select areas. Where bottom-up signals are missing for smaller countries, ratios from similar construction intensity markets are applied and reviewed during validation.
Data Validation & Update Cycle
Validation is done by checking the model against independent signals, such as construction output growth, infrastructure budget execution, and quarrying production trends, before results are finalized. Large variances trigger a second look at the assumptions, after which follow-up calls are made if the gap is tied to pricing, material mix, or a one-time policy change.
A multi-step analyst review is used so the logic, arithmetic, and units stay consistent across regions and years. The report is refreshed annually, and interim updates are made when material events occur (for example, major stimulus packages, new restrictions on sand mining, or sharp changes in fuel and freight costs). Before delivery, a final pass is completed so clients receive the most current view available at the time.
Mordor Intelligence's Aggregates Market Size Compared Against Other Published Estimates
Published market sizes for aggregates often vary because the underlying unit of measurement is not always the same, and the included product set can shift between natural, recycled, and manufactured materials. Timing also matters, since construction cycles and currency assumptions can change the reported totals even when the demand story is similar.
The table points to a wide spread mainly because this study is volume-first (tons) and keeps the scope centered on aggregates themselves, while some other sources publish revenue values that embed pricing assumptions and can swing by region depending on freight conditions. Differences can also come from whether slag and recycled content are fully counted, how road base and concrete applications are mapped, and whether the latest construction pipeline updates have been reflected.
Benchmark comparison
| Source | Market Size | Gaps in Research Methodology |
|---|---|---|
| Mordor Intelligence | USD 62.14 B (2026) | |
| Industry Publisher A | USD 569.40 B (2024) | Reported in USD value, which can fold in pricing, freight, and inflation effects, and it may also treat recycled and adjacent materials differently across regions. |
| Global Publisher B | USD 455.86 B (2024) | Value-based sizing with a 2024 base year, and the revenue build can vary depending on assumed average selling price progression and how coarse and fine fractions are priced and combined. |
The comparison shows that unit choice and scope assumptions are doing most of the work in explaining the gap, and in Mordor Intelligence's model the market is sized in tons for core aggregate categories, which avoids overstating totals when price spikes temporarily lift revenue numbers. With clear demand indicators tied back to construction activity and repeated cross-checks against supply capacity and trade signals, the estimate stays traceable and can be recreated with the same steps year after year.
Key Questions Answered in the Report
What tonnage does the global aggregates market reach by 2031?
Forecasts indicate 84.23 billion tons by 2031, reflecting a 6.27% CAGR from 62.14 billion tons in 2026.
Which region contributes the most to aggregate demand today?
Asia-Pacific leads with 52.60% of global volume in 2025 and remains the fastest-growing area.
How large is the sand segment within the aggregates industry?
Sand represented 40.69% of the aggregates market share in 2025, making it the dominant single category.
What trend supports rising recycled-aggregate adoption?
Tightened sand-mining regulations and circular-economy targets drive a projected 7.90% CAGR for recycled and manufactured alternatives.
How are fuel prices influencing aggregate suppliers?
Diesel swings increase delivered costs, so integrated producers hedge fuel and test electric haul trucks to protect margins.
Which application outside construction is growing quickest?
Offshore wind and nuclear shielding push other applications toward a 7.82% CAGR through 2031 due to their heavy stone requirements.