
Market Overview
| Study Period | 2021 - 2031 |
|---|---|
| Forecast Data Period | 2026 - 2031 |
| Base Year Market Size (2025) | USD 4.01 Billion |
| Market Size (2026) | USD 4.3 Billion |
| Market Size (2031) | USD 6.11 Billion |
| Growth Rate (2026 - 2031) | 7.28 % |
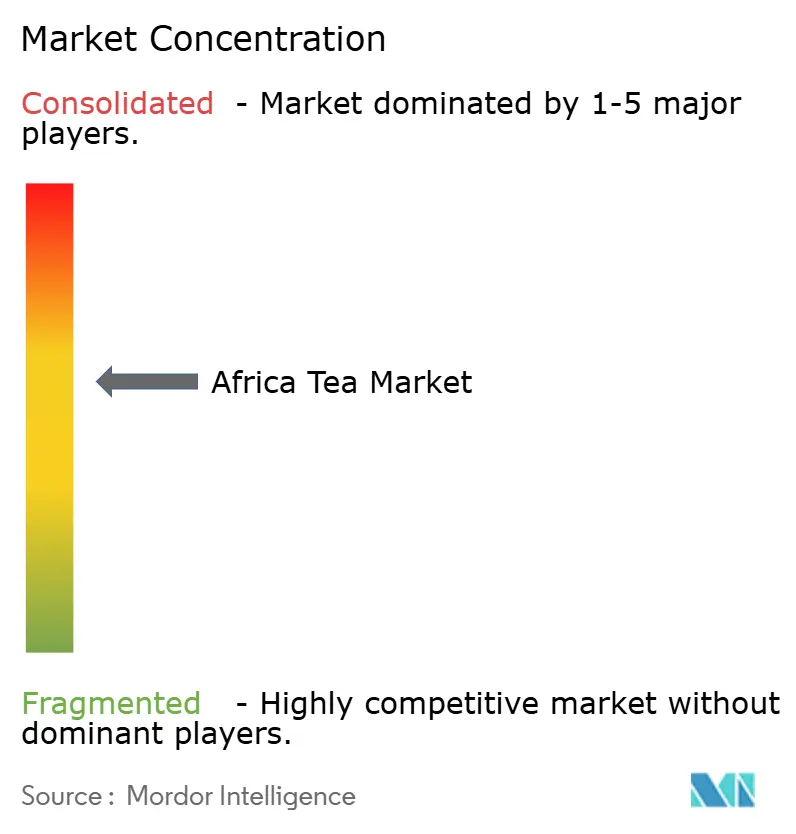
| Market Concentration | Medium |
Major Players *Disclaimer: Major Players sorted in no particular order Image © Mordor Intelligence. Reuse requires attribution under CC BY 4.0. | |
Africa Tea Market Analysis by Mordor Intelligence
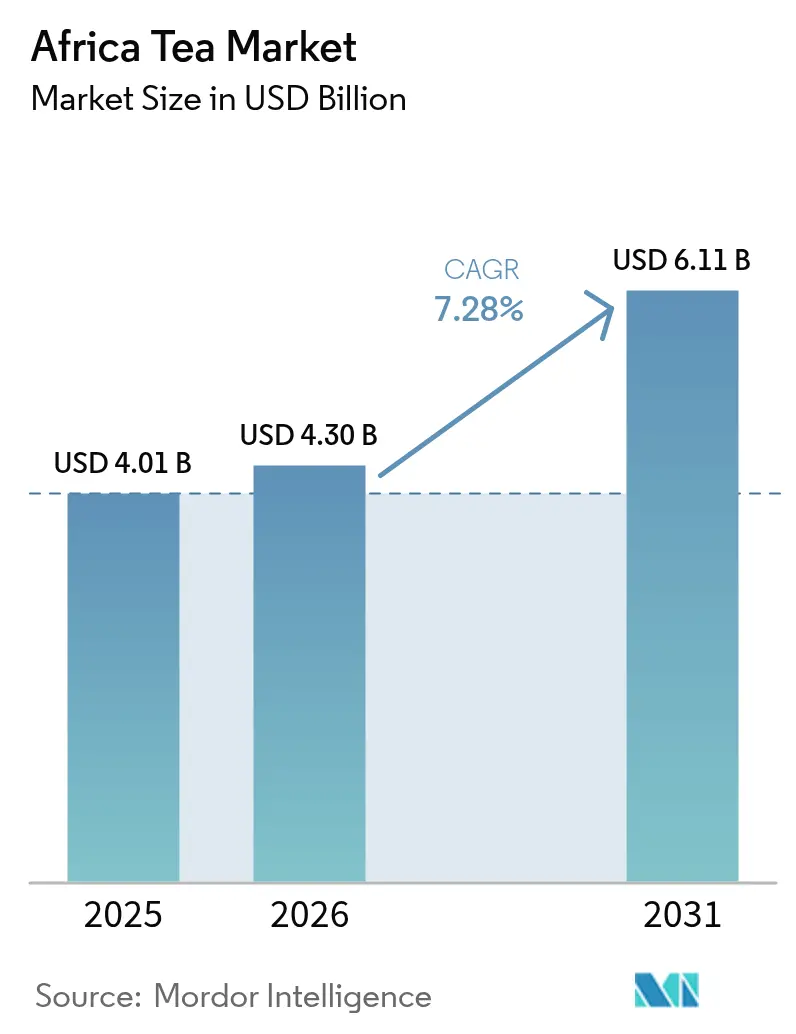
Africa Tea Market size in 2026 is estimated at USD 4.3 billion, growing from 2025 value of USD 4.01 billion with 2031 projections showing USD 6.11 billion, growing at 7.28% CAGR over 2026-2031. This growth trajectory reflects the continent's strategic positioning as both a major global tea producer and an expanding consumer base, with Kenya alone contributing USD 1.39 billion in tea exports globally, ranking as the world's second-largest tea exporter. The market's expansion is underpinned by increasing health consciousness, urbanization trends, and the growing demand for sustainable and ethically sourced products across African cities. South Africa’s rooibos leadership, Egypt’s accelerating consumption, and multi-country investments in renewable processing capacity continue to reinforce the Africa tea market as both a global supply hub and a vibrant local consumption arena. Structural changes—including certification realignments, climate adaptation programs, and the spread of specialty café chains—further support premiumization and segment diversification across the Africa tea market.
Key Report Takeaways
- By Form, CTC tea held 64.52% of the Africa tea market share in 2025, while leaf tea posted the fastest 7.52% CAGR through 2031.
- By Product type, black tea accounted for 55.76% of the Africa tea market size in 2025; herbal / fruit infusions are set to expand at an 8.21% CAGR to 2031.
- By Flavor, unflavoured products dominated with 79.88% revenue share in 2025, whereas flavoured variants are projected to advance at an 7.66% CAGR.
- By Category, conventional offerings captured 72.86% share of the Africa tea market size in 2025; organic lines are projected to grow at a 8.88% CAGR.
- By Packaging, pouches/bags led with 60.88% share in 2025; boxes are on track for an 7.83% CAGR through 2031.
- By Distribution Channel, off-trade outlets commanded 73.64% share of the Africa tea market in 2025, while on-trade channels are forecast to climb at a 7.55% CAGR.
- By Geography, South Africa contributed 32.08% of the regional value in 2025; Egypt shows the fastest 8.95% CAGR outlook to 2031.
Note: Market size and forecast figures in this report are generated using Mordor Intelligence’s proprietary estimation framework, updated with the latest available data and insights as of 2026.
Market Trends and Insights
Drivers Impact Analysis of Africa Tea Market*
| Driver | (~) % Impact on CAGR Forecast | Geographic Relevance | Impact Timeline |
|---|---|---|---|
| Heightened health awareness driving demand for green & herbal teas | +1.2% | South Africa & Egypt urban areas | Medium term (2-4 years) |
| Rising demand for sustainable and ethically sourced products | +0.9% | Kenya & South Africa | Long term (≥ 4 years) |
| Urban cities expansion of specialty tea café chains | +0.8% | Major metros in South Africa, Egypt, Kenya | Short term (≤ 2 years) |
| Gen-Z preference for decaffeinated and low-caffeine wellness teas | +0.7% | South Africa & Egypt | Medium term (2-4 years) |
| Surging demand for single-origin tea | +0.6% | Premium export channels | Long term (≥ 4 years) |
| Improved infrastructure and government support | +0.5% | Kenya, Rwanda, Tanzania production corridors | Short term (≤ 2 years) |
| Source: Mordor Intelligence | |||
Heightened Health Awareness Driving Demand for Green and Herbal Teas
Consumer health consciousness is fundamentally reshaping tea consumption patterns across Africa, with herbal and green tea segments experiencing disproportionate growth relative to traditional black tea categories. This trend manifests most prominently in urban centers where disposable income and health awareness intersect, creating premium market opportunities for functional tea products. South Africa's indigenous rooibos industry exemplifies this shift, with the EU granting Protected Designation of Origin status in 2021, enabling the country to export over 8,000 tonnes annually to 50+ countries while positioning rooibos as a premium wellness product. The health positioning extends beyond traditional antioxidant claims to include specific functional benefits, with research institutions documenting polyphenol concentration variations under different climate conditions. Egyptian consumers increasingly seek tea products with documented health benefits, driving import demand for specialty wellness teas despite the country's complex regulatory environment requiring National Food Safety Authority approval for functional food products according to U.S Commercial Service. This health-driven demand creates sustainable competitive advantages for producers who can document and market specific wellness attributes while navigating evolving regulatory frameworks.
Rising Demand for Sustainable and Ethically Sourced Products
Sustainability imperatives are reshaping supply chain structures and certification strategies across African tea markets, with traditional certification schemes facing cost-benefit recalibrations that favor locally developed frameworks. Kenya's suspension of Rainforest Alliance certification in May 2025 signals a strategic pivot toward nationally designed sustainability standards, similar to India's Trustea and Sri Lanka's Ceylon Tea schemes, reducing compliance costs while maintaining market access to key export destinations. This shift occurs as EU Deforestation Regulation compliance costs create barriers for smallholder producers, with geo-location requirements imposing approximately USD 4 per farm in administrative burden, potentially consolidating supply chains toward larger, technologically equipped producers. South Africa's rooibos industry demonstrates sustainable certification success through indigenous benefit-sharing agreements, with the Rooibos Council providing 15 million rand annually to Khoi and San communities following formal acknowledgment of traditional knowledge. The sustainability trend creates differentiation opportunities for African producers who can demonstrate environmental stewardship and social impact while managing compliance costs through regional coordination and technology adoption. Value addition initiatives, as promoted by Solidaridad Network, enable smallholder farmers to capture higher margins through local processing and branding while meeting sustainability requirements.
Urban Cities Expansion of Specialty Tea Café Chains
Urbanization across African cities is catalyzing specialty tea consumption through café culture expansion, creating new distribution channels that bypass traditional retail structures while commanding premium pricing. This trend particularly benefits regions with established tea tourism and heritage narratives, such as South Africa's Cederberg region where rooibos cultivation supports both commercial production and eco-tourism enterprises around Clanwilliam and Wupperthal. Urban café expansion creates demand for premium loose-leaf teas, single-origin products, and artisanal blends that command higher margins than commodity tea sales. The on-trade channel's 7.92% CAGR reflects this urbanization impact, with specialty cafés requiring consistent quality, unique flavor profiles, and compelling origin stories that African producers are uniquely positioned to provide. Egyptian urban markets present significant expansion opportunities given the country's large population and growing middle class, though operators must navigate complex import regulations and local partnership requirements. The café channel also serves as a testing ground for new product innovations and consumer education, enabling producers to build brand recognition before expanding into retail distribution networks.
Gen-Z Growing Preference for Decaffeinated and Low-Caffeine Wellness Teas
Generational shifts in beverage preferences are creating distinct market segments for wellness-oriented tea products, with younger consumers prioritizing functional benefits over traditional stimulant effects. This demographic trend aligns with broader global patterns documented in industry surveys, where functional and wellness teas represent growing market segments among younger consumer cohorts. African producers benefit from indigenous herbal tea varieties that naturally contain lower caffeine levels while offering documented wellness benefits, creating authentic positioning advantages over synthetic alternatives. Rooibos exemplifies this opportunity, being naturally caffeine-free while containing antioxidants and minerals that appeal to health-conscious consumers. The trend creates product development opportunities for blended teas that combine traditional African herbs with conventional tea varieties to achieve desired caffeine levels while maintaining flavor complexity. Educational marketing becomes critical for this segment, as younger consumers seek transparency about sourcing, processing methods, and specific health benefits. Digital marketing channels and social media engagement prove essential for reaching Gen-Z consumers, requiring producers to invest in brand storytelling and direct-to-consumer capabilities.
Restraints Impact Analysis of Africa Tea Market*
| Restraint | (~) % Impact on CAGR Forecast | Geographic Relevance | Impact Timeline |
|---|---|---|---|
| Strong Competition from Coffee and Other Beverages | -1.1% | Global, particularly strong in Egypt and urban South Africa | Short term (≤ 2 years) |
| Health Concerns Over Sugar Content in Flavored Teas | -0.8% | South Africa and Egypt, emerging in Kenya | Medium term (2-4 years) |
| Climate-Induced Yield Instability | -0.9% | Kenya, Rwanda, Tanzania production regions | Long term (≥ 4 years) |
| Regulatory Challenges and Import/Export Barriers | -0.7% | Egypt import regulations, European Union export requirements | Medium term (2-4 years) |
| Source: Mordor Intelligence | |||
Strong Competition from Coffee and Other Beverages
Coffee's established market position across African urban centers creates persistent competitive pressure on tea consumption, particularly in segments where beverages compete for morning consumption occasions and café menu space. Egypt's beverage market demonstrates this competitive dynamic, where coffee culture and traditional beverages compete with tea for consumer preference and retail shelf space. The competitive pressure intensifies in urban areas where international coffee chains establish presence and create consumption habits that favor coffee over tea. African tea producers must differentiate through unique value propositions such as health benefits, cultural authenticity, and premium positioning rather than competing directly on caffeine content or convenience. The competition extends to functional beverage categories where energy drinks and enhanced waters target similar health-conscious consumer segments that represent growth opportunities for wellness teas. Regulatory influence from National Food Safety Authority requirements in Egypt affects how functional tea products can be positioned relative to other beverage categories.
Health Concerns Over Sugar Content in Flavored Teas
Consumer awareness of sugar content in processed beverages creates headwinds for flavored tea segments, particularly ready-to-drink products that compete with soft drinks and other sweetened beverages. This concern manifests most significantly in urban markets where health consciousness intersects with convenience consumption patterns. The restraint affects product development strategies, requiring reformulation toward natural sweeteners or unsweetened variants that may compromise taste appeal for mainstream consumers. Regulatory scrutiny of sugar content in processed foods affects marketing claims and labeling requirements, particularly in markets like Egypt where National Food Safety Authority oversight extends to nutritional supplements and functional foods [1]. African producers can mitigate this restraint through emphasis on naturally sweet tea varieties like rooibos, which provides inherent sweetness without added sugars while maintaining health positioning. The trend toward reduced sugar consumption creates opportunities for premium positioning of naturally flavored teas that command higher margins while addressing health concerns.
*Our forecasts treat driver/restraint impacts as directional, not additive. The impact forecasts reflect baseline growth, mix effects, and variable interactions.
Africa Tea Market Segment Analysis
By Form:
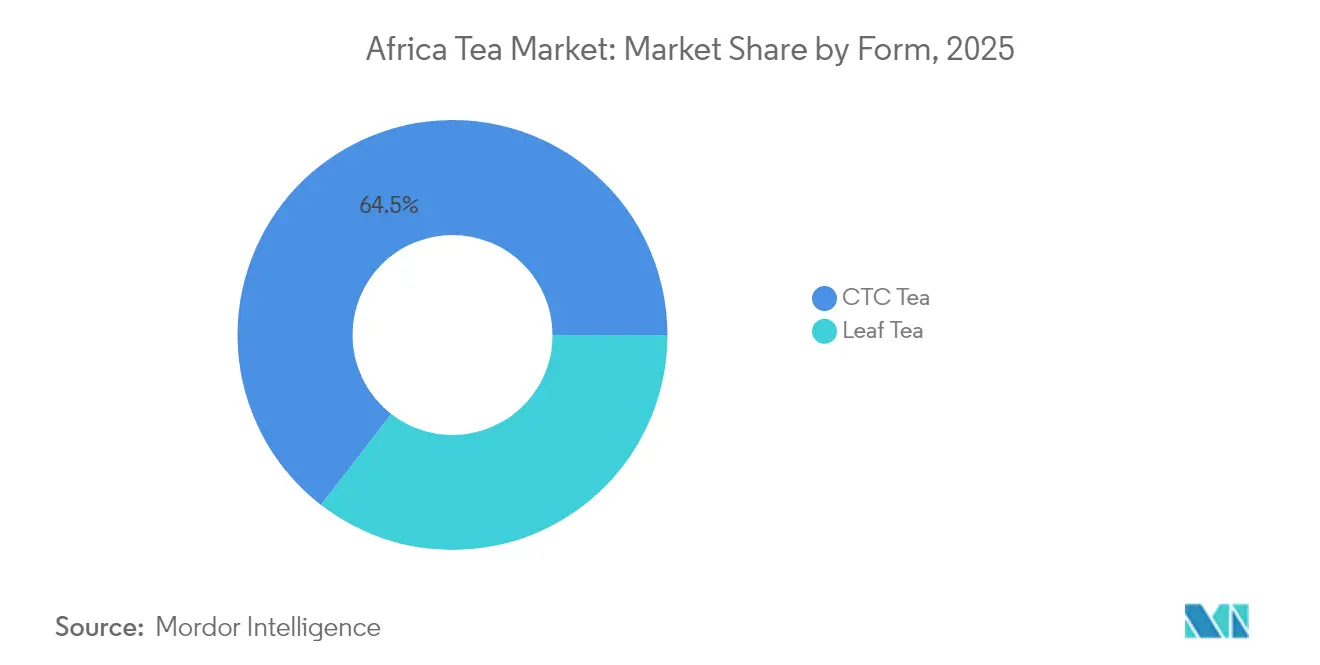
CTC Processing Dominance Faces Premium Leaf ChallengeCTC Tea commands 64.52% market share in 2025, reflecting established processing infrastructure and export market preferences, while Leaf Tea accelerates with 7.52% CAGR through 2031, driven by premiumization trends and specialty tea demand. The dominance of CTC processing aligns with Kenya's position as a major global supplier, where mechanized production enables cost-effective processing of high-volume exports to traditional markets including Pakistan and Egypt. However, the faster growth of Leaf Tea reflects changing consumer preferences toward premium products and single origin positioning that command higher margins. Value addition initiatives promoted by development organizations emphasize shifting from raw leaf sales to local processing and branding, enabling farmers to capture higher margins while building domestic processing capabilities.
Climate adaptation strategies increasingly influence processing choices, with leaf tea production requiring more precise timing and handling that becomes challenging under variable weather conditions documented across East African tea regions. KTDA's renewable energy initiative across 66 tea factories demonstrates infrastructure investments that support both processing forms while reducing operational costs and environmental impact. The processing form segmentation reflects broader industry tensions between volume-focused commodity production and value-added specialty positioning, with successful producers increasingly adopting dual strategies that serve both market segments through differentiated product lines and processing capabilities.

By Product Type:
Black Tea Stability Contrasts Herbal InnovationBlack Tea maintains 55.76% market share in 2025, reflecting established consumption patterns and export market demand, while Herbal/Fruit Infusions surge with 8.21% CAGR, signaling consumer preference shifts toward wellness-oriented products. The stability of black tea consumption provides revenue foundation for African producers, particularly in Kenya where black tea exports reached USD 1.34 billion in 2023, representing 18.8% of total national exports. However, the accelerated growth of herbal and fruit infusions reflects health consciousness trends and premiumization opportunities that enable higher margins and differentiated positioning. South Africa's indigenous rooibos industry exemplifies successful herbal tea commercialization, with Protected Designation of Origin status enabling premium pricing and export growth to over 50 countries.
Green tea and other specialty segments benefit from health positioning and antioxidant claims, though market penetration remains limited compared to established black tea consumption patterns. The product type segmentation creates opportunities for blended products that combine traditional black tea with herbal ingredients, appealing to consumers seeking familiar flavors with enhanced wellness benefits. Climate change research indicates that secondary metabolite concentrations in tea plants respond significantly to environmental conditions, potentially affecting quality characteristics across different product types as growing conditions evolve. Regulatory considerations become important for herbal products, particularly in markets like Egypt where functional food claims require National Food Safety Authority approval and documentation of health benefits.
By Flavour:
Natural Preferences Drive Flavoured GrowthUnflavoured tea dominates with 79.88% market share in 2025, reflecting traditional consumption preferences and export market requirements, while Flavoured tea accelerates at 7.66% CAGR, driven by innovation and consumer experimentation. The dominance of unflavoured products aligns with commodity export markets where consistency and traditional flavor profiles meet bulk purchasing requirements from major importing countries. However, flavoured tea growth represents premiumization opportunities and domestic market development that enable higher margins and brand differentiation. Natural flavoring approaches gain preference over artificial alternatives, aligning with health consciousness trends and clean label preferences among urban consumers.
The flavour segmentation intersects with health concerns regarding sugar content, creating opportunities for naturally flavoured teas that provide taste enhancement without added sweeteners. Rooibos demonstrates successful natural flavoring through its inherent honey-like characteristics, enabling premium positioning without artificial additives . Innovation opportunities exist in combining African indigenous herbs and spices with traditional tea varieties to create unique flavor profiles that reflect regional culinary traditions while appealing to international markets seeking authentic taste experiences. The growth of flavoured segments requires investment in product development capabilities and quality control systems to ensure consistent flavor delivery while maintaining shelf stability and regulatory compliance across different markets.
By Category:
Organic Premium Commands Growth LeadershipConventional tea maintains 72.86% market share in 2025, reflecting established production systems and cost considerations, while Organic tea leads growth with 8.88% CAGR through 2031, driven by premium positioning and sustainability trends. The conventional segment's dominance reflects infrastructure investments, established supply chains, and cost-sensitive export markets where organic premiums may not justify conversion costs. However, organic growth represents the highest CAGR across all segmentations, indicating strong consumer willingness to pay premiums for certified organic products that align with health and environmental values. Organic certification provides differentiation opportunities for African producers, particularly smallholder farmers who can leverage traditional farming practices and minimal chemical inputs as competitive advantages.
The organic segment benefits from sustainability trends and premium positioning, though certification costs and compliance requirements create barriers for smaller producers. Kenya's suspension of Rainforest Alliance certification demonstrates industry recalibration of certification cost-benefit equations, potentially creating opportunities for organic certification as an alternative differentiation strategy. Climate adaptation strategies increasingly align with organic principles, as documented in research on sustainable agricultural practices that enhance resilience while meeting certification requirements. The category segmentation reflects broader consumer trends toward transparency and environmental responsibility, creating long-term growth opportunities for producers who invest in organic certification and sustainable production systems while managing associated costs and compliance requirements.
By Packaging:
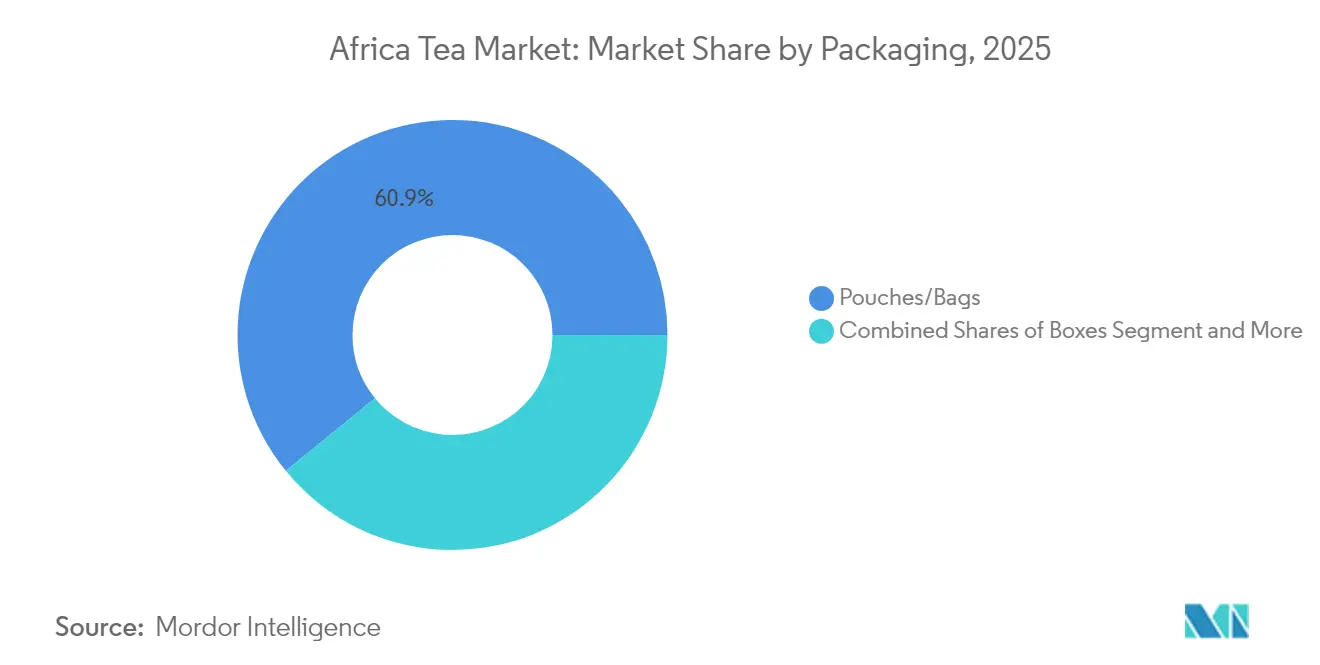
Sustainability Drives Box InnovationPouches/Bags dominate with 60.88% market share in 2025, reflecting cost efficiency and consumer familiarity, while Boxes accelerate with 7.83% CAGR, driven by premium positioning and sustainability considerations. The dominance of pouch packaging aligns with commodity market requirements and cost-sensitive distribution channels where packaging efficiency and shelf space optimization drive selection criteria. However, box packaging growth reflects premiumization trends and sustainability preferences among consumers willing to pay higher prices for perceived quality and environmental responsibility. Sustainable packaging innovations create differentiation opportunities, particularly for organic and premium tea segments where packaging choices reinforce brand positioning and environmental values.
The packaging segmentation intersects with distribution channel preferences, as specialty retail and on-trade channels increasingly favor premium packaging formats that enhance product presentation and brand recognition. Tin, jar, and sachet formats within the "Others" category provide niche opportunities for ultra-premium positioning and gift market segments that command highest margins. Innovation in packaging materials and formats creates opportunities for African producers to differentiate through sustainable materials, convenient formats, and cultural authenticity that appeals to both domestic and export markets. Regulatory considerations affect packaging choices, particularly for products making health claims or targeting specific market segments with labeling requirements that vary across different countries and distribution channels.
By Distribution Channel:
Off-Trade Stability Enables On-Trade ExpansionOff-Trade channels command 73.64% market share in 2025, reflecting established retail infrastructure and consumer purchasing patterns, while On-Trade experiences faster growth at 7.55% CAGR, driven by urbanization and café culture expansion. The dominance of off-trade distribution aligns with commodity market structures and consumer preference for home consumption, particularly in markets where tea represents daily staple consumption rather than premium beverage experiences. Within off-trade channels, supermarkets and hypermarkets provide volume distribution, while specialty stores and online retail create opportunities for premium positioning and direct consumer engagement. Online retail growth accelerates across African markets, enabling producers to reach consumers directly while building brand recognition and capturing higher margins.
On-trade growth reflects urbanization trends and specialty café expansion that create new consumption occasions and premium positioning opportunities. The on-trade channel serves as innovation testing ground and brand building platform, enabling producers to educate consumers about quality differences and origin characteristics that justify premium pricing. Digital trade initiatives under AfCFTA frameworks support e-commerce expansion and cross-border online sales that could benefit tea producers seeking regional market access. Distribution channel development requires investment in logistics infrastructure, quality control systems, and marketing capabilities to serve different channel requirements while maintaining product consistency and brand positioning across multiple touchpoints and market segments.
Geography Analysis
South Africa Tea Market
South Africa leads the Africa Tea Market with 32.08% market share in 2025, leveraging its established rooibos industry and growing urban tea consumption, while maintaining steady growth aligned with overall market expansion. The country's competitive advantage stems from indigenous tea varieties like rooibos and honeybush that command premium pricing in international markets through Protected Designation of Origin status and unique health positioning. South Africa's tea industry benefits from established export infrastructure, quality control systems, and brand recognition that enable access to premium markets in Europe and North America. The Agricultural Research Council's systematic research and development programs support industry expansion through cultivation optimization, processing innovation, and commercialization strategies that enhance competitiveness. Urban café culture expansion in cities like Cape Town and Johannesburg drives domestic premium tea consumption, creating opportunities for local producers to develop specialty products and direct-to-consumer channels that capture higher margins than commodity exports.
Egypt Tea Market
Egypt emerges as the fastest-growing regional market with 8.95% CAGR through 2031, driven by population growth, urbanization, and increasing disposable income among middle-class consumers. The country's large population base and strategic location create significant market opportunities, though complex regulatory requirements and import restrictions present challenges for international suppliers. Egypt's National Food Safety Authority centralizes food import oversight and requires extensive documentation for functional tea products, creating barriers that favor established suppliers with regulatory compliance capabilities. The market benefits from growing health consciousness and premium beverage consumption in urban areas, particularly Cairo and Alexandria, where international brands and specialty tea retailers establish presence. Egypt's participation in multiple trade agreements including AfCFTA, COMESA, and EU Association Agreement creates preferential access opportunities for African tea producers while reducing tariff barriers that historically favored non-African suppliers.
Broader African Markets
Rest of Africa encompasses diverse markets with varying growth trajectories and consumption patterns, collectively representing significant long-term expansion opportunities as economic development and urbanization accelerate across the continent. Kenya's position as a major tea producer creates supply chain advantages for regional distribution, though recent diplomatic tensions with Sudan highlight geopolitical risks that affect export market access. AfCFTA implementation creates opportunities for intra-African tea trade expansion, with trade facilitation measures potentially reducing customs clearance times and costs that historically limited regional market development. Rwanda and Tanzania benefit from climate conditions suitable for specialty tea production, while countries like Ghana and Nigeria represent emerging consumption markets driven by economic growth and changing beverage preferences. Regional market development requires investment in distribution infrastructure, brand building, and regulatory compliance capabilities to navigate diverse national requirements while capturing growth opportunities across multiple markets with different consumer preferences and competitive dynamics.
Regulatory Landscape
Africa tea trade and manufacturing are shaped by a mix of national licensing regimes and regional market-access frameworks. In Kenya, the Tea Act 2020 anchors governance of the sector, and the Ministry of Agriculture has tightened supply-chain oversight through registration and licensing rules covering growers, factories, transporters, and dealers, alongside mandatory conformity with national standards and the Tea Industry Code of Practice (KS:2128). For exporters, this creates a more formalized compliance pathway from green leaf movement to export brokerage, while also increasing documentation and audit needs for smallholders and independent dealers.
Cross-border trade rules increasingly interact with harmonized standards in East Africa and the AfCFTA framework. The African Continental Free Trade Area (AfCFTA), including certificates of origin and the Guided Trade Initiative, provides a route to expand intra-African shipments where sanitary and phytosanitary (SPS) compliance is met. In the East African Community (EAC), standards harmonization under the East African Standards Committee has progressed through updates such as EAS 1174:2024 (flavoured green tea) and EAS 1175:2024 (production and processing code of practice), alongside continued work on black tea specifications (DEAS 28:2024). Rwanda adds exporter controls through annual licensing via NAEB and phytosanitary certification through RALIS, reinforcing the role of traceability and export readiness in the regional regulatory stack.
Value Chain Analysis
Africa's tea value chain spans farm inputs (seedlings, fertilizer, crop protection), cultivation by smallholders and estates, leaf aggregation and transport, processing (CTC and orthodox/leaf), and downstream blending, packing, and distribution into off-trade retail and on-trade channels, alongside export logistics routed through auctions and direct contracts. East Africa remains pivotal to upstream supply: in Kenya, smallholders are the backbone of production managed at scale through the Kenya Tea Development Agency ecosystem, while estates add additional volume. The sector has also faced operational bottlenecks, including high fertilizer and fuel costs, reliance on firewood in processing, and rural transport inefficiencies.
Recent signals in the chain point to two simultaneous shifts: tighter formalization and more value capture at origin. Policy and governance actions in Kenya are strengthening traceability and funding mechanisms across the chain, while processors and marketers are pushing further into specialty teas and direct-market access to reduce reliance on bulk channels. Consolidation and vertical integration are also visible in Southern Africa, including Innscor Africa's move to take a strategic minority position in Tanganda Tea, and investments in factory modernization and energy upgrades designed to improve quality consistency and cost positions for made tea produced in Africa and sold domestically and into export corridors.
Competitive Landscape
The Africa Tea Market exhibits moderate concentration, indicating significant consolidation opportunities as demonstrated by recent major acquisitions reshaping industry structure and competitive dynamics. Browns Investments' strategic acquisitions of both Lipton and Finlays estates across Kenya, Rwanda, and Tanzania signal consolidation trends that combine operational scale with regional market access, while offering community ownership stakes that address land tenure concerns. Some of the prominent players include Hain Celestial, DAVIDSsTEA, Tata Consumer Products Limited, Dilmah Ceylon Tea Company PLC, Van Rees Group B.V., among others.
The competitive landscape reflects tension between traditional commodity producers focused on volume and cost efficiency versus premium positioning strategies that emphasize sustainability, origin authenticity, and health benefits. Technology adoption becomes critical for competitive advantage, with KTDA's 16 MW renewable energy initiative demonstrating how infrastructure investments reduce operational costs while supporting sustainability positioning according to the Global Agriculture and Food Security Program. Opportunities emerge in premium segments where African producers can leverage indigenous varieties, traditional knowledge, and sustainability credentials to differentiate from commodity competition. The suspension of traditional certification schemes like Rainforest Alliance creates opportunities for locally developed standards that reduce compliance costs while maintaining market access, potentially favouring regional players over international competitors.
Emerging disruptors include value-addition initiatives that enable smallholder farmers to capture higher margins through local processing and branding, supported by development organizations and impact investors seeking sustainable supply chain solutions. Land tenure disputes affecting foreign-owned estates create opportunities for domestic players and community-owned enterprises that address historical grievances while building local ownership structures. Regulatory compliance frameworks under National Food Safety Authority oversight in key markets like Egypt favor established players with documentation capabilities while creating barriers for smaller competitors lacking regulatory expertise.
Africa Tea Industry Leaders
-
Hain Celestial
-
DAVIDSsTEA
-
Tata Consumer Products Limited
-
Dilmah Ceylon Tea Company PLC
-
Van Rees Group B.V.
- *Disclaimer: Major Players sorted in no particular order
Africa Tea Market Companies Covered in this Report
- Hain Celestial
- DAVIDsTEA
- Tata Consumer Products Limited
- Dilmah Ceylon Tea Company PLC
- Van Rees Group B.V.
- McLeod Russel
- JDE Peet’s
- East African Tea Trade Association (EATTA)
- Kenya Tea Development Agency (KTDA)
- Chebango Tea Factory
- James Finlay Kenya
- Twinings
- Bigelow Tea
- Unilever plc
- Orientis Group (Kusmi Tea)
- Ekaterra
- Majestic Kenya Tea
- Johannesburg Tea Company
- Ahmad Tea
- Goldkili Trading
Market Opportunities and Future Outlook
Value addition and quality upgrading remain clear gaps across producing markets where bulk tea economics dominate. Kenya placed factory modernization and value-addition infrastructure at the center of sector programs in 2026, including multi-billion-shilling refurbishments aimed at lifting processing standards and supporting higher-value product formats. This connects with premiumization trends in the dataset, where leaf tea gains share versus CTC, and herbal and fruit infusions show faster growth. Rwanda is also adding industrial capacity through the inauguration of the Kibeho Tea Factory in 2026, a greenfield smallholder-linked project designed for 15 million kgs of made tea annually, which strengthens regional supply diversity and adds routes for branded and specialty outputs.
Intra-African trade development adds another opportunity layer beyond traditional export destinations. AfCFTA instruments, including certificates of origin and the Guided Trade Initiative, combined with EAC standards updates such as EAS 1174:2024 and EAS 1175:2024, support commercialization of regionally compliant tea products across West, Southern, and North African demand centers. In parallel, tighter import oversight in key consuming markets, including Egypts National Food Safety Authority requirements for functional claims, increases the premium on documented quality, residue compliance, and traceability. That creates openings for producers and brand owners to pair origin storytelling, including rooibos PDO and single-origin teas, with auditable compliance and differentiated packaging for specialty retail and on-trade channels.
Recent Industry Developments in Africa Tea Market
- May 2026: Palais des Thes partnered with Gatanga Industries and Equity Group Holdings to connect Kenyan specialty tea farmers with premium international buyers through more direct market access. The tie-up supports a shift from bulk channels toward higher-value specialty teas and strengthens the role of structured finance and commercialization support in the producer-to-export pathway.
- July 2025: Kenyas Ministry of Agriculture launched a campaign in Kericho County to distribute 400,000 certified tea plants to smallholder farmers, using Tea Research Institute varieties selected for higher yields and pest resistance. The program targets farm-level productivity improvements and helps stabilize green leaf supply for factories under increasingly variable weather conditions.
- April 2025: The Africa Tea Industry Progress (ATIP) Foundation was established following final regulatory clearances tied to the transfer of tea estates in Kenya, Rwanda, and Tanzania from Lipton Teas and Infusions to Browns Investments. The structure is designed to channel net proceeds back into sector development, reinforcing consolidation-driven changes in estate ownership and reinvestment priorities.
Africa Tea Market Report Scope and Research Methodology
Market Definition and Coverage
For this study, the Africa tea market is measured as the value of tea sold for consumption across African countries, converted to USD for a single comparable view. The sizing reflects the market value created from finished tea products moving through typical trade and retail channels.
Scope exclusions: We exclude equipment, farm inputs, and services tied to tea cultivation and processing unless they are part of the tea product value sold to end buyers.
Segments Covered in This Report
- By Form
- Leaf Tea
- CTC Tea
- By Product Type
- Black Tea
- Green Tea
- Herbal/Fruit Infusions
- Others
- By Flavour
- Unflavoured
- Flavoured
- By Category
- Organic
- Conventional
- By Packaging
- Pouches/Bags
- Boxes
- Others
- By Distribution Channel
- Off-Trade
- Supermarkets/Hypermarkets
- Convenience/Grocery Stores
- Specialty Stores
- Online Retail Stores
- Other Distribution Channels
- On-Trade
- Off-Trade
- By Geography
- South Africa
- Egypt
- Rest of the Africa
Data Sources, Market Sizing, and Validation
Desk Research
Desk research started with public statistics that show how tea flows across Africa and how pricing is moving over time. We referred to sources such as FAOSTAT for production, UN Comtrade and national customs dashboards for trade values and volumes, and the International Tea Committee for global and regional tea indicators that help sense-check direction.
To keep the pricing and currency steps grounded, we also used official inflation and FX references such as central bank releases and IMF or World Bank macro series, followed by reviews of listed-company filings, investor presentations, and credible trade press coverage on auction performance and export realizations. A paid subscription database was used selectively for company financials and for patent lookups where processing and packaging changes were relevant. These desk sources are not exhaustive, and many other public references were used to clarify, validate, and fill data gaps during the work.
Primary Interviews and Surveys
We conduct expert interviews and surveys with growers, processors, blenders, importers, distributors, retailers, foodservice buyers, and regulators across Africa. Their feedback helps validate secondary series, fill gaps in local consumption, pack sizes, channel shares, realized prices, and supply conditions. We re-contact respondents when crop volumes, prices, or demand direction conflicts with independent evidence.
Distribution of primary research fieldwork respondents
| Company type | Respondent position |
|---|---|
| Top tier: 30% | CXOs: 15% |
| Mid tier: 50% | Functional/Unit leaders: 30% |
| Smaller Players: 20% | Managers: 55% |
Market-Sizing & Forecasting
Sizing was built using a top-down approach where production, trade, and consumption indicators were used to reconstruct the addressable tea value for Africa, and then converted into a consistent USD view using aligned currency timing. After that, selective bottom-up checks were used, such as sampled price per kilogram ranges by key origins and channel checks on packaged tea versus bulk export flows, which helped adjust totals when outliers showed up.
Key inputs included export volumes and export unit values, auction price direction where relevant, packaged versus bulk mix, distribution channel split signals, and currency and inflation trends that influence local price realization. For forecasting, we relied on scenario analysis supported by a small set of drivers that respondents could confirm, including planted area and yield expectations, weather-related supply risk, packaging and brand mix shifts, and the pace of premiumization in large consuming markets. Where direct data was thin for smaller countries, we used proxy assumptions anchored to nearby markets with similar production and trade patterns, and then re-checked the outputs with primary feedback.
Data Validation & Update Cycle
Before finalizing, results were triangulated across independent signals, including trade value trends, implied per-capita consumption direction, and price movement checks, and then any sharp jumps were reviewed again for unit errors or currency effects. When a variance could not be explained cleanly, re-contact was triggered with respondents to confirm whether the change came from mix, pricing, or a one-time trade swing.
An additional analyst review is done before sign-off so that assumptions and calculations are consistent across years and across countries. The report is refreshed annually, and interim updates are made when material events occur, such as major FX resets, policy changes, or large supply disruptions. Right before delivery, a final pass is completed to ensure the latest public releases are reflected in the model.
Mordor Intelligence's Africa Tea Market Size Compared With Other Published Estimates
Published market sizes for Africa tea can look far apart, even when the topic label seems the same, because the scope and timing choices are not consistent across publishers. Differences also come from how bulk export tea versus packaged retail tea is treated, and whether values are converted using an average FX rate or a point-in-time rate.
A refresh-led gap shows up when FX timing, inflation pass-through, and price per kilogram assumptions are updated at different points in the year, and that can shift the USD view materially for tea-exporting economies. In our case, the model refresh aligns currency timing and checks export unit values against trade volumes and realized pricing ranges, which are then reviewed during updates, a choice applied by Mordor Intelligence.
Benchmark comparison
| Source | Market Size | Gaps in Research Methodology |
|---|---|---|
| Mordor Intelligence | USD 4.30 B (2026) | |
| Global Consultancy A | USD 10.50 B (2024) | The estimate appears to use an earlier base year and a broader value capture, which can inflate USD totals if packaged retail value and bulk trade value are both counted without a clear reconciliation step, and if FX conversion is not aligned to the same timing. |
| Industry Publisher B | USD 10.79 B (2025) | The sizing is likely built from a wider product set and a different price build, where average selling price progression is applied across countries with limited validation against export unit values, thereby creating a higher headline value when currency swings are present. |
Taken together, the spread is mainly explained by refresh cadence, FX timing, and how tea value is counted across bulk and packaged routes. By tying the model to repeatable public signals and then verifying sensitive assumptions through interviews, the final number stays traceable to clear steps that a reader can follow and re-check.
Key Questions Answered in the Report
How big will the Africa tea market be by 2031?
Forecasts place the Africa tea market size at USD 6.11 billion in 2031, up from USD 4.3 billion in 2026.
Which country currently leads regional tea value?
South Africa holds the largest 32.08% share thanks to rooibos exports and growing domestic specialty consumption.
Which product form is gaining momentum over CTC?
Leaf tea is projected to grow at 7.52% CAGR, fueled by premiumization and single-origin demand.
Which distribution channel is expanding fastest?
On-trade cafés and restaurants show a 7.55% CAGR, driven by urbanization and specialty beverage culture.