
Africa SVOD Market Size and Share
Market Overview
| Study Period | 2021 - 2031 |
|---|---|
| Forecast Data Period | 2026 - 2031 |
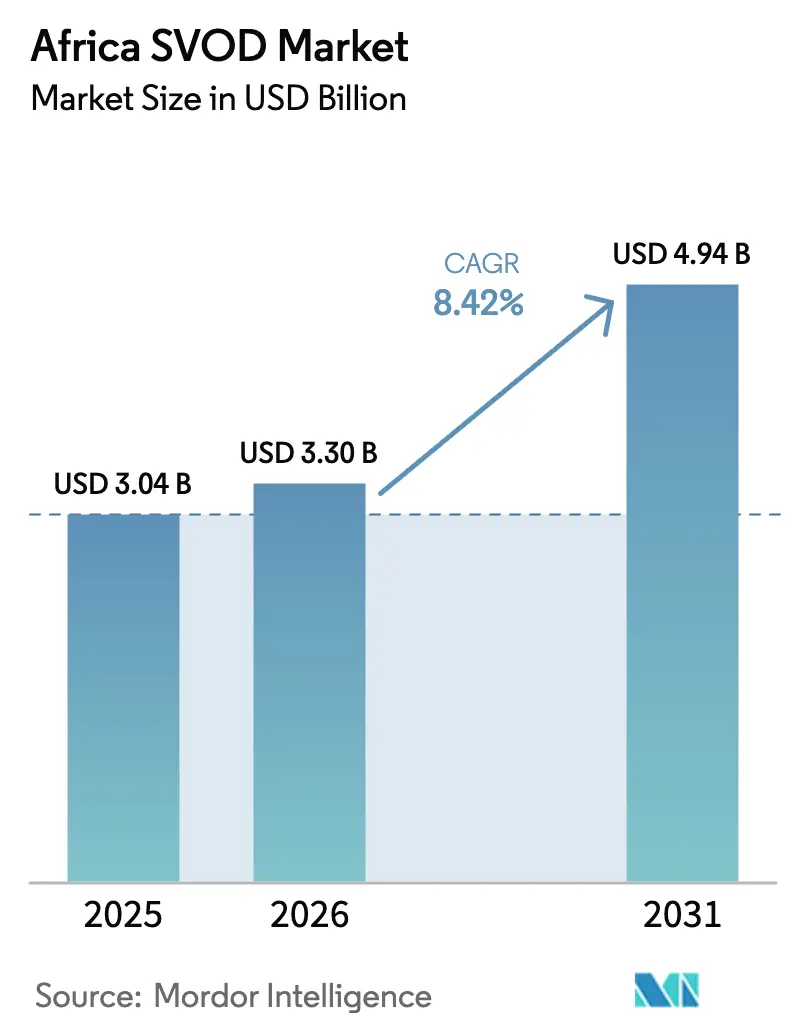
| Base Year Market Size (2025) | USD 3.04 Billion |
| Market Size (2026) | USD 3.3 Billion |
| Market Size (2031) | USD 4.94 Billion |
| Growth Rate (2026 - 2031) | 8.42% CAGR |
| Market Concentration | High |
Major Players *Disclaimer: Major Players sorted in no particular order Image © Mordor Intelligence. Reuse requires attribution under CC BY 4.0. | |
Africa SVOD Market Analysis by Mordor Intelligence
The Africa SVOD market size was valued at USD 3.04 billion in 2025 and estimated to grow from USD 3.3 billion in 2026 to reach USD 4.94 billion by 2031, at a CAGR of 8.42% during the forecast period (2026-2031). Mobile-data affordability, accelerating smartphone penetration and the bundling of streaming plans with telco services underpin this growth, while recent M&A activity has reshaped competitive dynamics. Consolidation is exemplified by Canal+ acquiring MultiChoice, strengthening pan-regional distribution and bargaining power. Global platforms intensify competition by localizing content and leveraging partnerships, while local investors and public-sector incentives nurture home-grown productions. These drivers collectively widen the addressable audience and reinforce monetization opportunities for all tiers of providers across the Africa SVOD market.
Key Report Takeaways
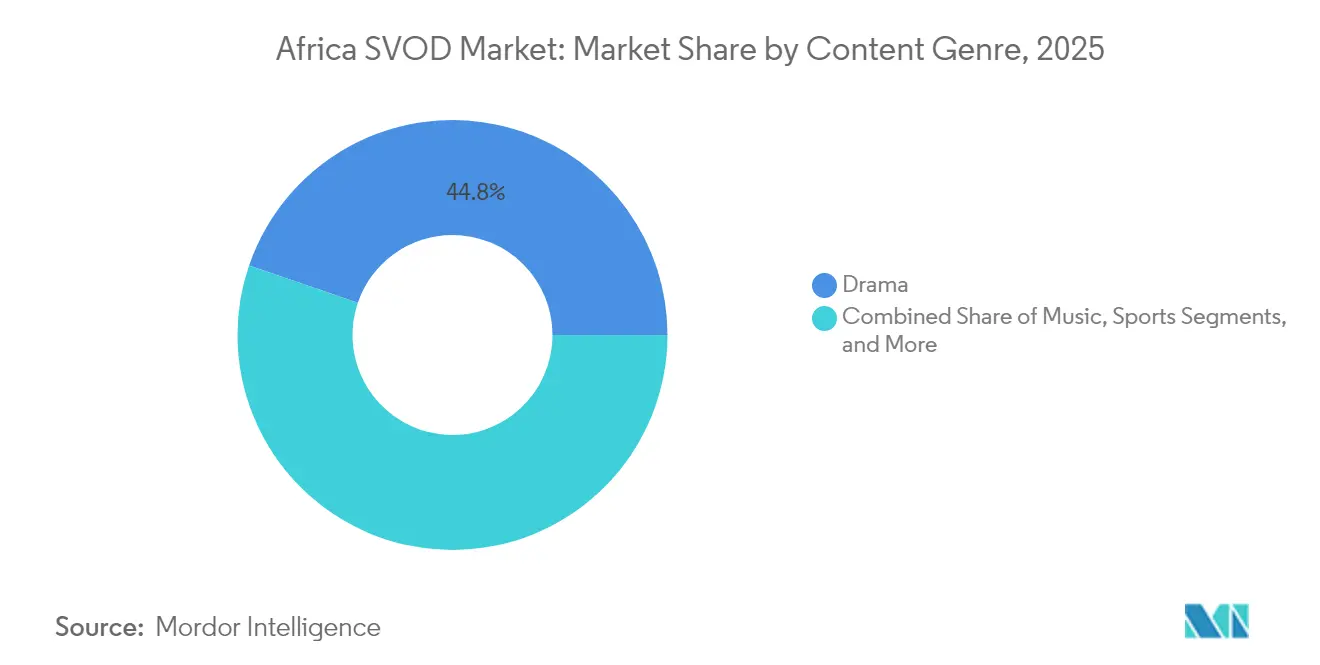
- By content genre, drama led with a 44.76% revenue share in 2025, whereas sports is forecast to register a 10.05% CAGR through 2031.
- By revenue model, the SVOD segment retained 91.12% of the Africa SVOD market share in 2025, while TVOD is projected to expand at a 9.25% CAGR to 2031.
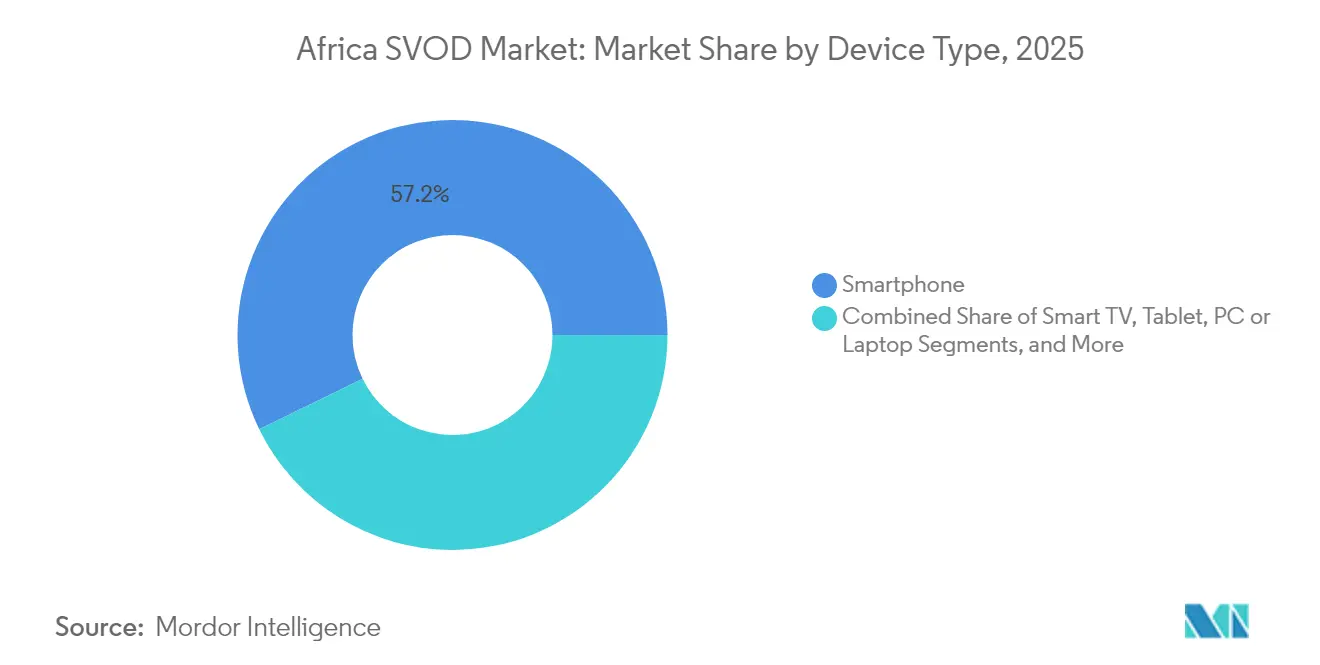
- By device type, smartphones captured 57.22% of the Africa SVOD market size in 2025 and smart TVs are advancing at a 8.98% CAGR through 2031.
- By age group, viewers aged 18-24 years are expected to post the fastest 8.77% CAGR to 2031, while the 25-34 years cohort commanded 36.58% of subscriptions in 2025.
Note: Market size and forecast figures in this report are generated using Mordor Intelligence’s proprietary estimation framework, updated with the latest available data and insights as of 2026.
Africa SVOD Market Trends and Insights
Drivers Impact Analysis*
| Driver | (∼) % Impact on CAGR Forecast | Geographic Relevance | Impact Timeline |
|---|---|---|---|
| Intensification of competition with global entrants | +1.8% | South Africa, Nigeria, Kenya | Medium term (2-4 years) |
| Expansion of affordable mobile data bundles | +2.1% | Sub-Saharan core markets | Short term (≤ 2 years) |
| Surge in smartphone penetration across Africa | +2.3% | Nigeria, South Africa, Ethiopia | Medium term (2-4 years) |
| Rising local content investment incentives | +1.4% | Nigeria, South Africa, Kenya, Ghana | Long term (≥ 4 years) |
| Telco-OTT hybrid bundling strategies | +1.2% | Pan-African | Short term (≤ 2 years) |
| Introduction of cloud-native streaming architectures | +0.6% | Urban hubs | Long term (≥ 4 years) |
| Source: Mordor Intelligence | |||
Intensification of Competition with Global Entrants
Global platforms deepen their African focus by commissioning originals and striking distribution alliances. Netflix alone licensed 283 Nigerian titles and earmarked USD 23.6 million for further content development, signalling sustained local investment. Aggressive localization broadens appeal, yet recurring price hikes in price-sensitive markets highlight monetization complexities.[1]Favour Damilola Olaiya, “Why Netflix Hiked Its Prices in Nigeria for the Third Time Since 2024,” readcommunique.com Disney + concentrates its rollout on South Africa, whereas Amazon Prime Video packages streaming with e-commerce perks to differentiate. Canal+ leverages its MultiChoice acquisition to scale across 50 countries and nearly 50 million subscribers, intensifying the fight for premium.
Expansion of Affordable Mobile Data Bundles
Operator-led data bundles and zero-rating propel streaming uptake. Safaricom doubled fiber speeds and introduced family share plans that merge mobile and fixed-line access, directly confronting Starlink’s entry. M-PESA Ratiba’s standing-order feature automates subscription payments and minimizes churn. Airtel’s virtual Mastercard lets 150 million mobile-money users subscribe to international services, reducing payment friction and expanding addressable wallets. Such prepaid bundles and micropayments lower entry barriers and sustain demand across the Africa SVOD market.
Surge in Smartphone Penetration Across Africa
Smartphone connections are projected to climb from 540 million in 2024 to 890 million by 2030 as device costs fall and telcos subsidize entry-level 4G and 5G handsets.[2]GSMA, “The Mobile Economy: Sub-Saharan Africa 2024,” gsma.com South Africa’s Vodacom launched a USD 13.4 cloud-based handset, while MTN positioned a USD 134.9 5G phone to widen access, enabling higher-quality video streams and strengthening 4K adoption. Nigeria leads in absolute smartphone numbers, while Kenya leverages mobile money integration to lock in recurring subscriptions. Rising 5G readiness enhances bandwidth for HDR streams and interactive formats, reinforcing smartphone dominance within the Africa SVOD market.
Rising Local Content Investment Incentives
Public policies now require platforms to finance local productions or hit content-quota thresholds. South Africa’s proposed regulation seeks mandatory contributions to domestic funds by 2027. Nigeria’s “Screen Nigeria” program showcases Nollywood at Cannes and Toronto, elevating global visibility for African storytelling. The Afreximbank’s USD 1 billion film fund channels capital toward filmmakers, adding scale to local studios and improving production values. Such incentives enrich catalogs and differentiate regional platforms competing within the Africa SVOD market.
Restraints Impact Analysis*
| Restraint | (∼) % Impact on CAGR Forecast | Geographic Relevance | Impact Timeline |
|---|---|---|---|
| Persistently high subscription fees versus ARPU | -1.9% | Nigeria, Ghana, Kenya | Short term (≤ 2 years) |
| Patchy broadband infrastructure outside metros | -1.3% | Rural Sub-Saharan regions | Long term (≥ 4 years) |
| Increasing piracy via illicit streaming devices | -0.8% | Nigeria, South Africa, Kenya | Medium term (2-4 years) |
| Local currency volatility impacting pricing power | -1.1% | Nigeria, Ghana, Zambia | Short term (≤ 2 years) |
| Source: Mordor Intelligence | |||
Persistently High Subscription Fees Versus ARPU
Price hikes strain adoption and amplify regulatory scrutiny. MultiChoice Nigeria raised DStv premiums by more than 22% in 2025, pushing monthly fees to NGN 44,500 (USD 50.3) and sparking consumer backlash. Ghana’s authorities threatened to revoke licenses unless fees dropped by 30% Netflix enacted three Nigerian price increases in two years, highlighting the tension between cost recovery and affordability within the Africa SVOD market. Ultimately, these high price-to-income ratios limit penetration among lower-income and rural users.
Patchy Broadband Infrastructure Outside Metros
Sub-5% fixed-broadband household penetration in Nigeria and 10.4% in Kenya underscore inadequate last-mile connectivity. Rural throughput often fails to support HD streams, constraining reach for providers reliant on steady bitrates. Starlink’s satellite service faces licensing setbacks, with Cameroon ordering shutdowns and others mandating local partners, limiting one potential workaround. Load-shedding in South Africa further disrupts network uptime and viewing sessions. Such gaps dilute growth, particularly outside leading metros where the Africa SVOD market remains underpenetrated.
*Our forecasts treat driver/restraint impacts as directional, not additive. The impact forecasts reflect baseline growth, mix effects, and variable interactions.
Segment Analysis
By Content Genre: Drama Dominance amid Sports Acceleration
Drama accounted for 44.76% of revenue in 2025, cementing its place as the cornerstone of the Africa SVOD market share. The success of crossover hits such as “Blood and Water” expanded global appetite for African drama, while MultiChoice’s 59 local originals across four core territories in fiscal 2024 increased its Africa SVOD market size footprint in premium storytelling. Live-event genres and lifestyle shows supplement demand, yet dramas retain longer shelf life across demographics. Sports, although only 13.28% of 2025 revenue, exhibits a 10.05% CAGR to 2031, powered by rights to FIFA Club World Cup 2025 and AFCON’s record-shattering 10.3 million unique-viewer semifinal.Showmax’s mobile-only Premier League tier at ZAR 69 (USD 3.73) monthly underscores the smartphone-first positioning that drives sports subscriptions.
The segment’s upside reflects Africa’s vast football fandom and the willingness of fans to pay for marquee tournaments even if they avoid higher-priced general-entertainment tiers. Aggregators increasingly deploy pay-per-view add-ons within the Africa SVOD market to blend recurring and transactional models. Over the forecast period, providers that secure local leagues and women’s sports will widen engagement, while low-latency streaming and interactive watch-parties will deepen retention. Drama is expected to hold leadership but cede some share to sports, documentaries and music, given the rising accessibility of live events on mobile networks.


By Revenue Model: SVOD Leadership with TVOD Momentum
The SVOD model captured 91.12% of receipts in 2025, illustrating consumer preference for flat-rate access in the Africa SVOD market. Bulk data top-ups, standing-order mobile payments and telco-bundling agreements sustain recurring revenues and reduce churn. Netflix bundles within Canal+ packages across 24 Francophone countries exemplify distribution leverage, whereas Showmax’s Peacock-powered relaunch enhances 4K streaming and content discovery to justify subscription price points. Despite dominance, SVOD faces affordability constraints, prompting experimentation with mobile-only plans and shared-household tiers.
TVOD’s 9.25% CAGR stems from its pay-as-you-go appeal to price-sensitive users or those seeking premium exclusives without long-term commitments. The model supports blockbuster movie releases alongside sports finals, enabling platforms to monetize peaks in demand. Hybrid monetization-merging subscription for catalog content and transactional for high-value events-emerges as a practical hedge against income volatility in the Africa SVOD market. Over time, ad-supported tiers may absorb part of TVOD growth, yet transactional options will persist for marquee events and early-release titles.
By Device Type: Smartphone Supremacy with Smart TV Emergence
Smartphones represented 57.22% of viewing time in 2025 and continue to anchor the Africa SVOD market, aided by robust 4G coverage and falling device prices GSMA. Features such as offline downloads and data-optimized encodes lower bandwidth consumption, while telco bundles improve cost predictability for heavy users. Short-form content and social sharing enhance engagement on mobile screens, making smartphones indispensable for platform traction.
Smart TV penetration grows at 8.98% CAGR as fiber rollouts and Google’s Umoja cable reduce latency and wholesale capacity costs, increasing the Africa SVOD market size for connected-living-room experiences. Emerging ad-supported channels on smart TVs offer incremental revenue streams, while targeted ads overcome ARPU constraints. Tablets and laptops retain relevance for educational and family co-viewing, whereas consoles and set-top boxes cater to premium households. Nonetheless, smartphone viewing is likely to remain the dominant mode through 2030, even as large-screen adoption broadens.
By Age Group: Millennial Leadership with Gen Z Acceleration
The 25-34 cohort commanded 36.58% of subscriptions in 2025, driven by stable incomes and familiarity with online payments, thereby anchoring recurring revenues in the Africa SVOD market. They consume a mix of international blockbusters and locally resonant series, influencing platform commissioning strategies. In contrast, the 18-24 demographic displays the fastest 8.77% CAGR, reflecting a mobile-centric lifestyle and affinity for user-generated content tie-ins. This cohort champions social-watch capabilities and short-cycle subscriptions, pushing platforms to optimize for flexible billing and bite-sized storytelling.
Older segments (35-44 and 45 +) value premium sports, family bundles and customer service, affecting household subscription decisions. They also represent potential upsell targets for higher-tier packages that include 4K and multi-screen access. As aging millennials shift upward in the income ladder, providers that curate diverse catalogs and maintain competitive pricing will lock in lifetime value, reinforcing demographic resilience across the Africa SVOD market.
Geography Analysis
South Africa remains the epicenter of the Africa SVOD market, accounting for three-quarters of the continent’s 4.5 million OTT subscriptions in 2023 and generating revenue of ZAR 4.5 billion (USD 246 million) that year [PWC]. Fixed-broadband household penetration reached 46.3%, enabling 4K streaming and bolstering premium ARPU. Regulatory reform, including potential local-content levies by 2027, could recalibrate competitive costs but would concurrently strengthen domestic production capacity.
Nigeria posts the fastest 10.71% CAGR among major markets, propelled by a vast population and robust Nollywood pipeline. OTT revenue is set to climb from USD 65 million in 2023 to USD 107 million by 2028, although currency volatility has prompted repeated price adjustments by providers READCOMMUNIQUE. Payment innovation, notably Airtel’s virtual Mastercard and deep mobile-money penetration, alleviates friction. Infrastructure hurdles persist, yet 5G rollouts in Lagos and Abuja expand capacity for HD playback, enhancing the Nigeria slice of the Africa SVOD market. Kenya outperforms on mobile-money penetration, achieving a 10.68% CAGR outlook through 2031. The market benefits from Safaricom’s aggressive data pricing and standing-order billing, which reduce churn. Urban fiber projects further boost average speeds, encouraging smart-TV adoption. Meanwhile, Egypt and Morocco bring Arabic-language depth and proximity to European peering hubs, improving latency and expanding the Africa SVOD market footprint in North Africa. Francophone territories leverage Canal+ heritage and the Netflix distribution alliance for reach, whereas Lusophone nations such as Angola and Mozambique emerge as greenfield opportunities once subsea cables and terrestrial fiber mature.
Regulatory Landscape
In the Central African Republic, media and audiovisual oversight is anchored by the Haut Conseil de la Communication (HCC), which issues publishing permits for written and online media and grants approvals or licenses for television and radio broadcasting under the 2020 Law on Freedom of Communication. For digital delivery of SVOD services, the electronic communications layer is regulated by ARCEP (Agence de Regulation des Communications Electroniques et des Postes), operating under the 2018 Electronic Communications Act and Law 17.020 of 2017, shaping licensing and operating requirements for telecom networks that carry streaming traffic.
For SVOD operators and their distribution partners, compliance typically spans both content and carriage. HCC-linked requirements cover media activity, while ARCEP-linked requirements cover network operations, service provisioning, and associated consumer protections. This dual-regulator setup increases the need for structured partnerships with in-country connectivity providers, along with compliant payment and customer support operations when scaling streaming propositions.
Value Chain Analysis
The Africa SVOD value chain in the Central African Republic is led by platform owners and content rightsholders (global services and regional incumbents), supported by local distribution and customer access layers dominated by mobile connectivity. MultiChoice maintains a country presence through DStv, reflecting how established video entertainment aggregators package catalogs and channels and can steer customers toward streaming where connectivity allows.
Delivery and monetization rely heavily on telecom and payments partners. Mobile network operators such as Orange CAR, Telecel CAR, and Moov Africa CAR form the primary access channel for internet connectivity and also act as bundling and billing gatekeepers for streaming offers, while payment enablement typically depends on integrations across MNOs, banks, and fintech vendors. The downstream chain includes device ecosystems (smartphones as the primary screen), customer onboarding, and retention levers such as data bundles and recurring-payment workflows that reduce friction in low card-penetration contexts.
Competitive Landscape
The Africa SVOD market is defined by a two-tier hierarchy comprising global giants and strong regional incumbents. Netflix leads in absolute subscribers, projected to hit 6.9 million across sub-Saharan Africa by 2029. MultiChoice’s Showmax, revitalized through its Peacock technology migration and newly integrated sports portfolio, targets 3.7 million subscribers over the same horizon. Canal+ secured a decisive edge via its USD 2 billion acquisition of MultiChoice, consolidating 50 nation coverage and nearly 50 million pay-TV customers, creating unprecedented scale in content procurement and cross-promotion.[4]C21Media, “Canal+ Takes Effective Control of MultiChoice,” c21media.net
Strategic partnerships shape market posture. Netflix gains reach through Canal+ distribution in Francophone Africa, while Showmax embeds NBCUniversal’s library and tech stack to enhance user experience. Telcos emerge as gatekeepers by bundling data and streaming; Vodacom’s AI-powered recommendation deal with Google exemplifies this synergy. Niche players such as iROKO pivot toward diaspora audiences, and newcomers like TF1+ test free ad-supported models across 22 countries, signaling a shift toward hybrid monetization that aligns with regional spending power.
Competitive intensity varies by geography. South Africa witnesses the highest ARPU and platform diversity, while Nigeria’s addressable base attracts aggressive pricing and localization. French-speaking markets count on Canal+ and TF1+ for culturally resonant content, whereas East Africa’s mobile-first ecosystem favors telco-bundled solutions. Going forward, ecosystem partnerships with handset makers, cloud vendors and sports federations will define leadership positions within the Africa SVOD market.
Africa SVOD Industry Leaders
Amazon.com, Inc.
Netflix Inc.
Walt Disney Company (Disney+)
MultiChoice Group Ltd.
Apple Inc. (Apple TV+)
- *Disclaimer: Major Players sorted in no particular order


Market Opportunities and Future Outlook
A key whitespace in the Central African Republic is basic addressability: as of late 2025, around 88.0% of the population was offline, with about 670,000 internet users. As a result, mass-market SVOD reach depends heavily on improving connectivity and affordability, which in turn supports mobile-first product design such as data-optimized encodes, offline viewing, and telco-led bundles that convert prepaid users into paying subscribers without requiring widespread fixed broadband.
Radio also remains the most critical information channel in rural communities where television and internet access are limited. In this context, hybrid distribution and marketing models can broaden awareness and drive trial, particularly where streaming brands already operate regionally. Partnerships that align SVOD with connectivity providers for access and billing, and with established video aggregators for packaging and customer trust, map directly to current constraints, while localized payment integrations via MNOs and fintech vendors address a major adoption barrier for international services.
Recent Industry Developments
- July 2026: Netflix Inc. announced a content partnership with free-to-air broadcaster e.tv to distribute original streaming content in Africa. The arrangement combines terrestrial and streaming distribution to extend Netflix's footprint in Africa. It also adds a hybrid access route that can shift competitive dynamics in Africa SVOD.
- July 2026: Amazon.com Inc. announced a partnership with South African ISP Herotel to launch Amazon Leo satellite internet services in South Africa. The satellite service expands connectivity to underserved areas, which supports broader SVOD adoption across the region. It also widens the practical addressable market for streaming services in Africa.
- May 2026: MultiChoice Group Ltd. consolidated its streaming strategy around DStv Stream following the closure of Showmax. This shift strengthens the bundled premium service and increases high-margin subscriber engagement for the group. It also repositions pricing and competitive dynamics in Africa’s streaming landscape.


Research Methodology Framework and Report Scope
Market Definition and Coverage
For this study, the Africa SVOD market covers paid, subscription-based access to video content delivered over the internet to users across African countries, counted as platform subscription revenues generated within the region.
Scope exclusions: We exclude free ad-supported streaming, piracy-related viewing, and non-video digital content subscriptions such as music or gaming.
Segmentation Overview
- By Content Genre
- Drama
- Music
- Sports
- Other Content Genres
- By Revenue Model
- Subscription Video on Demand
- Transactional Video on Demand
- By Device Type
- Smartphone
- Smart TV
- Tablet
- PC or Laptop
- Other Device Types
- By Age Group
- 18-24 Years
- 25-34 Years
- 35-44 Years
- 45 Years and above
- By Country
- Kenya
- South Africa
- Nigeria
- Egypt
- Morocco
- Rest of Africa
Data Sources, Market Sizing, and Validation
Desk Research
Desk research was used to set the base structure of the model and to keep assumptions realistic for internet video demand in Africa. We relied on public statistics for broadband and mobile access, device readiness, and household spending capacity, since these factors shape how many paying subscriptions can exist in each country.
Typical sources included official telecom and ICT releases and national statistics offices, along with datasets and reports from bodies such as the International Telecommunication Union, World Bank, GSMA, and UNESCO. We also reviewed company filings, investor presentations, press releases, and reputable news coverage to track service launches, pricing changes, and bundling with telecom plans. Where needed, we used paid subscriptions for company financials and news, patent databases, and an import export shipment-level database selectively to speed up validation checks. This list is not exhaustive, and many other sources were also consulted to collect data, cross-check it, and clarify open points.
Primary Interviews and Surveys
Primary work focused on interviews and short surveys with streaming ecosystem participants such as platform teams, telecom bundle owners, payment enablers, advertisers around hybrid tiers, and content distributors. Input was collected across key African sub-regions so differences in broadband quality, payment acceptance, and local content demand could be reflected, then used to confirm country weights, pricing logic, and churn expectations.
Distribution of primary research fieldwork respondents
| Company type | Respondent position | Region |
|---|---|---|
| Top tier: 27% | CXOs: 20% | |
| Mid tier: 52% | Functional/Unit leaders: 37% | |
| Smaller Players: 21% | Managers: 43% |
Market-Sizing & Forecasting
Sizing starts with a top-down demand pool build using country-level connected population indicators, then filters that pool through likely paid-video adoption and active subscription rates. To keep the totals grounded, we corroborated the results with selective bottom-up approximations, including sampled price points by plan type multiplied by estimated paying accounts from channel checks, followed by adjustments where bundle-heavy markets distort headline pricing.
Key inputs used in the model include smartphone penetration and mobile broadband coverage, fixed broadband penetration in urban pockets, typical monthly plan pricing and discounting through telecom bundles, digital payment acceptance (cards, mobile money, and app store billing), and observable churn behavior linked to sports and local series release cycles. Where country data was thin, gaps were handled by using proxy markets with similar income and connectivity profiles, then rechecked through expert feedback before being finalized.
For forecasting, scenario analysis was applied around connectivity expansion and pricing actions, then translated into annual growth paths by country and rolled up to the regional total. Expert views were used to keep assumptions realistic on how quickly bundled plans convert into paid accounts and how price increases land across different income brackets.
Data Validation & Update Cycle
Validation is done through multiple checks so totals stay consistent with independent signals. We reconcile modeled subscribers and revenues against public connectivity trends, known bundle mechanics, and observed pricing ranges, then investigate outliers until the driver is explained or corrected.
Before sign-off, the work goes through stepwise analyst review, where assumptions are challenged, calculations are recalculated, and country roll-ups are verified. Reports are refreshed annually, with interim updates triggered by material events such as major price changes, platform exits, new bundle partnerships, or regulatory shifts. Right before delivery, a final pass is completed so clients receive the latest updated view.
Mordor Intelligence's Africa Svod Market Estimate Compared With Other Published Estimates
Published market sizes for Africa SVOD often vary because different studies do not count the same revenues, and they also use different base years and currency timing. Differences tend to show up when one model leans more on subscriber counts, while another leans more on reported financials or broad digital video spending.
The main gap comes from whether transactional rentals and purchases are counted together with subscriptions, and how telecom-bundled plans are priced inside the revenue build, where Mordor Intelligence treats Africa SVOD as subscription revenues only and adjusts blended pricing so discounted bundle equivalents do not inflate the average.
Benchmark comparison
| Source | Market Size | Gaps in Research Methodology |
|---|---|---|
| Mordor Intelligence | USD 3.04 B (2025) | |
| Industry Association A | USD 2.60 B (2025) | Uses a narrower monetization view that undercounts bundle-driven subscriptions and applies conservative adoption rates in lower ARPU markets, which pulls down the total for the same year. |
| Global Consultancy B | USD 3.80 B (2025) | Folds adjacent digital video revenues into the total and applies higher blended pricing without separating promotional and bundled plans, which pushes the figure above a subscription-only build. |
Overall, the spread mainly comes from revenue scope and how blended pricing is handled in bundle-heavy markets. By tying the model to clear demand indicators, consistent price logic, and cross-checks at the country level, the estimate stays transparent and repeatable even when public data is uneven.


Key Questions Answered in the Report
How large is the Africa SVOD market in 2026?
It generated USD 3.3 billion in revenue in 2026 and is on track for an 8.42% CAGR to 2031.
Which content genre is growing fastest?
Sports streaming leads with a projected 10.05% CAGR through 2031, supported by premium rights acquisitions.
What device dominates streaming consumption?
Smartphones account for 57.22% of viewing, driven by affordable data and widespread 4G coverage.
Why are subscription fees a constraint?
Prices have risen faster than average income, prompting regulatory pushback and limiting penetration in lower-income segments.
Which company recently reshaped competition?
Canal+ acquired MultiChoice in 2025, creating a pan-African media giant with nearly 50 million customers.
Which age demographic offers the highest growth?
Viewers aged 18-24 years are set to expand subscriptions at a 8.77% CAGR through 2031 as digital natives mature economically.
Page last updated on:


