
Africa Orange Market Analysis by Mordor Intelligence
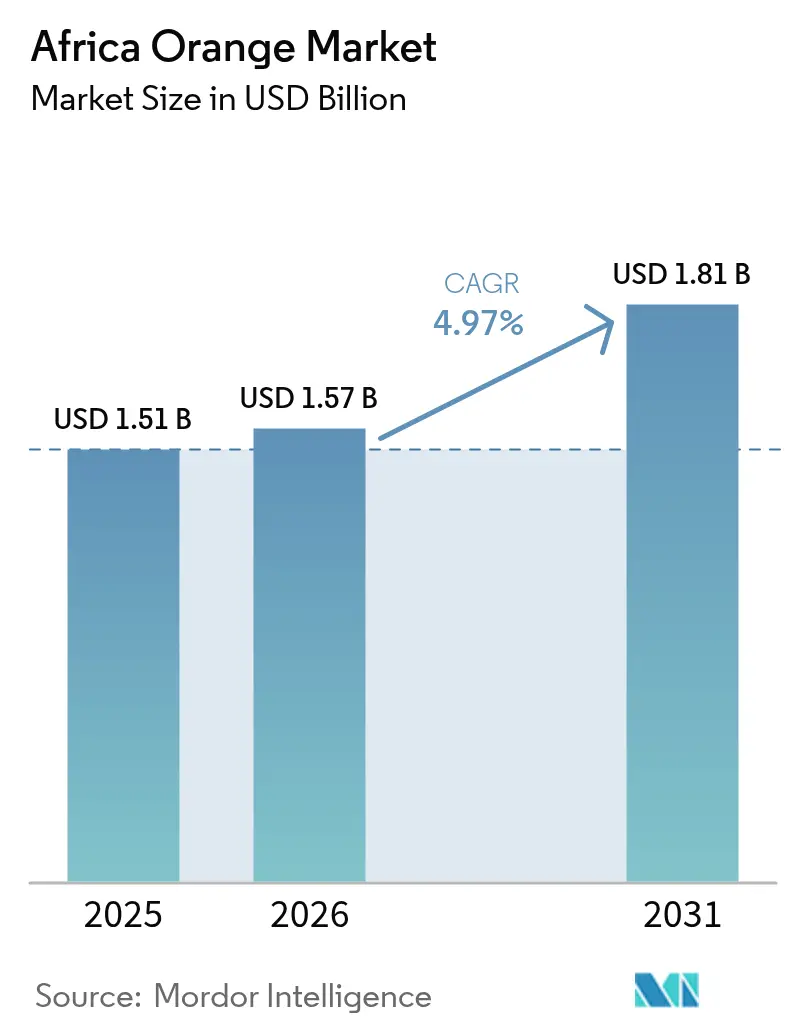
The Africa orange market size was valued at USD 1.51 billion in 2025 and estimated to grow from USD 1.57 billion in 2026 to reach USD 1.81 billion by 2031, at a CAGR of 4.97% during the forecast period (2026-2031). Rising global orange-juice prices, irrigation upgrades in Egypt and Morocco, and expanding supermarket penetration across urban hubs are supporting the steady advance of the Africa orange market. Valencia cultivars dominate both juice processing and fresh export channels, yet blood oranges are capturing premium shelf space as retailers differentiate their assortments. Government incentives for climate-smart irrigation and processing investments are improving yield stability and value capture, while phytosanitary barriers and load-shedding remain prominent operational challenges.
Key Report Takeaways
- By geography, Egypt led with 43.5% of Africa orange market share in 2025, and Morocco is the fastest-growing country at a 6.8% CAGR to 2031.
Note: Market size and forecast figures in this report are generated using Mordor Intelligence’s proprietary estimation framework, updated with the latest available data and insights as of 2026.
Africa Orange Market Trends and Insights
Drivers Impact Analysis*
| Driver | (~) % Impact on CAGR Forecast | Geographic Relevance | Impact Timeline |
|---|---|---|---|
| Climate-smart irrigation scale-up | +0.8% | Egypt, and Morocco | Medium term (2-4 years) |
| Record-high global orange-juice prices lifting farm-gate margins | +1.2% | South Africa, Egypt, and Morocco | Short term (≤ 2 years) |
| New China-Africa cold-treatment protocol | +0.5% | Morocco, and South Africa | Medium term (2-4 years) |
| Emergence of pan-African commodity exchanges | +0.3% | Kenya, Ethiopia, and Nigeria | Long term (≥ 4 years) |
| Adoption of high-yield Valencia Late cultivars | +0.6% | South Africa, and Morocco | Medium term (2-4 years) |
| On-farm solar micro-grids reducing post-harvest losses | +0.4% | Ethiopia, Kenya, rural South Africa | Long term (≥ 4 years) |
| Source: Mordor Intelligence | |||
Climate-Smart Irrigation Scale-Up
Egypt and Morocco are equipping thousands of hectares with subsidized drip systems that lift per-hectare yields by up to 20%, reduce water stress, and support export-grade sizing. Morocco’s 2024/25 orange crop rose 17% year on year to 960,000 metric tons as drip adoption widened[1]. In Egypt's Noubaria reclamation zone, Magrabi Agriculture manages 3,360 hectares of integrated citrus farms, utilizing centralized drip irrigation systems and tissue-culture propagation to ensure export-grade quality. In Morocco, the government provides per-hectare aggregation incentives, ranging from USD 75 for large conventional growers to USD 300 for small organic farms, promoting technology adoption among smallholders.
Record-High Global Orange-Juice Prices Lifting Farm-Gate Margins
Orange juice futures exceeded USD 4,200 per ton in 2024, keeping February 2026 prices significantly above the five-year average and increasing African farm-gate returns by (15-20%). Production shortfalls in Brazil and Florida, caused by citrus greening and hurricane damage, tightened the global concentrate supply and directly impacted price signals for African growers. Egyptian exporters, including Wadi El Nour, noted that overproduction during the 2023/24 season had lowered prices. The 2024/25 season experienced improved profitability as government subsidy reductions phased out less efficient operators, while demand from Russia, Saudi Arabia, and Brazil strengthened.
New China-Africa Cold-Treatment Protocol
Morocco, Egypt, and South Africa now access Chinese ports under harmonized cold-treatment rules that lower rejection risk, supporting diversification away from the European Union. The Standards and Trade Development Facility established COMESA-wide standard operating procedures for citrus phytosanitary inspections in 2024, standardizing protocols across member states and minimizing border delays. This regulatory alignment is especially beneficial for Morocco, which encounters early-season competition from Chilean mandarins and relies on reliability and traceability to achieve premium pricing in the Shanghai and Guangzhou distribution hubs.
Emergence of Pan-African Commodity Exchanges
Platforms like AFEX and the Ethiopian Commodity Exchange are testing citrus forward contracts to provide transparent price discovery for smallholders not integrated into supermarket supply chains. These platforms are particularly significant for smallholders excluded from supermarket procurement systems, which increasingly require consistent year-round supply, strict food safety certifications, and centralized distribution. According to the United Nations Conference on Trade and Development (UNCTAD) report on supermarket supply chains in sub-Saharan Africa, major South African retailers such as Shoprite and Pick 'n Pay source over 90% of their fresh produce from commercial producers. As a result, smallholders often rely on brokers or local wholesale markets unless they can aggregate their produce and obtain necessary certifications.
Restraints Impact Analysis*
| Restraint | (~) % Impact on CAGR Forecast | Geographic Relevance | Impact Timeline |
|---|---|---|---|
| Citrus greening spread beyond Limpopo | -0.9% | South Africa | Medium term (2-4 years) |
| Fertilizer-price pass-through on grower margins | -0.6% | Egypt, Morocco, and South Africa | Short term (≤ 2 years) |
| European Unipn CBS (citrus black-spot) phytosanitary barrier | -0.5% | South Africa | Short term (≤ 2 years) |
| Cold-chain power-supply volatility | -0.4% | South Africa | Short term (≤ 2 years) |
| Source: Mordor Intelligence | |||
Citrus Greening Spread Beyond Limpopo
Huanglongbing, also known as citrus greening, has spread from South Africa's Limpopo province into Mpumalanga's orchards, posing a risk to the country's status as Africa's largest citrus exporter. South Africa's Department of Agriculture, Land Reform and Rural Development reported the detection of infected trees at multiple sites in Mpumalanga in 2024, leading to the implementation of mandatory removal protocols and the establishment of quarantine zones[2]. According to the Citrus Growers' Association, an uncontrolled spread could decrease export volumes by 15% to 20% over the next decade, threatening the industry's Vision 260 goal of achieving 260 million cartons by 2030.
Fertilizer-Price Pass-Through on Grower Margins
Urea and NPK values remain (20–25) over 2023 levels. Precision-agriculture tools and soil testing are mitigating some cost escalation, but squeezed margin effects persist. Morocco's fertilizer market, which relies heavily on imports, has experienced price volatility driven by global natural gas price fluctuations and geopolitical supply disruptions. In January 2025, South Africa's Competition Commission Fresh Produce Market Inquiry highlighted high fertilizer and seed costs as structural barriers for small-scale and historically disadvantaged farmers, restricting their access to formal retail and export markets.
*Our forecasts treat driver/restraint impacts as directional, not additive. The impact forecasts reflect baseline growth, mix effects, and variable interactions.
Geography Analysis
Egypt commanded 43.5% of Africa orange market share in 2025, with output of about 3.7 million metric tons and exports above 1.8 million metric tons. Alternate-bearing and heatwave stress trimmed 2024/25 yields by (10–15%), yet drip-irrigation upgrades and a USD 300 million processing complex in Sadat City will absorb more Valencia flow, easing export price swings. Export incentives are tapering, prioritizing quality over volume, an approach that aligns with premium market expectations and sustains Egypt’s anchor role in the Africa orange market[3].
Morocco is the fastest-growing geography at 6.8% CAGR through 2031, propelled by Souss-Massa irrigation expansion, MAD 1,000 (USD 100) per metric tons export subsidies, and Valencia Late cultivation aimed at the European shoulder season. Production reached 960,000 metric tons in 2024/25, up 17% year on year, though water scarcity remains a structural threat. Solar farms, desalination, and wastewater projects are cushioning the effects of drought and ensuring that Africa's orange market supply from Morocco maintains quality standards even in dry years.
South Africa faces infrastructure challenges, but continues to be a major global citrus exporter. Hapag-Lloyd's service expansion at Cape Town aims to reduce berthing times, while bilateral agreements with Vietnam and China help mitigate destination risks. The proposed hydrogen bunkering at Port Elizabeth has the potential to reduce reefer emissions, supporting exporters in complying with the upcoming Europe Union Carbon Border Adjustment Mechanisms (CBAMs).
Regulatory Landscape
Africa orange trade is shaped by tightening sanitary and phytosanitary (SPS) compliance requirements in destination markets and a parallel push for regional alignment to support intra-African flows. In South Africa, citrus exports operate under the Agricultural Product Standards Act, 1990 (Act 119 of 1990), with the Department of Agriculture, Land Reform and Rural Development (DALRRD) and the National Plant Protection Organisation of South Africa (NPPOZA) overseeing phytosanitary controls; exporters register production units and packhouses annually and manage market-specific requirements through the PhytClean digital system.
Phytosanitary risk management remains a binding constraint for high-value export channels, particularly around False Codling Moth (FCM) and Citrus Black Spot (CBS) systems approaches and documentation for the European Union and selected Asian markets. At the continental level, the African Union Sanitary and Phytosanitary (SPS) Policy Framework provides a roadmap for harmonizing food safety and plant health measures across Regional Economic Communities, complementing trade facilitation efforts linked to AfCFTA and reducing frictions for compliant exporters and organized grower groups.
Value Chain Analysis
The Africa orange value chain runs from input supply (nurseries, irrigation equipment, crop protection and fertilizers) through orchard production, harvest, grading, packing, cold storage, and onward movement into fresh export channels, modern retail, and processing. On-farm upgrades in drip irrigation and varietal selection help deliver export sizing and consistency in key origins such as Egypt and Morocco, while aggregation and exporter-led technical support remain important for smallholders seeking entry into certification-led procurement systems used by supermarket chains.
Midstream and downstream performance increasingly hinges on cold-chain reliability, port and shipping capacity, and phytosanitary documentation discipline. In South Africa, compliance execution (packhouse registration, traceability, and market-specific inspections) and logistics constraints (port congestion, power-supply volatility for reefer handling) can determine whether fruit clears premium destinations or gets diverted to less restrictive markets. The chain is also widening toward processing, with new and planned concentrate and juice-oriented investments in Egypt and other African markets functioning as an outlet when fresh-export logistics tighten or when price cycles penalize volume-first strategies.
Competitive Landscape
Three established exporters, Capespan Group, Sundays River Citrus Company, and Elwadi Export Company, control the largest share of container traffic to Europe, the Middle East, and Asia, giving the Africa orange market a moderate concentration profile. Sundays River Citrus Company, representing 120 growers, shipped 8.5 million cartons in 2025, 70% of which went offshore. Capespan’s multi-continent sourcing smooths retailer supply gaps, and its precision-agriculture support tools help growers manage fertilizer and water constraints. Elwadi specializes in high-brix Valencia loads for juice and fresh channels across the Gulf.
Elsewedy and MAFI’s USD 300 million concentrate complex marks a pivot toward value capture through processing. Digital platforms such as AWASAM are aggregating Kenyan and Tanzanian growers, providing access to European buyers and shrinking brokerage spreads. Hazard Analysis Critical Control Points (HACCP) certifications have become baseline entry tickets, compelling mid-tier producers to invest in traceability and cold-chain upgrades. The Africa orange industry is also witnessing rising solar adoption at packhouses, pairing carbon reduction with energy security and sharpening competitive differentiation.
Intra-African trade remains under-exploited, the African Continental Free Trade Area could unlock non-tariff savings and encourage varietal specialization. Smaller cooperatives in Ethiopia and Nigeria are leveraging donor-funded irrigation and certification projects to break into regional supermarket chains, introducing fresh competition at the lower end of the Africa orange market.
Market Opportunities and Future Outlook
Processing-led value capture stands out across multiple African origins, supported by packhouse and factory investments that reduce post-harvest losses and diversify monetization beyond fresh exports. Egypts expansion plans for orange processing capacity, alongside large-scale concentrate investments such as the USD 300 million processing complex in Sadat City, indicate a more balanced pathway for Valencia-dominant supply when shipping disruptions or destination-market volatility constrain fresh programs.
Market access and compliance capacity building also create tangible commercial opportunities across the region. South Africas use of export levies and industry programs to fund research, development, and market access, together with initiatives such as CGA and the Eastern Cape Development Corporation supporting export readiness among black citrus farmers, expands the pool of compliant suppliers that can serve modern retail and export specifications. In parallel, diversified export corridors are opening via updated China-facing cold-treatment and plant health protocols, while investments in packhouses and export-oriented processing in Kenya, Nigeria, and South Africa point to a broader set of origins participating in higher-value, standards-driven citrus trade.
Recent Industry Developments
- July 2026: Tiger Brands announced it sourced 100% of the oranges used for its Oros beverage products from South African growers for a second consecutive season. The move strengthens domestic offtake for growers and supports tighter integration between local orchards and beverage manufacturing supply chains.
- April 2026: South Africas Department of Agriculture, Land Reform and Rural Development and the Citrus Growers Association of Southern Africa amended the plant health protocol for citrus exports to China, introducing new pest risk mitigation options. The protocol update helps reduce rejection risk and widens market-access flexibility for exporters seeking to diversify beyond Europe.
- June 2025: The FAO and the International Plant Protection Convention, together with South Africas Department of Agriculture, launched phase two of the Africa Phytosanitary Programme (APP) with a focus that includes citrus. The program uses digital tools to strengthen phytosanitary capacity, supporting smoother cross-border movement and improved compliance outcomes for export-oriented value chains.
Research Methodology Framework and Report Scope
Market Definition and Coverage
The market is defined as the value generated from oranges supplied across Africa, covering fresh trade as well as volumes directed into processing and juice channels, measured at prevailing prices and converted to USD for comparability.
Scope exclusions: This sizing does not count downstream retail margins, in-country logistics markups, or value-added orange-derived products beyond primary orange fruit trade.
Segmentation Overview
- By Geography
- Egypt
- Production Analysis
- Production Volume
- Area Harvested and Yield
- Consumption Analysis (Value and Volume)
- Trade Analysis (Value and Volume)
- Import Market Analysis
- Import Value and Volume
- Key Supplying Markets
- Export Market Analysis
- Export Value and Volume
- Key Destination Markets
- Import Market Analysis
- Wholesale Price Trend Analysis and Forecast
- Regulatory Framework
- Logistic and Infrastructure
- Seasonality Analysis
- Production Analysis
- Morocco
- Production Analysis
- Production Volume
- Area Harvested and Yield
- Consumption Analysis (Value and Volume)
- Trade Analysis (Value and Volume)
- Import Market Analysis
- Import Value and Volume
- Key Supplying Markets
- Export Market Analysis
- Export Value and Volume
- Key Destination Markets
- Import Market Analysis
- Wholesale Price Trend Analysis and Forecast
- Regulatory Framework
- Logistic and Infrastructure
- Seasonality Analysis
- Production Analysis
- South Africa
- Production Analysis
- Production Volume
- Area Harvested and Yield
- Consumption Analysis (Value and Volume)
- Trade Analysis (Value and Volume)
- Import Market Analysis
- Import Value and Volume
- Key Supplying Markets
- Export Market Analysis
- Export Value and Volume
- Key Destination Markets
- Import Market Analysis
- Wholesale Price Trend Analysis and Forecast
- Regulatory Framework
- Logistic and Infrastructure
- Seasonality Analysis
- Production Analysis
- Egypt
Data Sources, Market Sizing, and Validation
Desk Research
Desk work started with building the supply and demand picture using public agriculture and trade datasets, and then aligning definitions before any calculations were locked. Sources used included FAOSTAT for production and yield series, UN Comtrade for import and export values and volumes, World Bank macro indicators for currency and inflation context, and national agriculture ministries and statistical offices for country crop updates.
We also reviewed customs and port updates, association and exporter board releases, and company filings and investor presentations from the value chain to understand pricing behavior and route-to-market changes. Where needed, we referenced approved paid subscriptions for company financial intelligence, patent lookups on citrus varieties and post-harvest handling, and an import-export shipment-level view to sanity check trade flows. These examples are illustrative, and many other sources were used to collect data, validate it, and clarify open questions during analysis.
Primary Interviews and Surveys
Primary work was used to pressure test production seasonality, packhouse throughput, typical price bands, and the split between fresh export, domestic fresh, and processing demand. We spoke with growers, traders, exporters, processors, and large buyers across key producing and trading corridors so the assumptions from desk research could be corrected, and then tied back to observable signals such as crop conditions and trade movements.
Distribution of primary research fieldwork respondents
| Company type | Respondent position |
|---|---|
| Top tier: 30% | CXOs: 14% |
| Mid tier: 51% | Functional/Unit leaders: 39% |
| Smaller Players: 19% | Managers: 47% |
Market-Sizing & Forecasting
Sizing was built mainly using a top-down reconstruction where production, imports, exports, and estimated domestic utilization are brought into one consistent balance, and then translated into value using observable wholesale price trends. Once totals were formed, they were corroborated with selective bottom-up checks, such as sampled country volumes multiplied by typical price bands, and channel checks on what share is realistically absorbed by fresh versus processing.
Inputs that mattered most were harvested area and yield trends, exportable surplus versus domestic absorption, export and import unit values, wholesale price direction by season, and the share of Valencia-linked flows into juice processing alongside fresh export dynamics. Forecasts were prepared using scenario analysis anchored on expected orchard productivity, normal weather ranges, and trade policy continuity, and then adjusted where interviews signaled likely shifts in processing pull or export constraints. When a country lacked clean pricing or trade detail, proxy prices from nearby markets and regional unit value ranges were applied, then re-checked with expert feedback.
Data Validation & Update Cycle
Outputs were cross-checked against independent signals such as reported trade balances, typical packhouse capacity utilization ranges, and year-to-year price movement logic, and then reviewed for spikes that did not match known crop or trade events. Where variances were large, the underlying drivers were revisited and respondents were re-contacted to confirm whether the change came from volume, price, or a definition mismatch.
Before sign-off, a second analyst review is completed so the assumptions and calculations remain traceable and consistent across countries and years. The report is refreshed annually, and interim updates are made when material events occur, such as sharp price shocks, severe weather impacts, or major trade restrictions. Right before delivery, we run a final pass to ensure the latest public releases and trade prints are reflected in the view clients receive.
Mordor Intelligence's Africa Orange Market Sizing Compared With Other Published Estimates
Published market values for Africa oranges often do not match because each publisher chooses a different pricing point, geography set, and coverage of fresh versus processing-linked flows. Differences also show up when trade is treated as consumption, when currency timing is inconsistent, or when updates are not aligned to the latest crop and export signals.
The main gap comes from mixing wholesale consumption valuation with trade-weighted market value, where Mordor Intelligence counts Africa-level oranges through a production plus net-trade balance and then applies validated wholesale price trends rather than retail-facing value add. Some estimates also expand scope to include the wider Middle East region or fold in processed culinary uses, and then apply aggressive price escalation assumptions without checking unit values against recent import-export prints.
Benchmark comparison
| Source | Market Size | Gaps in Research Methodology |
|---|---|---|
| Mordor Intelligence | USD 1.51 B (2025) | |
| Trade Data Publisher A | USD 7.20 B (2024) | Values the market at nominal wholesale consumption revenue and treats the total demand pool as the market, which can inflate the figure versus a trade-balanced value view and may not align to the same price point or channel mix. |
| Global Databook B | USD 3.17 B (2024) | Uses Middle East and Africa as the geography, and the visible segmentation points to fresh oranges only, so the scope and regional mix differ from an Africa-only model that also tracks processing pull and validates price trends with local checks. |
The spread is largely explained by what gets counted as the market, which prices are used, and whether the geography is strictly Africa or a wider regional bundle. By tying totals back to production, trade, and observed unit values, the approach stays repeatable and easier to audit year over year, even when some countries have patchy public disclosure.
Key Questions Answered in the Report
How large is the Africa orange market in 2026?
Africa orange market reached USD 1.57 billion 2026 to reach USD 1.81 billion by 2031, at a CAGR of 4.97% during the forecast period (2026-2031).
Which variety accounts for the largest share of African orange sales?
Valencia oranges led with 37.8% share in 2025, serving both fresh and juice channels.
Which country is growing fastest in African orange production?
Morocco is advancing at a 6.8% CAGR through 2031, supported by irrigation and subsidies.
How are supermarkets influencing African orange distribution?
Modern Retail channels are gaining share at 6.8% CAGR as urban consumers favor certified, pre-packed fruit.
What is a major threat to long-term South African orange exports?
The spread of citrus greening from Limpopo into Mpumalanga endangers yield stability and could trim exports by up to 20% over the next decade.