
Market Overview
| Study Period | 2021 - 2031 |
|---|---|
| Forecast Data Period | 2026 - 2031 |
| Base Year Market Size (2025) | USD 12.13 Billion |
| Market Size (2026) | USD 13.2 Billion |
| Market Size (2031) | USD 20.15 Billion |
| Growth Rate (2026 - 2031) | 8.83 % |
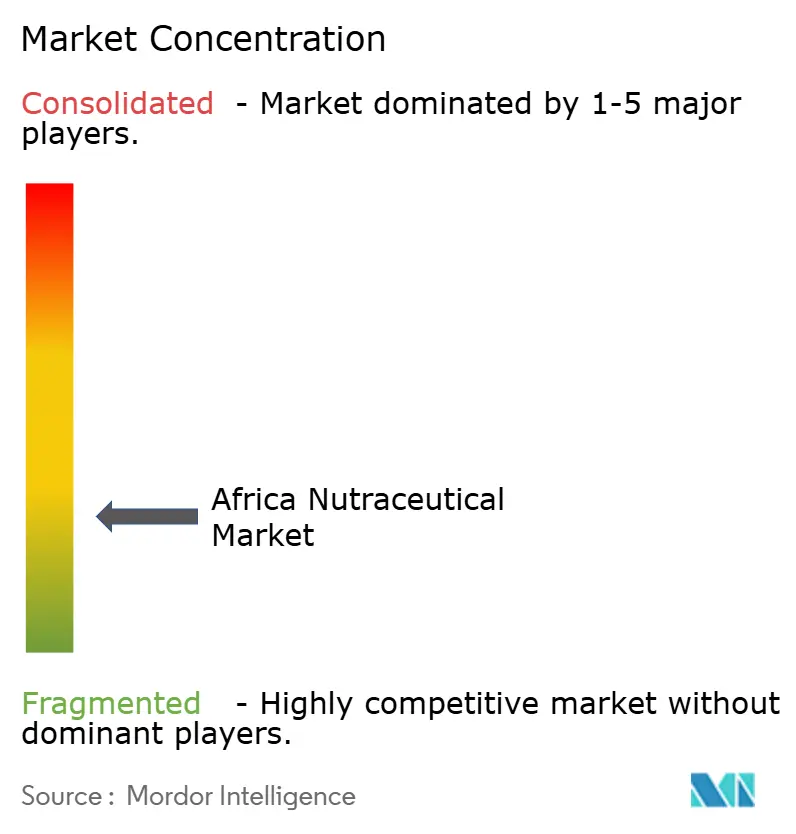
| Market Concentration | Low |
Major Players *Disclaimer: Major Players sorted in no particular order Image © Mordor Intelligence. Reuse requires attribution under CC BY 4.0. | |
Africa Nutraceutical Market Analysis by Mordor Intelligence
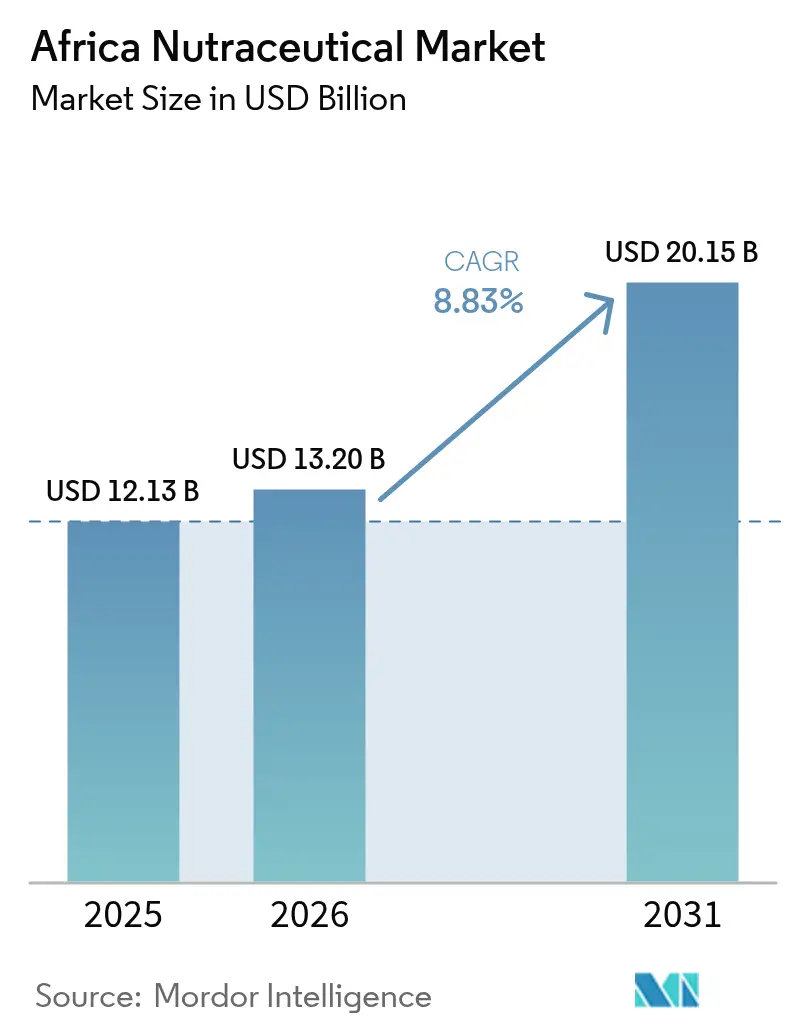
African nutraceuticals market size in 2026 is estimated at USD 13.2 billion, growing from 2025 value of USD 12.13 billion with 2031 projections showing USD 20.15 billion, growing at 8.83% CAGR over 2026-2031. Robust expansion in the African nutraceuticals market flows from rapid urbanization, higher disposable incomes, and persistent public-health campaigns that elevate the role of preventive nutrition. Functional beverages anchor demand as consumers favor convenient formats that slot seamlessly into busy city lifestyles, while dietary supplements accelerate on the back of condition-specific needs such as metabolic health, weight control, and immune support. The African nutraceuticals market also benefits from a favorable demographic structure: a growing elderly cohort now prioritizes healthy aging, and a youthful, tech-savvy population embraces digitally amplified wellness messages that normalize supplement use. Meanwhile, multinational brand entry intensifies competition yet raises quality benchmarks, helping the African nutraceuticals market capture previously underserved geographies through modern retail and e-commerce ecosystems.
Key Report Takeaways
- By product type, functional beverages led with 38.18% African nutraceuticals market share in 2025; dietary supplements are forecast to expand at a 12.12% CAGR through 2031.
- By function, general health products accounted for a 32.18% share of the African nutraceuticals market size in 2025, while weight-management lines are poised to grow at a 10.19% CAGR to 2031.
- By end user, adults commanded 56.18% of the African nutraceuticals market share in 2025; the same group is projected to post an 11.38% CAGR over the outlook window.
- By distribution channel, supermarkets and hypermarkets contributed 41.85% of the African nutraceuticals market in 2025, yet online retail is advancing at a 10.29% CAGR as logistics and digital payments scale.
- By geography, South Africa secured a 35.80% market share in 2025, whereas Nigeria exhibits the fastest expansion at an 10.82% CAGR through 2031.
Note: Market size and forecast figures in this report are generated using Mordor Intelligence’s proprietary estimation framework, updated with the latest available data and insights as of 2026.
Market Trends and Insights
Drivers Impact Analysis of Africa Nutraceutical Market*
| Drivers | (~)% Impact on CAGR Forecasts | Geographic Relevance | Impact Timeline |
|---|---|---|---|
| Rising prevalence of chronic diseases such as diabetes, hypertension, obesity | +1.4% | South Africa, Nigeria, Egypt with spillover to Morocco | Medium term (2-4 years) |
| Growing health awareness and lifestyle changes promoting physical fitness | +1.1% | Urban centers across South Africa, Nigeria, Egypt | Short term (≤ 2 years) |
| Expansion of health clubs, fitness centers, and wellness programs | +0.9% | South Africa, Nigeria, Egypt metropolitan areas | Medium term (2-4 years) |
| Demand for natural and organic nutraceutical products | +0.7% | South Africa, Morocco, urban Nigeria | Long term (≥ 4 years) |
| Growing elderly population with increased focus on healthy aging | +1.0% | Global, concentrated in South Africa and North Africa | Long term (≥ 4 years) |
| Increasing availability of international nutraceutical brands | +0.8% | Nigeria, Egypt, Morocco with expansion to Rest of Africa | Short term (≤ 2 years) |
| Source: Mordor Intelligence | |||
Rising Prevalence of Chronic Diseases Drives Preventive Healthcare Adoption
The rise in non-communicable diseases across Africa is driving a shift in consumer preferences toward preventive nutrition. By 2024, diabetes prevalence in Nigeria reached 4.9%, while 46% of South African adults were affected by hypertension. This shift in health trends is creating consistent demand for functional foods and dietary supplements aimed at improving metabolic health, supporting cardiovascular function, and managing weight. WHO data shows that obesity rates in urban Africa doubled between 2010 and 2024, with significant increases among women—68% in South Africa and 35% in urban Nigeria. This rise in obesity has led to increased consumption of targeted nutraceuticals, as reported by the WHO Global Health Observatory[1]. The annual economic cost of treating diabetes and hypertension in sub-Saharan Africa is estimated at USD 25 billion, encouraging governments to adopt preventive nutrition policies. Healthcare systems are increasingly recognizing the cost-effectiveness of nutraceuticals, with South Africa's National Department of Health incorporating functional foods into dietary guidelines for chronic disease management. These endorsements from the medical community are boosting the credibility of nutraceuticals, particularly among older adults who have traditionally relied on pharmaceutical treatments.
Health Awareness and Lifestyle Changes Accelerate Urban Market Penetration
Digital health campaigns and social media influence fundamentally alter African consumer perceptions of nutrition, with smartphone penetration reaching 84% in South Africa and 51% in Nigeria by 2024, enabling widespread health information dissemination. Urban millennials and Generation Z consumers increasingly prioritize wellness over traditional status symbols, driving demand for premium functional beverages and sports nutrition products that signal health-conscious lifestyles. Fitness influencer culture, particularly strong in South Africa and Nigeria, normalizes supplement consumption among younger demographics who previously viewed such products as unnecessary. Corporate wellness programs in major cities increasingly include nutraceutical benefits, with companies like MTN and Standard Bank providing health allowances that employees use for functional foods and dietary supplements, creating institutional demand channels beyond individual consumer purchases.
Expansion of Health Clubs and Wellness Programs Creates Distribution Synergies
The rapid growth of the fitness industry in African urban centers is driving increased demand for sports nutrition and performance-enhancing nutraceuticals. Kenya's fitness sector alone is expected to reach KSh 5 billion by 2024. Health clubs are key venues for product education and trials, offering personalized nutrition guidance that encourages supplement use beyond gym settings. In South Africa, particularly in the mining and financial services sectors, companies are incorporating nutraceutical allowances into corporate wellness programs to promote employee health, reduce absenteeism, and lower healthcare costs. The emergence of boutique fitness concepts—such as yoga studios, CrossFit boxes, and specialized training facilities—has created niche distribution channels for premium functional foods and targeted supplements, which traditional retail struggles to serve effectively. Additionally, partnerships between nutraceutical brands and fitness operators are becoming more common. These collaborations utilize workout data and performance metrics to provide tailored nutritional recommendations, delivering personalized consumer experiences that foster brand loyalty and drive repeat purchases.
Demand for Natural and Organic Products Reflects Cultural Values Integration
African consumers are increasingly opting for nutraceuticals that incorporate indigenous botanicals and traditional ingredients. This shift creates opportunities for products that combine modern science with cultural heritage. Ingredients such as baobab fruit, moringa, and rooibos tea are gaining international recognition for their nutritional benefits. This trend enables African companies to meet domestic demand for culturally significant ingredients while also exporting value-added products. In premium market segments, particularly in South Africa, organic certification has become a key differentiator. Consumers in this region are willing to pay 15-25% more for functional foods with certified organic labels. The clean label trend varies across African markets, but a shared preference for ingredient transparency and minimal processing is evident. Consumers often disregard complex nutritional claims that do not align with local food traditions. Multinational corporations like Nestlé are driving local sourcing initiatives, creating supply chain opportunities for African farmers. These initiatives align with consumer preferences for regionally sourced ingredients, though ensuring quality standardization remains a challenge across Africa's diverse agricultural systems.
Restraints Impact Analysis of Africa Nutraceutical Market*
| Restraints | (~)% Impact on CAGR Forecasts | Geographic Relevance | Impact Timeline |
|---|---|---|---|
| Limited availability of high-quality raw materials locally | -0.6% | Rest of Africa, rural areas across all regions | Long term (≥ 4 years) |
| Economic volatility and purchasing power disparity across regions | -0.7% | Nigeria, Rest of Africa with moderate impact in Egypt, Morocco | Short term (≤ 2 years) |
| Cultural preferences and reliance on traditional medicine | -0.5% | Rural areas across all regions, traditional communities | Long term (≥ 4 years) |
| Counterfeit products and quality control issues | -0.4% | Nigeria, Rest of Africa, informal distribution channels | Medium term (2-4 years) |
| Source: Mordor Intelligence | |||
Economic Volatility Constrains Market Expansion Across Key Geographies
In 2024, Nigeria's naira depreciated by 68% against the USD, reducing the affordability of nutraceuticals. This currency devaluation forced Nigerian consumers to focus on essential goods rather than discretionary health products. Variations in purchasing power have created a distinct market divide: premium functional beverages are accessible to affluent urban consumers, while basic vitamin supplements face challenges in gaining adoption in rural areas with limited disposable income. Although health awareness is increasing, inflation rates exceeding 20% in several African countries in 2024 constrained middle-class spending on non-essential items, including nutraceuticals, as highlighted in the World Bank's Africa Economic Update[2]. The market's dependence on imports exposes it to foreign exchange volatility, as most raw materials and finished products require hard currency, which becomes significantly more expensive during currency crises. Economic instability has led companies to implement frequent price changes, causing consumer confusion and weakening brand loyalty. Meanwhile, retailers struggle with inventory management due to unpredictable cost fluctuations.
Cultural Preferences for Traditional Medicine Limit Modern Nutraceutical Adoption
Traditional healing systems maintain strong cultural legitimacy across African societies, with WHO estimates indicating that 80% of the population relies on traditional medicine for primary healthcare needs, creating resistance to modern nutraceutical alternatives. Older generations often view synthetic vitamins and processed functional foods with suspicion, preferring herbal remedies and traditional dietary practices that have been passed down through generations. The integration challenge becomes particularly acute in rural areas where traditional healers hold significant social influence and may actively discourage the use of modern nutritional supplements. Language barriers compound adoption challenges, as product labeling and marketing materials often fail to effectively communicate benefits in local languages or cultural contexts that resonate with diverse African communities. Religious and cultural beliefs about food purity and natural healing create additional barriers for certain nutraceutical categories, particularly those containing synthetic ingredients or animal-derived components that conflict with dietary restrictions or spiritual practices.
*Our forecasts treat driver/restraint impacts as directional, not additive. The impact forecasts reflect baseline growth, mix effects, and variable interactions.
Africa Nutraceutical Market Segment Analysis
By Product Type:
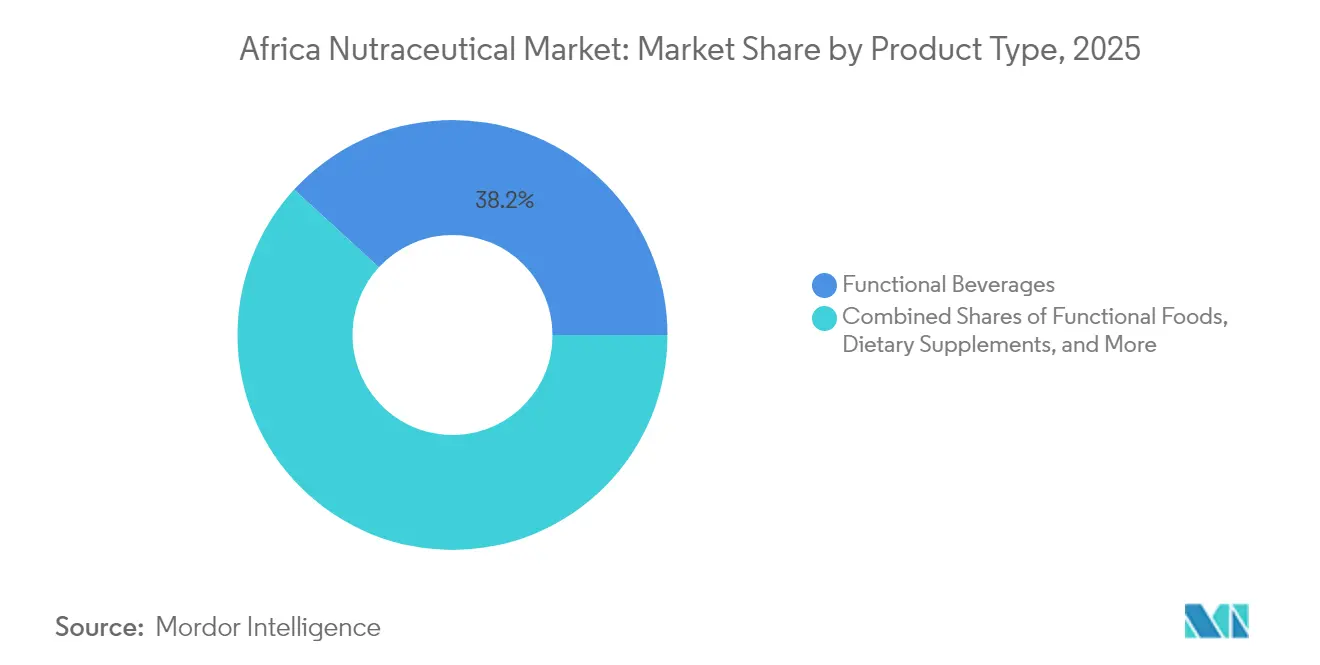
Beverages Lead While Supplements SurgeIn 2025, functional beverages hold a 38.18% market share, highlighting a consumer preference for convenient, ready-to-consume nutrition solutions that align with fast-paced urban lifestyles. Energy drinks and fortified juices appeal strongly to younger consumers, who associate these products with improved performance and enhanced social status. Dietary supplements represent the fastest-growing segment, with a projected 12.12% CAGR through 2031. This growth is driven by increasing health awareness and a focus on nutritional solutions for specific health conditions, such as diabetes management and immune system support. Vitamins and minerals dominate supplement demand, followed by botanical extracts featuring traditional African ingredients like baobab and moringa.
Functional foods, including cereals, dairy, and snacks, are securing a significant market share by providing nutritional benefits that go beyond basic sustenance. Nestlé's expansion of fortified cereals into African markets underscores the category's growing potential. At the same time, local companies are leveraging this opportunity by developing products with indigenous grains and nutrients. Additionally, regulatory bodies such as SAHPRA and NAFDAC are increasingly recognizing functional food categories, streamlining pathways for product approvals and marketing claims, which further supports the category's growth.

By Function:
General Health Dominates as Weight Management AcceleratesGeneral health applications command 32.18% market share in 2025, encompassing broad-spectrum multivitamins and general wellness products that appeal to consumers seeking comprehensive nutritional support. This category's dominance reflects African consumers' preference for holistic health approaches rather than targeted interventions for specific conditions. Weight management emerges as the fastest-growing function at 10.19% CAGR, driven by rising obesity rates and increasing awareness of metabolic health risks across urban populations.
Sports nutrition and performance applications gain traction among fitness enthusiasts, particularly in South Africa's well-developed gym culture and Nigeria's growing fitness industry. Immunity and digestive health functions maintain steady growth, supported by post-COVID health consciousness and traditional African emphasis on gut health through fermented foods and probiotics. Women's health represents a specialized but growing segment, addressing unique nutritional needs during pregnancy, lactation, and menopause that traditional diets may not adequately support.
By End User:
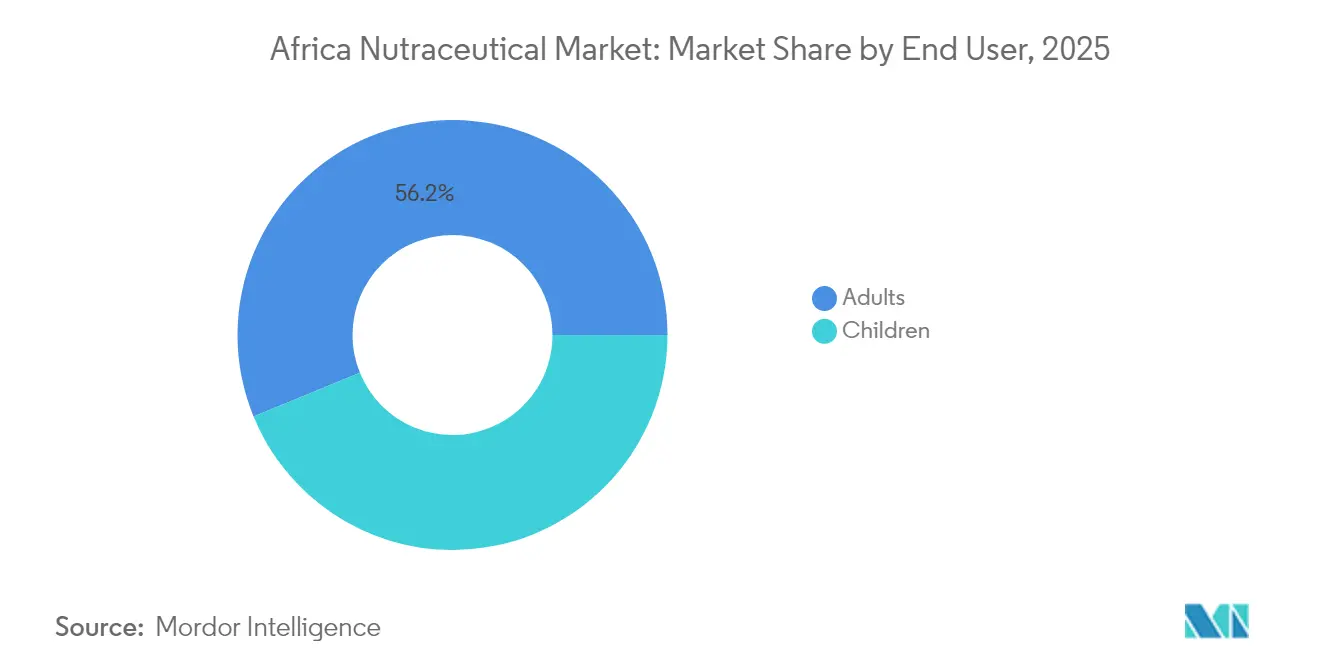
Adult Focus Reflects Demographic RealityAdults represent 56.18% of market consumption in 2025 and maintain the highest growth rate at 11.38% CAGR through 2031, reflecting the demographic reality of Africa's aging population and increasing adult health consciousness. Working-age adults, particularly those aged 25-45, drive demand for functional beverages and dietary supplements that support busy lifestyles and chronic disease prevention. This segment's purchasing power and health awareness create the most attractive market opportunity for premium nutraceutical products.
Children's nutraceuticals face cultural barriers as parents often prefer traditional feeding practices and express concern about synthetic additives in children's products. However, urbanization and exposure to global nutrition trends gradually increase acceptance of fortified foods and children's vitamins, particularly among educated, middle-class families. The adult segment's dominance also reflects economic realities, as adults control household purchasing decisions and prioritize their own health needs when resources are constrained.
By Distribution Channels:
Traditional Retail Leads as Digital Channels EmergeSupermarkets and hypermarkets control 41.85% of distribution in 2025, leveraging their established presence in urban centers and ability to offer diverse product ranges with competitive pricing. These channels provide crucial product visibility and consumer education through in-store demonstrations and promotional activities that build brand awareness. Online retail channels demonstrate the highest growth at 10.29% CAGR, driven by smartphone adoption, improved logistics infrastructure, and COVID-19-accelerated e-commerce habits.
Drug stores and pharmacies maintain important market positions by providing professional consultation and targeting health-conscious consumers who view these channels as more credible for nutritional products. Convenience stores capture impulse purchases and serve consumers seeking immediate access to functional beverages and basic supplements. The channel landscape varies significantly by geography, with South Africa's mature retail infrastructure supporting diverse distribution options while Nigeria and other markets rely more heavily on traditional trade and informal channels that remain difficult for international brands to penetrate effectively.
Geography Analysis
South Africa Nutraceutical Market
In 2025, South Africa commands a 35.80% market share, driven by its advanced retail infrastructure, regulatory frameworks established by SAHPRA, and the continent's highest per-capita income levels, which support premium product consumption. The country's well-established healthcare system and widespread English literacy improve consumer awareness of nutraceutical benefits. Robust distribution networks ensure product availability in urban and semi-urban areas. Leading retailers, such as Pick n Pay and Woolworths, allocate significant shelf space to both international and local nutraceutical brands, fostering competitive dynamics that result in better pricing and innovative products for consumers.
Nigeria Nutraceutical Market
Nigeria is the fastest-growing market, with an anticipated 10.82% CAGR through 2031. This growth is fueled by Nigeria's position as Africa's most populous country, a growing middle class, and increasing urbanization rates, all of which drive demand for nutraceuticals. With 70% of its population under 30, Nigeria's youthful demographic increasingly embraces preventive healthcare and fitness trends, aligning with global patterns. However, economic instability and currency devaluation, including the naira's 68% depreciation in 2024, significantly impact import-dependent product pricing, according to the Central Bank of Nigeria. While NAFDAC's regulatory oversight ensures product quality, it also causes delays in the approval of new products.
Africa Nutraceutical Market
Egypt and Morocco are important secondary markets, shaped by their Mediterranean influences and strong pharmaceutical industries that support nutraceutical development. Egypt's large population and government health initiatives create significant market opportunities. Morocco, on the other hand, benefits from its proximity to Europe, which facilitates access to international products and regulatory standards. The "Rest of Africa" category includes diverse markets with varying levels of development. Countries like Ghana and Kenya demonstrate relative stability, while others face infrastructure challenges but hold long-term potential as economic conditions improve.
Regulatory Landscape
Regulation of nutraceuticals and food/dietary supplements across Africa remains country-specific, with product registration and labeling/claim compliance handled by national authorities such as NAFDAC (Nigeria), SAHPRA (South Africa), the Pharmacy and Poisons Board (Kenya), Rwanda FDA, and Ghana FDA. Recent updates place greater emphasis on dossier-based registration (composition, safety, and manufacturing and quality control evidence) and on alignment with Good Manufacturing Practice expectations, while also tightening boundaries between supplements and medicines. In Nigeria, for example, the 2025 NAFDAC Dietary Supplement Regulations restrict medicinal claims and medicinal ingredients for products marketed as dietary supplements.
At the continental level, the African Medicines Agency (AMA) is an important harmonization anchor. On January 23, 2026, it assumed institutional independence through the transfer of initiatives, including African Medicines Regulatory Harmonisation (AMRH) and the AU Smart Safety Surveillance (AU-3S) program, from AUDA-NEPAD. This shift supports more structured convergence on safety oversight and cross-border regulatory cooperation, even as companies continue to manage multi-country registrations and uneven enforcement across formal retail and pharmacy channels versus informal trade, where counterfeiting and substandard products persist.
Value Chain Analysis
The Africa nutraceutical value chain runs from agricultural and botanical sourcing (including indigenous ingredients such as baobab, moringa, and rooibos) to imported inputs like vitamins, minerals, excipients, and specialized functional ingredients. It then moves through formulation and manufacturing before reaching consumers via multi-channel distribution, including supermarkets and hypermarkets, drug stores and pharmacies, convenience outlets, and online retail. Regional enablers include ingredient and premix traders such as VDB Africa and EdelSenz, plus private-label and contract manufacturing capacity from players such as AfrOganiks (West Africa) and Teleo Nutrilabs (Kenya), while distributors and service providers in hubs such as Morocco support market access and compliance execution.
Constraints cluster in upstream aggregation and logistics. Smallholder-based botanical supply is fragmented, mechanization and processing capacity are limited for consistent quality, and transport and storage gaps increase costs and weaken on-shelf availability, particularly outside major cities. At the same time, trade and compliance coordination is strengthening through frameworks such as the AfCFTA and industry bodies, including a March 2024 memorandum of understanding between UNPA and the Southern African Botanical Products Association aimed at improving compliance for regional botanical products. This reinforces traceability and documentation as scale requirements.
Competitive Landscape
The Africa nutraceuticals market exhibits fragmented competition with a concentration ratio of 3 out of 10, creating opportunities for both multinational corporations and agile local players to capture market share through differentiated strategies. Multinational companies like Nestlé, Unilever, and Danone leverage their global R&D capabilities and established distribution networks to introduce premium products, while local companies capitalize on cultural knowledge and cost advantages to serve price-sensitive segments.
Technology adoption varies significantly, with leading players implementing digital marketing strategies and e-commerce platforms to reach younger consumers, while traditional companies rely on established retail relationships and brand recognition built over decades of market presence. Strategic partnerships between international brands and local distributors become increasingly important for navigating complex regulatory environments and cultural preferences across diverse African markets.
White-space opportunities exist in specialized segments like sports nutrition, women's health, and products incorporating indigenous African ingredients that appeal to consumers seeking culturally relevant nutrition solutions. Emerging disruptors include direct-to-consumer brands leveraging social media marketing and local companies developing products with traditional African botanicals that compete effectively against international alternatives through cultural authenticity and competitive pricing.
Africa Nutraceutical Industry Leaders
-
Arla Foods
-
Red Bull Corporation
-
Nestle SA
-
Amway Corporation
-
Danone S.A.
- *Disclaimer: Major Players sorted in no particular order
Africa Nutraceutical Market Companies Covered in this Report
- Nestlé SA
- Kellogg Co.
- Arla Foods
- Amway Corp.
- Danone S.A.
- Herbalife International
- Red Bull GmbH
- GlaxoSmithKline PLC
- Coca-Cola Company
- DSM-Firmenich
- Afriplex Pty Ltd
- Real Foods Group
- BAyoba (Baobab Foods)
- GNC (General Nutrition Centers)
- Aduna Ltd
- Kuli Kuli Inc.
- Unilever Plc
- Abbott Laboratories
- Bayer AG
- Pfizer (Centrum)
- Symrise AG
Market Opportunities and Future Outlook
A primary opportunity sits at the intersection of preventive nutrition demand and tighter product governance. As countries formalize supplement registration and claims boundaries, including Nigeria's 2025 NAFDAC dietary supplement regulation framework, and as more markets publish structured registration guidance, such as Rwanda FDA's food supplement registration guidance, brands that can standardize dossiers, labeling, and quality systems can expand across multiple jurisdictions with fewer gaps between markets. Harmonization momentum also shows up in AMA's January 2026 assumption of institutional independence and program transfers (AMRH and AU-3S), which creates room for manufacturers and brand owners to build multi-country compliance capabilities instead of relying on single-market approvals.
Local and regional processing build-outs are another source of whitespace in functional beverages and fortified nutrition, since they can reduce import exposure and improve supply resilience. In Nigeria, beverage and ingredient-processing investments reported in 2026, including Ultimum Limited commissioning a beverage production plant in Aba and Bensono Fruits Processing Company Limited's fruit concentrate plant in Benue State, support more localized formulation and faster iteration cycles for fortified drinks and functional formats. Alongside this, demand for botanicals and clean-label positioning creates room for standardized, export-ready ingredient streams, particularly where industry associations are working on compliance and traceability for regional botanical products.
Recent Industry Developments in Africa Nutraceutical Market
- June 2026: Nestle Ghana added a new production line at its Tema factory as part of a manufacturing expansion aimed at increasing output and supporting exports to nearby West African markets such as Cote d'Ivoire, Burkina Faso, and Mali. The added capacity strengthens the ability to serve regional demand from a single hub, supporting faster replenishment for fortified and nutrition-adjacent product lines.
- February 2026: Arla Foods commenced production of Cool Cow Yoghurt in Kaduna, using fresh milk sourced from the local Integrated Arla-Dano farm. Localizing supply and manufacturing improves raw material security and supports more consistent availability of value-added dairy nutrition products in the Nigerian market.
- November 2025: Arla Foods launched a yoghurt factory and the Nigerian Dairy Centre of Excellence at the Integrated Arla-Dano Dairy Farm in Damau, Kaduna, Nigeria. The facility and training focus expand local processing capability and workforce skills, supporting broader development of locally produced nutrition and functional dairy offerings.
Africa Nutraceutical Market Report Scope and Research Methodology
Market Definition and Coverage
For this report, the market includes packaged nutraceutical products sold in Africa that are positioned for health benefits, across functional foods, functional beverages, and dietary supplements, and counted as manufacturer revenues within the region.
Scope exclusions: We exclude ordinary packaged foods and drinks that do not carry a functional or supplement claim, as well as prescription-only medicines.
Segments Covered in This Report
- Product Type
- Functional Food
- Cereals
- Bakery and Confectionery Products
- Dairy
- Snacks
- Other Functional Foods
- Functional Beverages
- Energy Drinks
- Sports Drinks
- Fortified Juice
- Dairy and Dairy Alternative Beverages
- Other Functional Beverages
- Dietary Supplements
- Vitamins
- Minerals
- Botanicals
- Enzymes
- Fatty Acids
- Proteins
- Other Dietary Supplements
- Functional Food
- Function
- General Health
- Weight Management
- Sports Nutrition and Performance
- Immunity and Digestive Health
- Healthy Aging
- Women's Health
- Other Applications
- End-User
- Adults
- Children
- Distribution Channels
- Supermarkets / Hypermarkets
- Convenience Stores
- Drug Stores / Pharmacies
- Online Retail Stores
- Other Channels
- Geography
- South Africa
- Nigeria
- Egypt
- Morocco
- Rest of Africa
Data Sources, Market Sizing, and Validation
Desk Research
To set the base structure of the Africa nutraceutical market, we start with public data that can anchor demand, trade, and health context. Common inputs include customs and tariff-line trade statistics, national health and nutrition surveys, food regulation guidance published by health authorities, and population and income indicators from multilateral sources such as the World Bank.
We also review publicly available documents that help with category boundaries and realistic pricing, such as listed-company annual reports, investor presentations, major retailer websites for pack sizes and price ranges, and reputable press coverage of launches and regulatory actions. Patent databases are used selectively to understand the pace of new claims and ingredients being filed, which supports our view on innovation intensity and product pipelines. The desk sources mentioned here are illustrative only, and many other public references were used to collect, cross-check, and clarify data points.
Primary Interviews and Surveys
We conduct interviews and surveys with manufacturers, distributors, retailers, nutrition specialists, and regulatory or quality professionals active in Africa. Feedback tests product mix, channel use, price movement, import dependence, and demand changes. Country-level answers fill secondary-data gaps and help triangulate assumptions before final analysis.
Distribution of primary research fieldwork respondents
| Company type | Respondent position |
|---|---|
| Top tier: 28% | CXOs: 15% |
| Mid tier: 47% | Functional/Unit leaders: 35% |
| Smaller Players: 25% | Managers: 50% |
Market-Sizing & Forecasting
Sizing begins with a top-down build that reconstructs the Africa demand pool using category-level consumption signals and trade flows, which are then shaped by how nutraceutical products are labeled and sold in the region. After that, the totals are checked with selective bottom-up approximations, like sampled shelf price points multiplied by reasonable category volumes, and supplier and distributor roll-ups from interviews, before the final numbers are adjusted.
Key inputs that most often move the model include the share of supplements within total nutraceutical spend, the split of sales between supermarkets and hypermarkets versus pharmacies and online retail, pack-size and price architecture by product form, and the adoption rate of immunity, digestive health, and sports nutrition claims. Since data coverage differs by country, gaps are handled using proxy markets, consistent conversion factors, and interview-based guardrails so the Africa total stays realistic.
For forecasting, we mainly rely on scenario analysis because macro conditions and regulation shifts can change category growth quickly, and then we align each scenario with expert expectations on pricing, channel expansion, and health awareness trends. Where stable time series exist, simple smoothing is used as a secondary check so the year-to-year curve does not jump without a clear reason.
Data Validation & Update Cycle
Validation is done by comparing the modeled totals with independent signals such as category growth in modern trade, shifts in import intensity for key ingredients, and the implied per-capita spend level by country group. When a variance looks high, the assumptions are re-opened and a follow-up is triggered with respondents who are closest to pricing, channel margins, and category volumes.
Before sign-off, the work is reviewed in steps so calculation logic, definitions, and unit conversions are consistent across countries and product types. Reports are refreshed each year, with interim updates when major events occur, and a final pre-delivery check is completed so clients receive the most current view available.
Mordor Intelligence's Africa Nutraceutical Market Size Compared Against Other Published Estimates
Published market sizes for Africa nutraceuticals can differ even when they look like they cover the same topic, because the product boundaries, base year, and currency handling are not always aligned. Differences also come from how firms treat functional foods and beverages versus supplements, and whether the model is anchored to a demand pool or mainly projected from high-level growth rates.
The main gap comes from what gets counted inside nutraceuticals, where Mordor Intelligence includes functional foods and functional beverages alongside dietary supplements, and then keeps the total in check using channel mix and pack-price logic by country rather than one uniform regional growth curve.
Benchmark comparison
| Source | Market Size | Gaps in Research Methodology |
|---|---|---|
| Mordor Intelligence | USD 12.13 B (2025) | |
| Market Marketplace A | USD 11.10 B (2024) | Uses a different base year and may apply a shorter historical window, which can change the starting level when inflation and currency conversion timing are not treated consistently across African countries. |
| Global Consultancy B | USD 16.60 B (2024) | Covers a wider geography (Middle East plus Africa), so the total is not comparable to an Africa-only figure and can also embed different assumptions on category inclusion and pricing averages. |
The spread across the table is largely explained by geography coverage, year selection, and what is included inside the nutraceutical label. By keeping the scope Africa-only and tying totals to observable signals like channel split and realistic price points, the estimate stays traceable to inputs that can be re-checked and updated over time.
Key Questions Answered in the Report
How large is the Africa nutraceuticals market in 2026?
It generated USD 13.2 billion in 2026 and is tracking a 8.83% CAGR toward USD 20.15 billion by 2031.
Which product line leads sales?
Functional beverages command 38.18% share, reflecting widespread preference for ready-to-drink nutrition.
Which country grows fastest?
Nigeria expands at an 10.82% CAGR owing to its large, youthful population and burgeoning middle class.
Why are weight-management products booming?
Rising obesity—32% in South Africa and 15% in Nigeria—fuels 10.19% CAGR in weight-control nutraceuticals.