
Market Overview
| Study Period | 2020 - 2031 |
|---|---|
| Forecast Data Period | 2026 - 2031 |
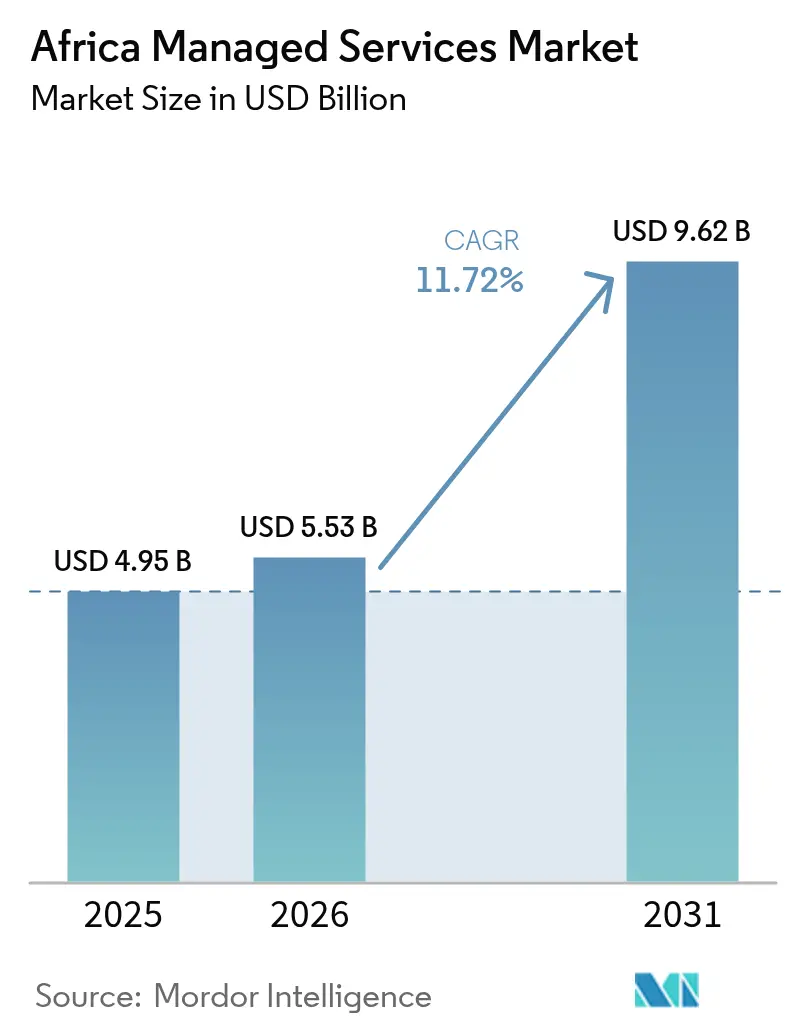
| Base Year Market Size (2025) | USD 4.95 Billion |
| Market Size (2026) | USD 5.53 Billion |
| Market Size (2031) | USD 9.62 Billion |
| Growth Rate (2026 - 2031) | 11.72% CAGR |
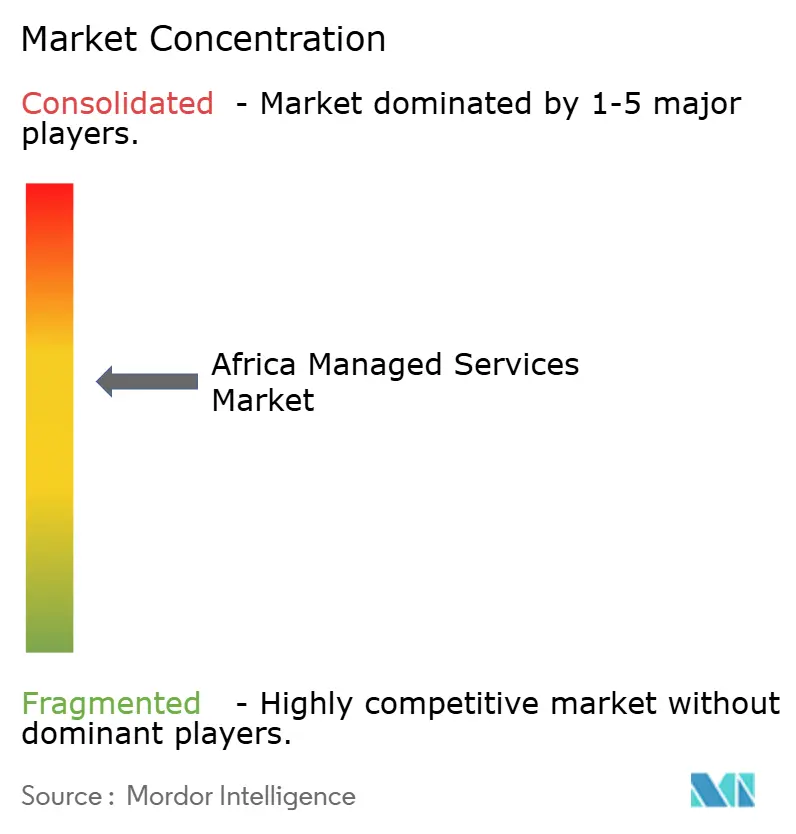
| Market Concentration | Medium |
Major Players *Disclaimer: Major Players sorted in no particular order Image © Mordor Intelligence. Reuse requires attribution under CC BY 4.0. | |
Africa Managed Services Market Analysis by Mordor Intelligence
The Africa managed services market size was valued at USD 4.95 billion in 2025 and estimated to grow from USD 5.53 billion in 2026 to reach USD 9.62 billion by 2031, at a CAGR of 11.72% during the forecast period (2026-2031). Sustained expansion rests on sovereign data-residency rules, fast-growing pan-African fibre routes and an accelerating shift from capital expenditure to subscription-based IT procurement. Currency volatility simultaneously restrains new infrastructure outlays yet strengthens the business case for outsourcing as organisations limit balance-sheet risk. Intensifying cyber-crime that costs the continent nearly 10% of GDP each year further propels managed security spending. Competition remains active, with hyperscalers, regional telcos and specialist providers all seeking scale advantages across multiple high-growth verticals and underserved geographic niches.
Key Report Takeaways
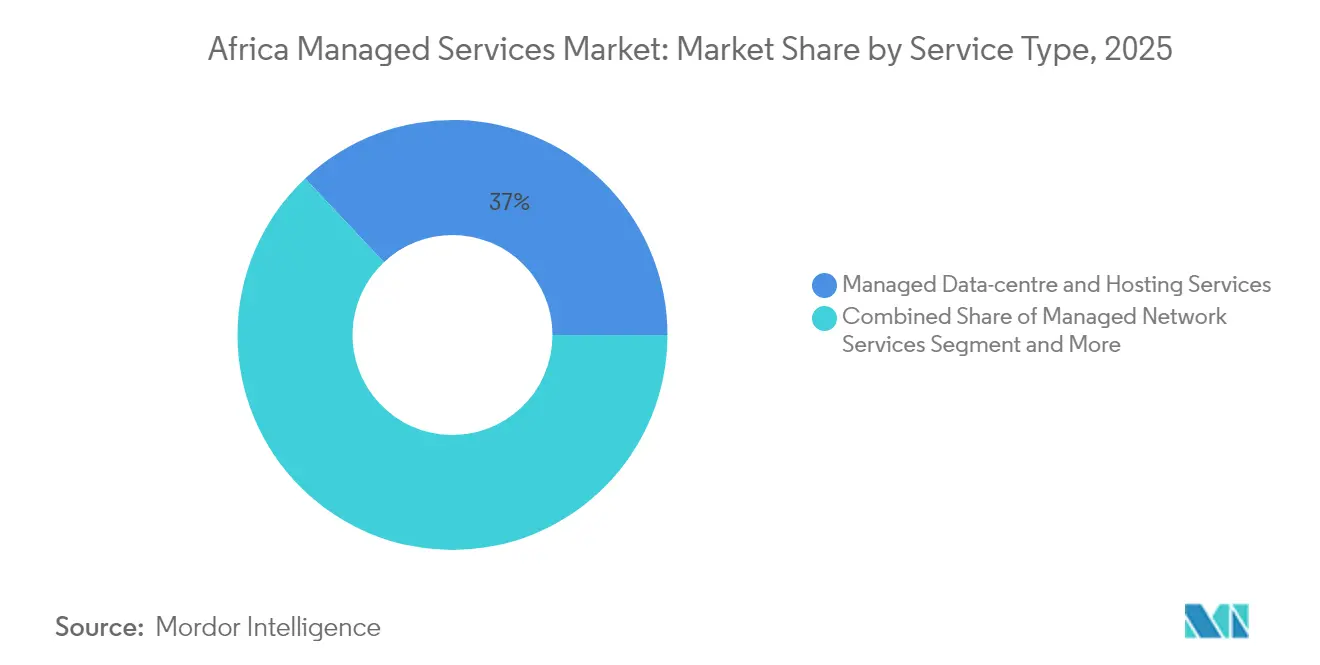
- By service type, managed data-centre and hosting services led with 37.02% of Africa managed services market share in 2025, while managed security services are advancing at a 12.28% CAGR through 2031.
- By deployment model, the public-cloud segment held a 76.65% share of Africa managed services market size in 2025 and is expanding at a 12.75% CAGR to 2031.
- By organisation size, SMEs captured 55.72% of Africa managed services market size in 2025; the segment is growing at 11.84% CAGR to 2031.
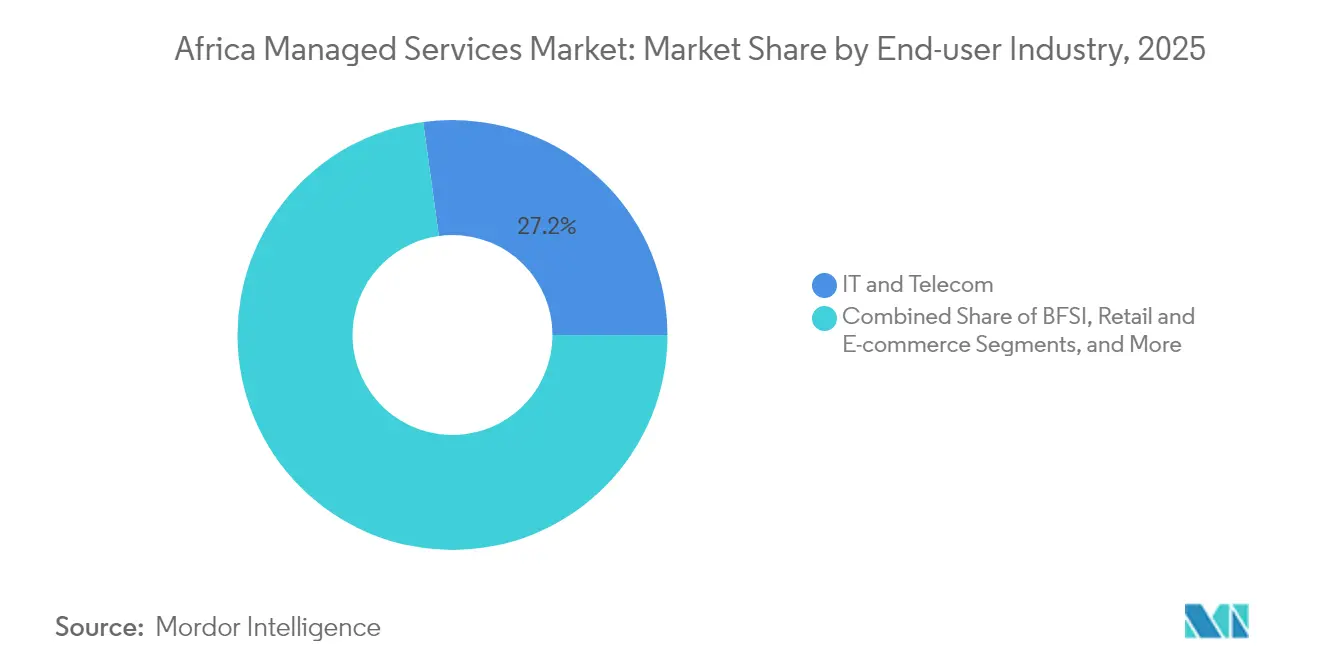
- By end-user industry, IT and telecommunications accounted for 27.18% revenue in 2025, whereas healthcare is set to grow fastest at 12.33% CAGR to 2031.
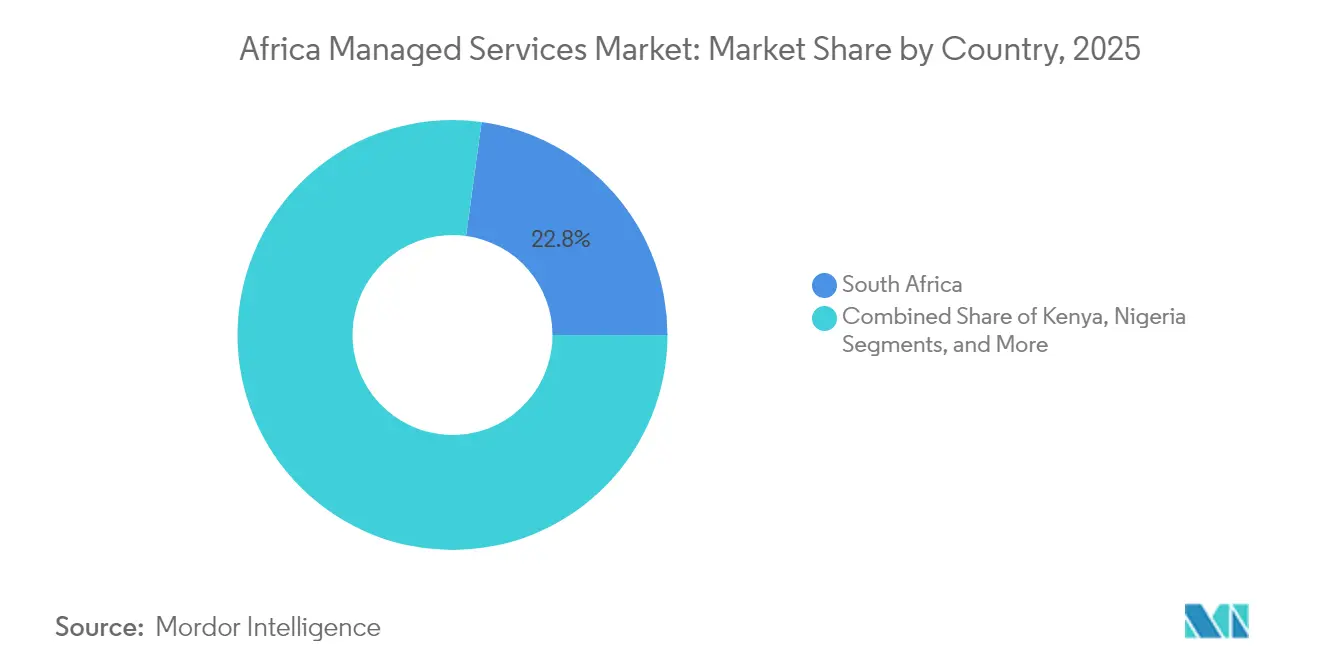
- By geography, South Africa commanded 22.84% market share in 2025, while Egypt records the highest forecast CAGR at 12.98% for 2026-2031.
Note: Market size and forecast figures in this report are generated using Mordor Intelligence’s proprietary estimation framework, updated with the latest available data and insights as of 2026.
Africa Managed Services Market Trends and Insights
Drivers Impact Analysis*
| Driver | (~) % Impact on CAGR Forecast | Geographic Relevance | Impact Timeline |
|---|---|---|---|
| Favorable trends in big data and analytics and growing ICT spend | +2.1% | Global, with concentration in South Africa, Kenya, Nigeria, Egypt | Medium term (2-4 years) |
| SME-led surge in managed cloud adoption | +2.8% | Global, strongest in Nigeria, Ghana, Kenya | Short term (≤ 2 years) |
| Rise of pan-African fibre networks lowering latency | +1.9% | Cross-border corridors, West-East Africa connectivity | Long term (≥ 4 years) |
| National data-sovereignty policies driving local MSP demand | +2.3% | Nigeria, South Africa, Egypt, Kenya | Medium term (2-4 years) |
| Mining and resource sector's OT-IT convergence needs | +1.2% | South Africa, Ghana, DRC, Zambia | Long term (≥ 4 years) |
| Greenfield smart-city projects requiring outsourced IT | +0.9% | Kenya (Konza), Nigeria (Eko Atlantic), Egypt (New Administrative Capital) | Long term (≥ 4 years) |
| Source: Mordor Intelligence | |||
SME-led Surge in Managed Cloud Adoption
Small and medium enterprises increasingly anchor the Africa managed services market as currency depreciation makes on-premises hardware unaffordable. Nigerian SMEs now choose naira-denominated cloud bundles that avoid foreign-exchange shocks, lowering total cost of ownership by up to 40%. Similar shifts appear in Ghana where a stronger cedi lets firms channel savings into subscription-based analytics platforms. Providers such as Nebula and Nobus use volume pricing to profitably serve thousands of small customers, fuelling predictable recurring revenue across the Africa managed services market. Scalable multi-tenant architectures let these MSPs maintain margins even as average contract value falls. Over the next two years, SME demand remains the most immediate growth catalyst for providers that can automate onboarding and support functions.
National Data-sovereignty Policies Driving Local MSP Demand
Domestic data-residency laws in Egypt, Nigeria, South Africa and Kenya have re-ordered procurement priorities. Egypt’s 120-petabyte Government Data and Cloud Computing Center anchors local workload hosting mandates and draws hyperscaler partnerships that reinforce the Africa managed services market.[1]Government Opens Egypt’s First Data Center,” Egypt Today, egypttoday.comFinancial institutions in Nigeria similarly divert workloads to local operators to comply with 2024 data-protection rules, granting indigenous MSPs strategic advantage. Liquid Intelligent Technologies posted 10.3% revenue growth after packaging compliance-ready cloud, connectivity and security services for regulated clients. As more governments formalise localisation, in-country capacity becomes a non-negotiable tender criterion, reshaping vendor shortlists and underwriting mid-term market expansion.
Rise of Pan-African Fibre Networks Lowering Latency
Submarine projects such as the 45,000-km 2Africa cable cut international bandwidth costs by up to 80%, driving a leap in cross-border application performance.[2]2Africa Cable Overview,” 2Africa Consortium, 2africacable.org Complementary terrestrial builds from WIOCC connect landlocked states, trimming latency by 40-60 ms and enabling centralised service delivery from fewer data centres. These network economics unlock new locations for backup, disaster recovery and AI inference workloads within the Africa managed services market. As construction phases complete over the next four years, providers can aggregate regional traffic into scale hubs, sharpening price competitiveness while sustaining quality of service for multinational clients.
Mining and Resource Sector’s OT-IT Convergence Needs
Underground Wi-Fi, autonomous haul trucks and sensor-laden conveyor belts have turned African mine sites into data-rich environments that outstrip traditional IT staffing models. Two Rivers Platinum’s partnership with Datacentrix illustrates the operational gains from real-time monitoring of critical equipment underground.[3]Datacentrix Delivers Underground Wi-Fi,” IM Mining, im-mining.com Managed service providers combining industrial protocols, cyber-safety and analytics deliver this functionality faster than in-house teams can acquire expertise. Demand is strongest in South Africa and Ghana where remote-operations mandates lift safety and productivity. Over the long term, specialised MSPs are set to carve defensible niches that broaden the addressable Africa managed services market beyond classic enterprise IT.
Restraints Impact Analysis*
| Restraint | (~) % Impact on CAGR Forecast | Geographic Relevance | Impact Timeline |
|---|---|---|---|
| Chronic power-supply instability increasing OPEX | -1.8% | Sub-Saharan Africa, excluding South Africa | Short term (≤ 2 years) |
| Data-privacy and cybersecurity skill gaps | -1.1% | Global, most acute in Central and West Africa | Medium term (2-4 years) |
| Slow cross-border bandwidth upgrades in Central Africa | -0.7% | Central African Republic, Chad, Cameroon, Gabon | Long term (≥ 4 years) |
| Depreciating local currencies squeezing ICT budgets | -2.2% | Nigeria, Ghana, Kenya, Zambia, Egypt | Short term (≤ 2 years) |
| Source: Mordor Intelligence | |||
Chronic Power-supply Instability Increasing OPEX
Frequent outages mean Nigerian data centres operate diesel generators 8-12 hours daily, driving energy bills 60-80% higher than grid-reliant peers and compressing margins across the Africa managed services market. South Africa’s scheduled load-shedding still forces dual-feed designs that raise capital outlays. Providers deploy battery storage and micro-grid solutions yet capital intensity limits entry for smaller firms. Clients also bear hidden costs through higher connectivity pricing as operators amortise redundancy investments. Although renewable deployments promise relief, unreliable power remains the single largest operational expense headwind through 2027.
Depreciating Local Currencies Squeezing ICT Budgets
Twenty-one African currencies are set to weaken against the US dollar in 2025, inflating the landed cost of imported equipment and cloud licences. MTN Nigeria signalled profits could fall 90% after naira losses, illustrating the revenue shock to key MSP customers. Enterprises now demand local-currency contracts, shifting forex risk onto service providers inside the Africa managed services market. Some MSPs respond by structuring variable-price clauses or sourcing regionally produced hardware. While depreciation elevates outsourcing’s appeal by deferring capital spend, it also curbs near-term budget headroom, making flexible payment models a competitive necessity.
*Our forecasts treat driver/restraint impacts as directional, not additive. The impact forecasts reflect baseline growth, mix effects, and variable interactions.
Segment Analysis
By Service Type: Security Services Accelerate Past Infrastructure
Managed data-centre and hosting services retained the largest 37.02% revenue slice in 2025, underscoring infrastructure’s foundational role. Managed security solutions, however, are growing at 12.28% CAGR, elevating their importance within the Africa managed services market. Heightened attack frequency against banks and telcos drives continuous monitoring, incident response and zero-trust architecture demand. The Africa managed services industry also benefits from chronic cybersecurity talent shortages, prompting enterprises to outsource advanced protection stacks.
Increasing ransomware claims spur regulatory scrutiny, bolstering spend on compliance-aligned managed detection and response. At the same time, multi-tenant SOC platforms allow providers to amortise tooling across dozens of clients, lifting margins. As African boards attach financial penalties to breaches, security retainer contracts lengthen from annual renewals to multi-year-plus extensions, embedding steady cash flow into the Africa managed services market.


By Deployment Model: Public Cloud Dominance Masks Hybrid Shift
Public cloud captured 76.65% of 2025 revenues and is projected to climb with a 12.75% CAGR, yet data-sovereignty rules catalyse a pivot toward hybrid frameworks. Nigerian firms now blend hyperscale compute with local nodes to comply with residency mandates without sacrificing elasticity. Providers integrate edge devices and regional availability zones to maintain sub-50 ms latency for consumer applications, demonstrating the Africa managed services market’s agility.
Private cloud persists in heavily regulated banking and government workloads where direct control remains paramount. Hybrid orchestration tools from Microsoft and VMware thus experience rising adoption, indicating that deployment decisions are becoming workload-specific rather than binary. Over time, hybrid models are likely to narrow the public-cloud share even as absolute volumes expand, reshaping architecture design principles within the Africa managed services market.
By Organisation Size: SMEs Drive Market Transformation
SMEs accounted for 55.72% of the Africa managed services market share in 2025 and will expand at 11.84% CAGR to 2031 as subscription-priced ERP, CRM and analytics platforms reach mass affordability. Bundled voice, connectivity and cloud security offerings lower barrier-to-entry for firms with limited in-house skills. Providers employing AI-driven self-service dashboards minimise support costs while improving transparency.
SME scale compels MSPs to automate ticketing, patching and billing to remain profitable at lower average revenue per user. This volume-oriented playbook contrasts with enterprise-focused bespoke engagements and tilts competition toward those able to fund platform development. By 2030, micro-enterprises employing under 20 staff are expected to represent a third of total contracted endpoints, cementing SMEs as the structural growth engine of the Africa managed services market.
By End-user Industry: Healthcare Transformation Accelerates
Digital health outlays are soaring as telemedicine platforms bridge clinician shortages of 1.55 per 1,000 people. The sector’s 12.33% CAGR outpaces all others and relies on MSPs for HIPAA-like data protection, real-time imaging and remote-device management. Hospitals leverage outsourced SOCs to guard against ransomware that threatens patient safety, positioning healthcare as a priority sub-segment.
IT-telecom retook spending leadership with 27.18% of 2025 revenues, leveraging in-house expertise to co-design customised network and edge solutions. Banking and financial services follow closely due to rising mobile-money penetration and stringent compliance obligations. Together these industries deepen vertical specialisation across the Africa managed services market, encouraging providers to acquire domain-specific certifications.
By Country: Egypt’s Infrastructure Investment Drives Growth
South Africa held 22.84% revenue share in 2025 but Egypt will post the fastest 12.98% CAGR thanks to its USD 2.7 billion 5G build-out and 120-petabyte government cloud. Strategic geography linking Europe, Asia and Africa plus newly manufactured fibre cables in Ain Sokhna underpin Egypt’s hub ambitions.
Nigeria’s depreciation shock slows imported-gear purchases, yet spurs ingenuity as local MSPs create naira-priced bundles. Kenya capitalises on the 2Africa landing and AI Strategy 2025-2030 to attract data-science workloads, while Ghana’s stronger currency gives SMEs fresh purchasing power. Collectively, these trajectories reinforce the need for providers to balance local footprints with regional breadth across the Africa managed services market.
Geography Analysis
South Africa combines advanced telecoms, skilled labour and relative regulatory clarity to act as a continental springboard. Microsoft’s ZAR 5.4 billion hybrid-cloud investment demonstrates confidence in long-term demand, even as load-shedding mandates multi-feed power designs that inflate costs. Johannesburg and Cape Town data-centre clusters already host most regional disaster-recovery sites, reinforcing market gravity.
Egypt delivers the fastest expansion underpinned by state-backed infrastructure programmes and a goal of USD 9 billion outsourcing revenue by 2026. Situated on critical subsea cable crossroads, the nation provides single-digit-millisecond latencies to Gulf and European customers, encouraging MSPs to locate regional SOCs and multilingual support centres there.
Kenya, Nigeria and a wide Rest-of-Africa grouping together form a diversified growth frontier for the Africa managed services market. Kenya’s Konza Technopolis pilots smart-city managed services; Nigeria’s vast addressable base is tempered by foreign-exchange volatility; and Ghana plus Rwanda illustrate how favourable policy reforms can accelerate digital adoption. Cross-border fibre corridors increasingly let providers serve multiple states from a single metro, enabling economies of scale.
Regulatory Landscape
Managed services demand in Africa is increasingly shaped by continent-level digital policy alignment and country-level data-residency and telecom rules. The African Union Digital Transformation Strategy for Africa 2020-2030 and related AU data policy frameworks set common direction on digital identity, interoperability, and data governance. At the same time, national regimes in Nigeria, South Africa, Kenya, and Egypt establish concrete compliance requirements that affect hosting location, cybersecurity controls, and procurement eligibility.
In Nigeria, sovereign cloud oversight has tightened through the National Cloud Policy (published October 2025), which assigns NITDA a role in conducting periodic audits of cloud service providers and system integrators for data residency and security compliance. In 2026, Nigeria also moved telecom policy modernization forward through its National Telecommunications Policy overhaul, including treatment of key telecom assets as Critical National Information Infrastructure and explicit attention to AI, IoT, and satellite broadband integration. That broadens the compliance surface for MSPs supporting connectivity-led managed offerings. In Kenya, the ICT Authority runs a centralized standards and audit framework for government IT, with requirements for annual IT process reviews and periodic system audits across agencies, supporting demand for managed governance, risk, and compliance services for public-sector workloads.
Competitive Landscape
Competition is balanced between global hyperscalers, regional telecom-affiliated MSPs and agile local specialists. IBM, Microsoft and Cisco pursue enterprise contracts that demand integrated AI, security and network solutions, using global reference sites as proof points. Liquid Intelligent Technologies, MTN Business and BCX leverage local points-of-presence and currency billing to undercut imports and comply with residency laws.
Partnership ecosystems widen the field: Liquid C2’s tri-party agreement with Google Cloud and Anthropic layers generative AI atop African-resident infrastructure, while MTN and Huawei’s Joint Innovation Lab aligns 5G and cloud advances for pan-African roll-outs. Emerging cloud start-ups focus on cost-led disruption—especially in Nigeria where naira pricing resonates.
Consolidation remains plausible as platform scale becomes key to funding automation and energy-efficient facilities. Nonetheless, regulatory diversity and currency risk deter a single entity from dominating, ensuring that the Africa managed services market retains a moderately fragmented character over the medium term.
Africa Managed Services Industry Leaders
Cisco Systems
IBM Corporation
Accenture PLC
Fujitsu Ltd.
HP Development Company LP
- *Disclaimer: Major Players sorted in no particular order

Market Opportunities and Future Outlook
National and regional digital infrastructure programs are creating whitespace for MSPs that can bundle connectivity, cloud migration, and managed security with local-compliance operations. In April 2026, the African Development Bank Group approved a USD 200 million loan for Nigeria's Digital Value Chain Infrastructure for Boosting Employment (D-VIBE) Project, targeting a 90,000 km national fiber expansion. This expands addressable sites for managed network, edge, and branch IT operations beyond the largest metros. In July 2026, Yas (AXIAN Telecom) secured up to EUR 270 million in EBRD financing to expand digital infrastructure in Senegal and Kenya, including structures such as local-currency facilities that align with enterprise preference for local-currency managed service contracts amid FX volatility.
Sovereign cloud programs and data center buildouts are also shifting buyer requirements toward in-country processing, auditability, and security-by-design. That favors providers with local data center partnerships and multi-jurisdictional compliance playbooks. In May 2026, NITDA partnered with the International Data Center Authority (IDCA) to develop the Nigeria Digital Triangle, positioned as a network of hyperscale, AI-enabled data center clusters, increasing near-term need for managed landing zones, cloud operations, and SOC-as-a-service aligned to government cloud governance. Separately, Raxio Group reported more than USD 380 million in committed capital by July 2026 and signed contracts for materially higher power capacity in the first half of 2026 versus the same period in 2025, supporting more carrier-neutral capacity where MSPs can standardize managed hosting, disaster recovery, and security services for regulated industries and pan-African enterprises.
Recent Industry Developments
- May 2026: The South Africa Department of Communications and Digital Technologies (DCDT) set out 2026-2027 priorities in its Budget Vote Speech, including workstreams around Wireless Open Access Network (WOAN) policy direction and licensing frameworks. The update reinforces a more rules-driven operating environment for telecom infrastructure and service providers that underpin managed network and cloud delivery. For MSPs, clearer telecom policy and licensing processes can support longer-term managed connectivity and security contracts with regulated customers.
- September 2025: Accenture and Cassava Technologies announced a strategic collaboration to accelerate sovereign AI and cloud adoption across Africa, combining Accenture capabilities with Cassava data center infrastructure. The move strengthens enterprise-grade managed services built around local data processing and compliance-ready architectures. It also signals growing demand for managed AI platforms, governance, and security layers delivered from African-resident infrastructure.
- June 2025: Airtel Uganda launched Network as a Service (NaaS) in collaboration with Cisco to support enterprise digital transformation needs through consumption-based networking. The offering aligns with the broader shift from capex-led infrastructure builds to subscription-style managed services, particularly for SMEs and distributed organizations. It also elevates the role of vendor-telco ecosystems in scaling standardized managed network services across multiple African markets.


Research Methodology Framework and Report Scope
Market Definition and Coverage
For this methodology, the Africa managed services market includes outsourced, proactively managed IT operations delivered under an ongoing service arrangement, where the provider monitors, maintains, and improves day to day performance for client environments.
Scope exclusions: We exclude one time consulting only work and pure resale of hardware or software with no recurring management component.
Segmentation Overview
- By Service Type
- Managed Network Services
- Managed Security Services
- Managed Mobility Services
- Managed Cloud Services
- Managed Data-centre and Hosting Services
- Other Services
- By Deployment Model
- Private Cloud
- Public Cloud
- Hybrid Cloud
- By Organization Size
- Large Enterprises
- Small and Medium-sized Enterprises (SMEs)
- By End-user Industry
- IT and Telecom
- BFSI
- Retail and E-commerce
- Healthcare
- Government and Public Sector
- Manufacturing
- Other Industries
- By Country
- South Africa
- Kenya
- Nigeria
- Egypt
- Rest of Africa
Data Sources, Market Sizing, and Validation
Desk Research
Desk research was used to set the outer boundaries of demand and to anchor our assumptions to visible signals in Africa. We reviewed public indicators for telecom and connectivity buildouts, cloud adoption direction, cybersecurity policy push, and enterprise digitization, then linked those indicators to managed service attach rates.
The main inputs came from non paywalled sources such as ITU telecom indicators, World Bank and IMF macro series, national communications regulators and cybersecurity agencies in key countries, and trade and standards bodies such as ISO and IEEE publications where relevant. We also used company annual reports, investor presentations, and reputable press coverage to capture service mix shifts and contract themes, and we selectively referenced paid subscriptions for company financials and intelligence, and for news and financials to track material events. These examples are not exhaustive, and many other public sources were used to collect data, cross check it, and clarify assumptions.
Primary Interviews and Surveys
Primary work focused on validating what buyers actually purchase in country level markets, and what is bundled into a managed contract versus sold as a separate professional service. We spoke with a mix of providers, channel partners, and enterprise buyers across key African hubs, and the discussions were used to confirm service scope, typical pricing logic, contract duration patterns, and the pace of cloud and security driven demand.
Distribution of primary research fieldwork respondents
| Company type | Respondent position | Region |
|---|---|---|
| Top tier: 33% | CXOs: 14% | |
| Mid tier: 48% | Functional/Unit leaders: 28% | |
| Smaller Players: 19% | Managers: 58% |
Market-Sizing & Forecasting
Sizing starts with a top-down build that reconstructs the addressable managed services pool from enterprise IT spend and telecom services direction in Africa, then it is filtered using adoption and outsourcing intensity seen across major countries. The model is cross checked using selective bottom-up approximations, including sampled provider revenue disclosures, channel feedback on managed attach rates, and volume by price checks for common managed offerings. This helped us adjust totals when any country appeared overstated.
Inputs used in the model include enterprise cloud migration pace, cybersecurity spend momentum, fiber and mobile broadband coverage expansion, exchange rate movement that affects contract repricing, and the share of workloads monitored under SLAs versus handled in house. Where a data series was missing for a smaller country, we used proxy indicators such as GDP by sector and connectivity penetration, and then applied interview validated adoption ranges so the gap was handled consistently.
For forecasting, scenario analysis was applied around two practical drivers, which are the speed of cloud adoption and the rate of security led outsourcing. The scenarios were kept within ranges that interviewees agreed were realistic for procurement cycles in the region. The final forecast path was selected only after the scenario outputs stayed aligned with observed growth in connectivity and the expected direction of enterprise digitization budgets.
Data Validation & Update Cycle
Model outputs were validated through triangulation across multiple independent checks, including country level spend logic, service mix sanity checks, and direction of pricing for recurring contracts. If any estimate moved sharply without a clear demand driver, the assumptions were reviewed, and respondents were re contacted to confirm whether a real market shift had occurred.
Before sign off, the work is reviewed in steps by another analyst to catch arithmetic issues, scope leakage, and inconsistent country roll ups. The report is refreshed annually, and interim updates are made when major events materially change demand signals, such as regulatory shifts, currency shocks, or large contract announcements. Right before delivery, we run a fresh pass on key inputs so clients receive the latest updated view.
Mordor Intelligence's Africa Managed Services Market Estimate Compared With Other Published Estimates
Published market sizes for managed services in Africa can vary even when they sound like they cover the same topic, because the service boundary and the country coverage choices are not consistent. Differences also come from how each publisher treats managed security, cloud operations, and mobility management when these are bundled inside broader IT services contracts.
By tracking contract scope at the service line level and refreshing currency and pricing assumptions country by country, Mordor Intelligence keeps the total tied to recurring managed delivery, rather than mixing in one time integration value or broader IT outsourcing buckets.
Benchmark comparison
| Source | Market Size | Gaps in Research Methodology |
|---|---|---|
| Mordor Intelligence | USD 4.95 B (2025) | |
| Regional Consultancy A | USD 6.10 B (2025) | This estimate appears to include wider IT outsourcing and recurring support that sits outside managed operations, which inflates the total when consulting led engagements are counted as managed services. |
| Industry Association B | USD 4.20 B (2025) | This estimate likely uses a narrower country set and may exclude managed security and mobility lines, and it can also understate value when informal pricing and multi year contract uplifts are not captured. |
The spread in the table mainly comes from where the line is drawn between recurring managed operations and adjacent IT service revenue, and from how many African countries are included in the roll up. Our approach stays traceable to clear demand drivers like connectivity buildout, cloud migration, and security spending, and then it is checked against practical pricing and adoption ranges confirmed in interviews.


Key Questions Answered in the Report
What is the current value of the Africa managed services market?
The Africa managed services market size is USD 5.53 billion in 2026 and is projected to grow to USD 9.62 billion by 2031.
Which service segment is growing fastest?
Managed security services are expanding at 12.28% CAGR for 2026-2031 thanks to rising cyber-threat exposure among African enterprises.
Why are SMEs critical to future growth?
SMEs already command 55.72% revenue share in 2025 and prefer subscription models that avoid large capital outlays, driving a 11.84% CAGR.
How do data-sovereignty laws affect provider strategies?
Regulations in Egypt, Nigeria and South Africa force workloads to stay onshore, favouring MSPs with local data-centre footprints.
Page last updated on:






