
Market Overview
| Study Period | 2020 - 2031 |
|---|---|
| Forecast Data Period | 2026 - 2031 |
| Base Year Market Size (2025) | 2.68 Billion liters |
| Market Volume (2026) | 2.77 Billion liters |
| Market Volume (2031) | 3.27 Billion liters |
| Growth Rate (2026 - 2031) | 3.36 % |
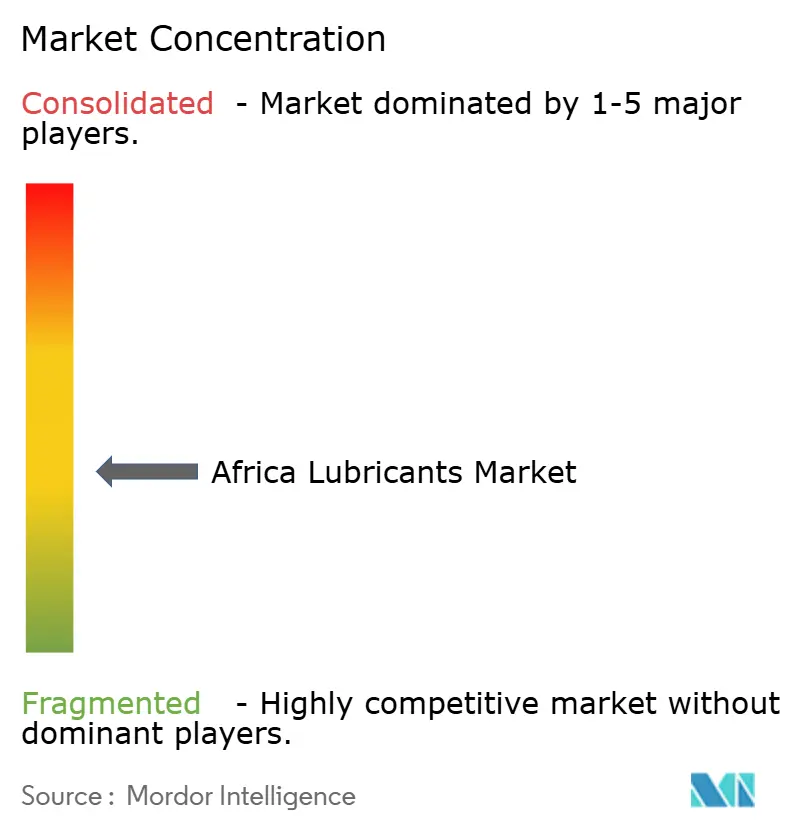
| Market Concentration | Medium |
Major Players *Disclaimer: Major Players sorted in no particular order Image © Mordor Intelligence. Reuse requires attribution under CC BY 4.0. | |
Africa Lubricants Market Analysis by Mordor Intelligence
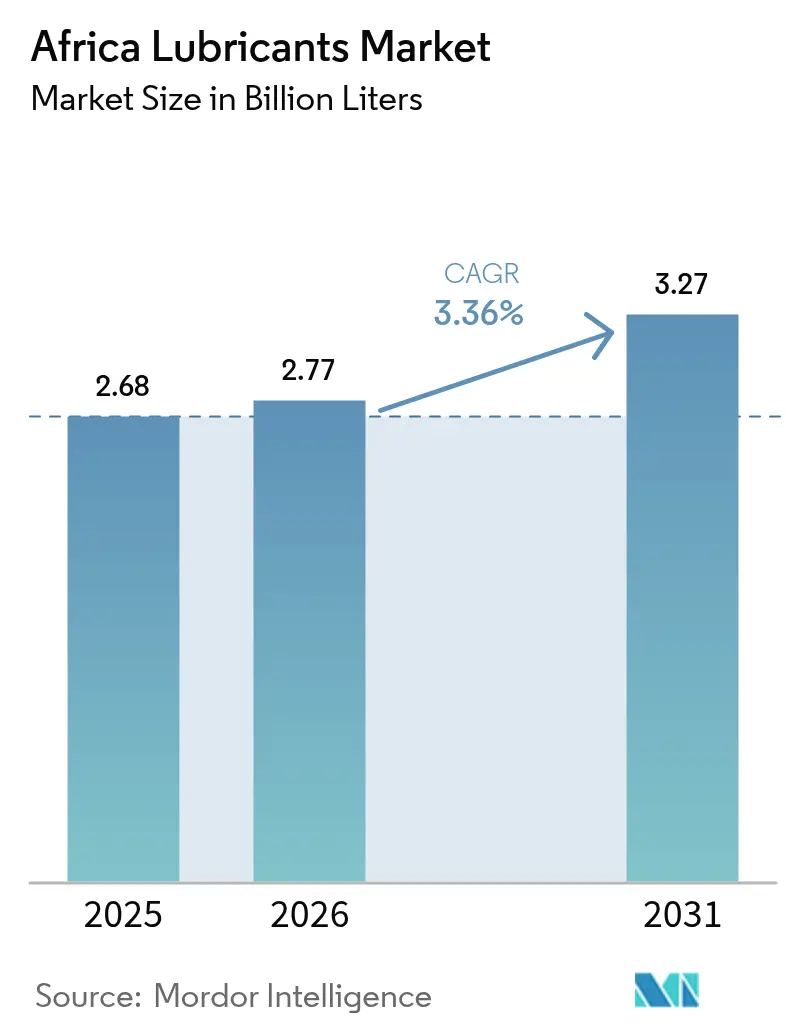
The Africa Lubricants Market size is expected to grow from 2.68 billion liters in 2025 to 2.77 billion liters in 2026 and is forecast to reach 3.27 billion liters by 2031 at 3.36% CAGR over 2026-2031. Robust infrastructure programs, accelerating mining output, and the rapid expansion of regional vehicle fleets underpin this volume growth. Public and private investments in road, rail, and energy assets continue to drive higher demand for construction machinery lubricants, while rising motorization rates in cities, from Cairo to Lagos, support sustained consumption of automotive engine oils. Local refinery upgrades, notably the base-oil streams emerging from new Nigerian capacity, strengthen regional supply resilience and temper import dependence. OEM mandates for extended drain intervals are nudging buyers toward synthetic grades, especially in markets now enforcing Euro 4 and Euro 5 emission norms, and this transition is most evident in Egypt, South Africa, and Morocco. Competitive intensity remains moderate; international majors leverage brand equity and technical know-how, yet regionally rooted suppliers gain ground by offering flexible pack sizes, price-competitive mineral formulations, and on-site equipment services.
Key Report Takeaways
- By product type, automotive engine oil led with a 36.05% share of Africa's lubricants market in 2025, while process oils are expected to expand at a 4.25% CAGR through 2031.
- By end-user, the automotive segment held a 44.75% share of the African lubricants market size in 2025, whereas industrial applications are projected to advance at a 3.92% CAGR through 2031.
- By base stock, mineral oils accounted for 79.60% of the Africa lubricants market size in 2025, and synthetic lubricants are forecast to progress at a 3.98% CAGR over the outlook period.
- By geography, Egypt commanded 22.95% of Africa's lubricants market share in 2025, and Morocco is poised for the fastest growth at a 3.86% CAGR through 2031.
Note: Market size and forecast figures in this report are generated using Mordor Intelligence’s proprietary estimation framework, updated with the latest available data and insights as of 2026.
Market Trends and Insights
Drivers Impact Analysis of Africa Lubricants Market*
| Drivers | (~) % Impact on CAGR Forecast | Geographic Relevance | Impact Timeline |
|---|---|---|---|
| Rapid motorization driving automotive demand | +1.2% | Egypt, Nigeria, South Africa, Morocco | Medium term (2-4 years) |
| Infrastructure-led mining and construction | +0.8% | South Africa, Nigeria, Algeria, Rest of Africa | Long term (≥ 4 years) |
| Local refinery upgrades boosting base oils | +0.6% | Nigeria, Egypt, Algeria | Medium term (2-4 years) |
| OEM drain-interval extensions favoring synthetics | +0.4% | South Africa, Egypt | Long term (≥ 4 years) |
| Fast-growing e-commerce fleet demand | +0.3% | Nigeria, Egypt, South Africa | Short term (≤ 2 years) |
| Source: Mordor Intelligence | |||
Rapid Motorization Driving Automotive Lubricant Demand
Vehicle ownership is rising faster than population growth in major urban centers, creating a steady pull for engine oils, transmission fluids, and brake fluids. Commercial truck fleets in Lagos and Johannesburg experience arduous duty cycles, which shorten oil change intervals and increase consumption. National assembly plants across North Africa now require factory-fill volumes and consistent aftermarket supply, with local content regulations encouraging in-country blending. Motorists are gradually shifting from monograde to multigrade formulations as modern engines become more prevalent, and the preference for smaller pack sizes aligns with the purchasing power of individual car owners. OEM service networks champion licensed products that meet Euro 5 emission requirements, thereby accelerating the uptake of mid-SAPs synthetic blends.
Infrastructure-Led Mining and Construction Boom
Copper, phosphate, and critical mineral projects are expanding in South Africa, Zambia, and Morocco, each utilizing heavy mechanical loaders and conveyors that require premium hydraulic fluids and EP gear oils capable of withstanding dust and high loads. Concurrent road, port, and rail upgrades across Egypt and Nigeria sustain demand for greases and turbine oils used in large earth-moving equipment and power generation sets. Suppliers able to deliver bulk volumes to remote sites win contracts, while those offering oil analysis and condition monitoring services secure long-term relationships that lock in product offtake. The predictable operating schedules of construction consortia create baseline orders that stabilize blender capacity utilization even during seasonal dips in passenger car consumption.
Local Refinery Upgrades Boosting Base-Oil Availability
The start-up of advanced refining units in Nigeria, as well as revamps in Egypt and Algeria, adds Group I and Group II base-oil streams to the regional supply. Local blenders benefit from reduced freight costs and shorter lead times, which enable more competitive pricing and a faster response to tenders. Consistent quality improves batch blending efficiency, lowering rework and waste. Refinery supply agreements also mitigate currency-related cost spikes linked to imported feedstocks. Over time, the expanded slate of higher viscosity-index base oils supports a broader synthetic blend portfolio, widening the product mix available to high-performance industrial equipment operators.
OEM Drain-Interval Extensions Favoring Synthetics
Truck manufacturers now recommend drain intervals of 40,000-60,000 km when suitable low-ash synthetic oils are used, encouraging fleet owners to weigh the total cost of ownership against the upfront price. Field trials in South Africa have demonstrated improvements in fuel economy when synthetic 5W-30 oil is used in place of conventional 15W-40 oil in long-haul tractors[1]. The longer service life lowers lubricant disposal volumes, aligning with corporate sustainability policies. Industrial equipment OEMs echo the trend; modern compressors specified for LNG trains in Algeria require PAG-based oils that can withstand elevated discharge temperatures. The extension of oil change intervals frees maintenance crews for other tasks, improving overall asset productivity.
Restraints Impact Analysis of Africa Lubricants Market*
| Restraints | (~) % Impact on CAGR Forecast | Geographic Relevance | Impact Timeline |
|---|---|---|---|
| Persistent fuel-subsidy volatility | -0.7% | Nigeria, Egypt, Algeria | Short term (≤ 2 years) |
| Dominance of low-grade Group I imports | -0.4% | Nigeria, Rest of Africa | Medium term (2-4 years) |
| Informal counterfeit-oil networks | -0.3% | Nigeria, Rest of Africa | Long term (≥ 4 years) |
| Source: Mordor Intelligence | |||
Persistent Fuel-Subsidy Volatility Distorting Prices
Abrupt subsidy removals or reinstatements shift pump prices and indirectly influence lubricant demand, as transporters recalibrate mileage and maintenance budgets. Sudden cost spikes prompt operators to stretch drain intervals or down-trade to cheaper monograde oils, eroding premium segment volumes. Importers struggle to forecast landed costs when exchange rates and subsidy levels change in tandem, complicating inventory decisions. Policy uncertainty discourages heavy capital investment in blending plants and storage, prolonging reliance on toll blending and third-party logistics.
Dominance of Low-Grade Group I Imports
Price-sensitive buyers in many African markets view lubricants as commodities, opting for base-level monogrades sold from bulk drums rather than higher-specification packs. Traders import oversupplied Group I base oils from the Middle East and Asia, blending them locally into low SAPS formulations that meet only minimal API standards. The resulting price differential, often lower than that of synthetic blends, constrains the supplier's ability to upsell. This dynamic also keeps average selling prices subdued, dampening overall market value growth relative to volume gains.
*Our forecasts treat driver/restraint impacts as directional, not additive. The impact forecasts reflect baseline growth, mix effects, and variable interactions.
Africa Lubricants Market Segment Analysis
By Product Type:
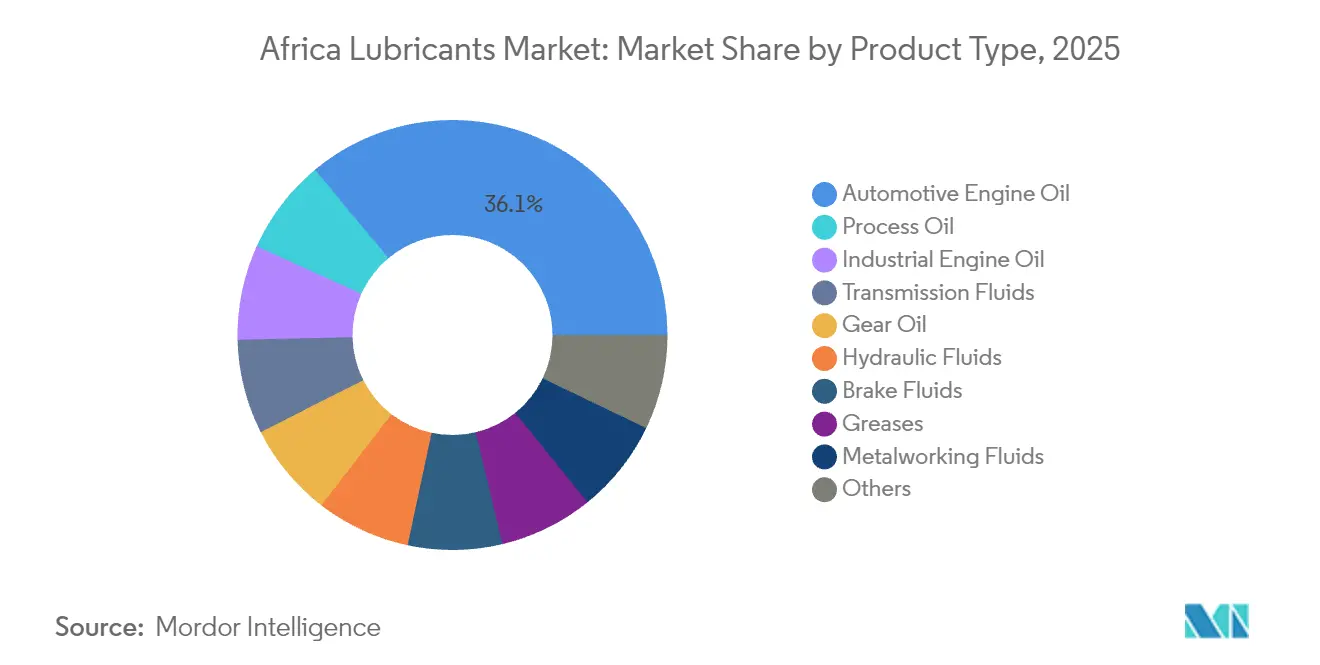
Engine Oils Remain the Anchor of DemandAutomotive engine oil held 36.05% of Africa's lubricants market share in 2025, supported by a continent-wide vehicle fleet that continues to age under challenging operating conditions. Commercial trucks account for a sizable portion of sump volumes, and frequent oil changes increase the total liters consumed each year. Process oils, serving rubber, textile, and petrochemical plants, are forecast to grow at a 4.25% CAGR, the fastest among all product lines, thanks to industrial diversification programs in Egypt and Nigeria. Gear oils cater to underground mining machines that operate under extreme shock loads, while transmission fluids gain prominence as automatic gearboxes become more prevalent in commercial fleets. Hydraulic fluids experience steady demand from backhoes and cranes operating on large construction sites throughout West and North Africa. Metalworking fluids track the evolution of domestic component manufacturing, particularly the brake pad and filter plants that have recently been established in Morocco.
Demand for greases is rising in surface mining and marine thrusters, with lithium-complex products preferred for their water resistance. Brake fluids show linear growth in line with new vehicle assemblies, though the shift toward electric cars may curb long-term expansion. Turbine oils secure slots in combined-cycle gas plants commissioned under national electrification agendas, and transformer oils benefit from grid reinforcement projects feeding rapidly urbanizing regions. Collectively, the diversified product slate anchors the resilience of the Africa lubricants market, balancing cyclical softness in any single end-use with momentum in others.

By End-User Industry:
Automotive Leads, Industry Builds MomentumThe automotive domain captured 44.75% of the 2025 volume, reflecting the prevalence of passenger cars, buses, and two-wheelers across the continent. Light-duty passenger vehicles dominate in North Africa, while heavy trucks rule corridors connecting inland mines to port gateways in Southern Africa. Industrial users, encompassing manufacturing, energy, and mining, will expand at a 3.92% CAGR through 2031 as governments push downstream processing and localized value creation. Power plants commission new gas and renewable energy capacity, increasing the consumption of turbine and compressor oils. Mining houses adopt centralized lubrication systems that meter greases precisely, reducing wastage while ensuring consistent replenishment contracts.
Marine lubricants gain traction as container traffic through the Suez Canal and West African deep-water terminals rises. Aerospace fluids, though niche, benefit from aircraft fleet renewals among regional carriers. Agricultural mechanization relies on off-highway engine oils and hydraulic fluids, particularly in Ethiopia and Kenya. Across user segments, digital oil analysis services become a competitive differentiator, providing predictive data that underpins supply contracts and cements brand loyalty.
By Base Stock Type:
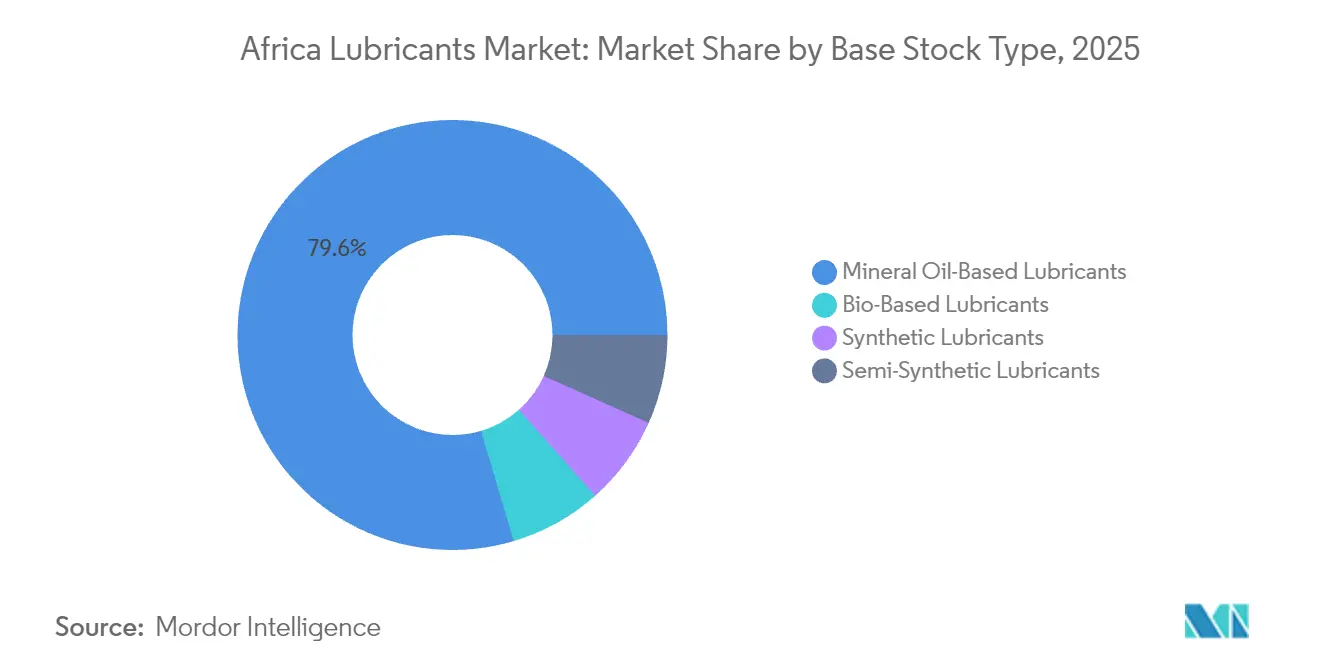
Mineral Dominance Continues, Synthetic Uptake AcceleratesMineral formulations accounted for 79.60% of the 2025 volume, underscoring entrenched buyer price sensitivity and existing blending infrastructure that is calibrated for Group I feedstock. At the same time, synthetics are expected to register a 3.98% CAGR through 2031 as OEMs mandate higher viscosity indices and improved oxidation stability. Semi-synthetic blends serve as a compromise, offering performance gains for a modest premium, particularly appealing to commercial fleets that prioritize uptime. Bio-based lubricants remain a niche market; however, research on local feedstocks, such as castor and jatropha, demonstrates promising tribological properties when modified with nano-additives.
The cost gap between mineral and synthetic oils narrows whenever import freight surges or exchange rates weaken local currencies, which happens frequently in Africa’s floating-rate economies. This dynamic occasionally triggers temporary swings toward higher specification products. National standards bodies are increasingly harmonizing with API and ACEA frameworks, paving the way for a broader shift to synthetics. Over the forecast period, OEM factory fills and long-haul truck segmentation will be the two principal accelerators of synthetic substitution.
Geography Analysis
Africa Lubricants Market
Egypt, with 22.95% of the 2025 volume, benefits from a diversified economic base that spans automotive assembly, petrochemical processing, and maritime trade. Lubricant sales are split between passenger car oils and industrial oils servicing fertilizer, steel, and textile plants. Morocco’s lubricants growth is expected to average a 3.86% CAGR, supported by robust auto exports, phosphate extraction, and targeted e-mobility incentives. South Africa’s mature aftermarket values premium formulations that ensure warranty compliance on high-end vehicle brands, while its mining sector continues to absorb heavy-duty gear oils.
Nigeria’s sheer population drives scale, but supply chain bottlenecks and currency swings add volatility to demand cycles. Algeria leverages substantial hydrocarbon revenue to fund refinery upgrades, which improve its base-oil self-sufficiency. The rest of Africa presents a patchwork of opportunities; East African Community states focus on agriculture and small-engine oils, whereas Central African mining enclaves prioritize bulk mineral hydraulic fluids. Regional trade agreements accelerate cross-border flows, yet local standards sometimes limit product interchangeability, compelling suppliers to maintain country-specific variants.
Regulatory Landscape
Regulation is tightening around lubricant quality, facility licensing, and traceability, with standards bodies and cross-border trade rules taking a larger role. In Kenya, the Energy and Petroleum Regulatory Authority (EPRA) requires lubricants sold in-country to comply with product quality standards approved by the Kenya Bureau of Standards (KEBS), and the Petroleum (Products Quality Management) Regulations, 2025 introduced stricter requirements for imported refined petroleum products to meet Kenya Standards or approved international standards, supported by mandatory testing infrastructure.
At the regional level, the African Organisation for Standardisation (ARSO) continues to drive harmonization through African Standards to reduce technical barriers in intra-African trade, while the African Continental Free Trade Area (AfCFTA) framework provides preferential tariff pathways when Rules of Origin are met, including via defined chemical processing or controlled blending/mixing processes. In East Africa, the standard-setting pipeline remains active, including the 2026 Draft East African Standard DEAS 1334 for fuel additive specification, which requires authority approval of each additive prior to market introduction. This reinforces a compliance-first route to market for higher-performance lubricant formulations and additive packages.
Value Chain Analysis
The value chain covers base oil and additive supply (with imports still important for Group II/III and high-performance additive packages), local blending and packaging, and distribution into automotive and industrial end users. Regional blending hubs in Nigeria, Egypt, and South Africa support supply availability, enabling majors and independents (for example, TotalEnergies, Shell, ExxonMobil, Chevron, FUCHS, and Engen, alongside local players such as Afrilube, African Group Lubricants, and TORQ Lubricants) to tailor product slates, pack sizes, and specifications to country-level standards and OEM service requirements.
Logistics and distribution remain a key constraint, with Sub-Saharan Africa relying heavily on road trucking for primary oil product transport. This increases delivered costs and lead-time variability for both bulk and packaged lubricants. Counterfeit and adulterated products also affect downstream outcomes, pushing suppliers toward authentication, tighter channel control, and technical services such as oil analysis and condition monitoring. These measures help protect brand integrity and support long-term industrial supply contracts, particularly for mining, construction, and power generation users purchasing in bulk and requiring consistent quality.
Competitive Landscape
The African Lubricants Market is moderately fragmented. The market is contested by a mix of global majors, including TotalEnergies, Shell, ExxonMobil, and Chevron, alongside regionally entrenched producers such as FUCHS, Engen, and Afriquia. Regional independents sharpen competitiveness through plant automation, smaller batch flexibility, and tailored pack sizes. Chevron introduced NEXBASE 4 XP Group III+ base oil into European tank farms with onward shipping into Morocco and South Africa, enabling local blenders to formulate low-viscosity OW-20 and OW-16 grades for late-model cars. FUCHS’ South-African hub now offers digitally controlled blending lines and rooftop solar arrays targeting net-zero site emissions by 2040.
Africa Lubricants Industry Leaders
-
Shell plc
-
TotalEnergies
-
Exxon Mobil Corporation
-
BP plc
-
Chevron Corporation
- *Disclaimer: Major Players sorted in no particular order
Africa Lubricants Market Companies Covered in this Report
- Ardova Plc
- BP plc
- Chevron Corporation
- CONOIL GROUP PTY LTD.
- Engen Petroleum (PTY) LTD
- Exxon Mobil Corporation
- FUCHS
- Misr Petroleum
- MRS OIL NIGERIA PLC
- Oando PLC
- Sasol
- Shell plc
- TotalEnergies
- Vivo Energy Holding B.V.
Market Opportunities and Future Outlook
Compliant, higher-specification lubricants and documented supply chains are emerging as a clearer differentiator as governments and standards bodies raise requirements for quality and facility controls. Kenya is moving toward a more formal compliance structure through the Petroleum (Products Quality Management) Regulations, 2025 and the Petroleum (Lubricants Facility Construction and Business Licensing) Regulations, 2025, while East African standard development continues, including KEBS-led 2026 draft standards for specialty fluids such as flushing oils and fuel additives. For suppliers able to provide certified formulations, testing documentation, and traceability, these changes create a practical opening in markets where informal and counterfeit networks have historically diluted brand value.
On the supply side, investments and route-to-market moves highlight opportunities in localized production and more scalable distribution. FUCHS expanded its Isando (Johannesburg) footprint with a new blending plant that raised capacity by over 40% (February 2025), supporting regional availability for premium and OEM-aligned grades. In February 2026, Puma Energy partnered with Hass Petroleum Group to distribute lubricants in the Democratic Republic of Congo, pointing to gaps in logistics and channel reach in under-served countries. At the same time, periodic base-oil tightness and ongoing import dependence, reflected in reported supply-squeeze conditions in Nigeria (July 2026), underline the need for more resilient sourcing strategies, including local base-oil streams and diversified import channels for Group II/III feedstocks and additive packages.
Recent Industry Developments in Africa Lubricants Market
- July 2026: ADNOC Distribution entered into a definitive agreement to acquire 100% of Shell Downstream South Africa for an enterprise value of about USD 1 billion. The deal includes retail and convenience assets as well as wholesale, aviation, and lubricants businesses, shifting control of a large lubricants route-to-market footprint to a Gulf-based operator. With closing targeted in 2027, the announced transaction signals accelerating consolidation and portfolio reshaping in Southern Africa downstream.
- July 2026: OLA Energy Group signed a share purchase agreement to acquire TotalEnergies Marketing Ethiopia, covering its downstream operations including lubricants activities alongside service stations and storage assets. The acquisition expands OLA Energy's established African network and provides immediate scale in Ethiopia for distributing packaged lubricants through existing retail and commercial channels. For TotalEnergies, the divestment continues a pattern of reconfiguring Africa downstream positions while keeping focus on priority markets and platforms.
- April 2025: Engen Petroleum (PTY) LTD relaunched its Xtreme 2.0 lubricant range in South Africa with anti-counterfeit QR seals and packaging incorporating post-consumer recycled plastics. The refresh strengthens brand protection in a market where authenticity concerns influence buyer trust and channel selection. It also supports broader shifts toward more formalized compliance and product differentiation in the automotive aftermarket.
Africa Lubricants Market Report Scope and Research Methodology
Market Definition and Coverage
For this methodology, the Africa lubricants market covers finished lubricants consumed across African countries for automotive, industrial, heavy equipment, marine, and related applications, and it is tracked in demand volume terms (liters) across the full value chain from formulation to end use.
Scope exclusions: This sizing excludes fuels, fuel additives as a standalone market, and non-lubricating specialty chemicals that do not function as a lubricant in use.
Segments Covered in This Report
- By Product Type
- Automotive Engine Oil
- Industrial Engine Oil
- Transmission Fluids
- Gear Oil
- Brake Fluids
- Hydraulic Fluids
- Greases
- Process Oil (Including Rubber Process Oil and White Oil)
- Metalworking Fluids
- Turbine Oil
- Transformer Oil
- Other Product Types
- By End-user Industry
- Automotive
- Passenger Vehicles
- Commercial Vehicles
- Two-Wheelers
- Marine
- Aerospace
- Heavy Equipment
- Construction
- Mining
- Agriculture
- Industrial
- Power Generation
- Metallurgy and Metalworking
- Textiles
- Oil and Gas
- Other End-Use Industries
- Automotive
- By Base Stock Type
- Mineral Oil-Based Lubricants
- Synthetic Lubricants
- Semi-Synthetic Lubricants
- Bio-Based Lubricants
- By Geography
- Nigeria
- South Africa
- Egypt
- Algeria
- Morocco
- Rest of Africa
Data Sources, Market Sizing, and Validation
Desk Research
Desk work started with building the demand map by country and major end use, then checking what is realistically measurable through public datasets. We relied on official and non paywalled sources such as national statistics offices and customs agencies for import and export patterns, IEA energy balances for activity signals, and OICA style vehicle parc and production series where available for Africa markets.
We also reviewed sources such as central bank publications on FX and inflation, refinery and base oil updates from energy ministries, and technical papers from SAE and peer reviewed tribology journals to understand drain interval changes and base oil shifts. Company annual reports, investor presentations, and reputable press were used to confirm capacity additions, blending footprint, and distribution coverage, and a paid subscription database for company financials plus an import or export shipment level database were used selectively where public reporting was thin. The sources listed here are illustrative, and many other public documents and datasets were also referenced for clarification, validation, and cross checks.
Primary Interviews and Surveys
Primary work focused on validating country demand splits, product mix, and how fast formulations are moving from mineral to semi synthetic and synthetic in different use cases. We spoke with blenders, base oil suppliers, distributors, fleet and plant maintenance leads, and independent workshops across major Africa hubs, then used surveys to confirm assumptions on drain intervals, pricing direction, and substitution between lubricant types.
Distribution of primary research fieldwork respondents
| Company type | Respondent position |
|---|---|
| Top tier: 38% | CXOs: 13% |
| Mid tier: 42% | Functional/Unit leaders: 35% |
| Smaller Players: 20% | Managers: 52% |
Market-Sizing & Forecasting
Sizing was built using a top-down and bottom-up combination, where top-down demand is reconstructed from country level activity indicators and lubricant intensity factors, then corroborated using selective supplier roll ups and channel checks. For each country cluster, we translated signals like vehicle parc by type, industrial output and mining activity, construction equipment utilization, and power generation and marine activity into lubricant consumption volume, and then adjusted for typical drain intervals and oil change practices.
To keep the model practical, a few inputs were treated as the main levers, including base stock mix (mineral versus synthetic), shift in viscosity grades, share of automotive versus industrial demand, and the effect of OEM and emissions related maintenance norms that change replacement frequency. Where bottom-up information was incomplete, gaps were handled by applying benchmark penetration rates and distributor coverage factors that were validated through interviews, before totals were rolled up to Africa.
Forecasts were prepared using scenario analysis supported by simple time series smoothing for the stable components of demand. The scenarios were anchored on expected fleet growth, industrial investment pace, and macro indicators that influence lubricant usage, and assumptions were revisited country by country so the final outlook stayed consistent with what practitioners expect on the ground.
Data Validation & Update Cycle
Outputs were checked through triangulation across independent signals, so the implied liters per vehicle, liters per industrial unit, and country import dependence stayed within realistic ranges. Variances were investigated when a country showed sharp changes that could not be explained by trade shifts, FX moves, or known capacity events, and then the model was reworked and rechecked before sign off.
A second analyst review was done to test sensitivity to key inputs such as drain intervals, base stock mix, and country weighting, and follow up calls were triggered when assumptions moved the total meaningfully. Reports are refreshed annually, and interim updates are made when material events occur, after which a final pre delivery pass is done so clients receive the most current view.
Mordor Intelligence's Africa Lubricants Market Market Size Compared With Other Published Estimates
Published market sizes for Africa lubricants often do not match closely because the boundaries and units are not always the same, and some sources mix value and volume without making the conversion logic clear. Differences also come from whether informal and gray channel volumes are assumed, how countries with limited data are treated, and how fast drain interval and synthetic shift changes are applied in forecasts.
By tracking drain interval shifts and base stock mix updates, then converting the final volume build into a value estimate using country specific pricing checks, Mordor Intelligence keeps the Africa total tied to realistic consumption behavior instead of using a single blended price across the region.
Benchmark comparison
| Source | Market Size | Gaps in Research Methodology |
|---|---|---|
| Mordor Intelligence | USD 2.77 B (2026) | |
| Industry Association A | USD 3.35 B (2026) | This estimate typically applies one or two regional average prices to total volumes and may not adjust for country FX timing, informal channel pricing, or the faster synthetic uptake seen in a few large markets, which can inflate the value total. |
| Trade Journal B | USD 2.10 B (2026) | This number is often built from reported imports and formal sales only, which can miss locally blended output and cross border redistribution, and it may also assume conservative drain intervals that undercount heavy equipment and industrial usage. |
The spread is mainly explained by how volume is translated into dollars and how much unreported local blending and redistribution is assumed. When the scope, unit choice, and conversion steps are made explicit, the resulting market size becomes easier to reproduce and to compare across countries and end uses.
Key Questions Answered in the Report
How large is the Africa lubricants market in 2026?
The Africa lubricants market size stood at 2.77 billion liters in 2026 and is projected to reach 3.27 billion liters by 2031 at a 3.36% CAGR.
Which product segment dominates lubricant demand in Africa?
Automotive engine oil leads with 36.05% of 2025 volume, reflecting widespread vehicle ownership and frequent oil changes.
Which country consumes the most lubricants in Africa?
Egypt currently holds the largest single-country share at 22.95% of 2025 volume.
What is driving synthetic lubricant adoption in Africa?
OEM-mandated longer drain intervals and stricter emission standards are prompting fleet owners to opt for synthetic and semi-synthetic grades.
How will local refinery projects affect lubricant supply?
New Nigerian and upgraded North African refineries are adding Group II base-oil capacity, reducing import dependence and supporting competitive pricing.