
Market Overview
| Study Period | 2020 - 2031 |
|---|---|
| Forecast Data Period | 2026 - 2031 |
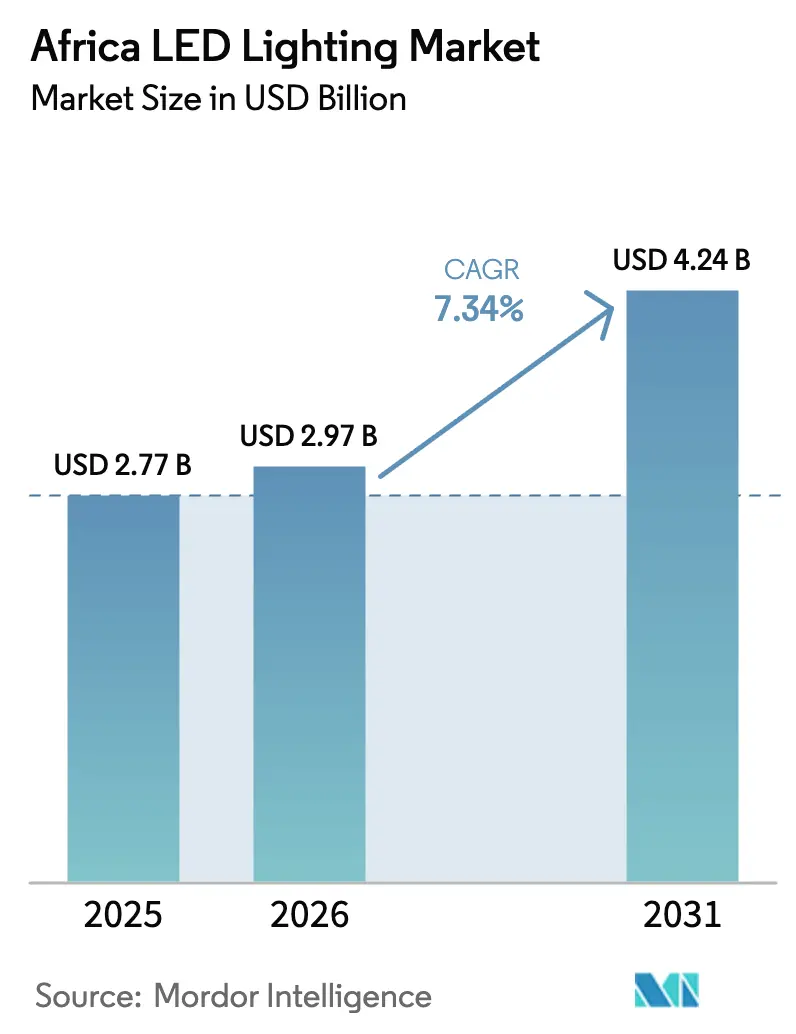
| Base Year Market Size (2025) | USD 2.77 Billion |
| Market Size (2026) | USD 2.97 Billion |
| Market Size (2031) | USD 4.24 Billion |
| Growth Rate (2026 - 2031) | 7.34 % |
| Market Concentration | Medium |
Major Players *Disclaimer: Major Players sorted in no particular order Image © Mordor Intelligence. Reuse requires attribution under CC BY 4.0. | |
Africa LED Lighting Market Analysis by Mordor Intelligence
The Africa LED Lighting market size is expected to grow from USD 2.77 billion in 2025 to USD 2.97 billion in 2026 and is forecast to reach USD 4.24 billion by 2031 at 7.34% CAGR over 2026-2031. This performance highlights how government energy-efficiency regulations, infrastructure upgrades, and declining fixture prices are collectively influencing purchasing decisions across public and private projects. Widespread phase-out mandates in South Africa and Nigeria are redirecting procurement budgets toward compliant luminaires, while pay-as-you-go solar models are capturing rural households that remain off the grid. The widening availability of e-commerce channels is compressing distribution costs, and local assembly incentives in Uganda and Egypt are improving supply resilience. Multinationals are responding by partnering with regional distributors to mitigate regulatory and logistical hurdles, a strategy that keeps competition broadly diffused and price points downward.
Key Report Takeaways
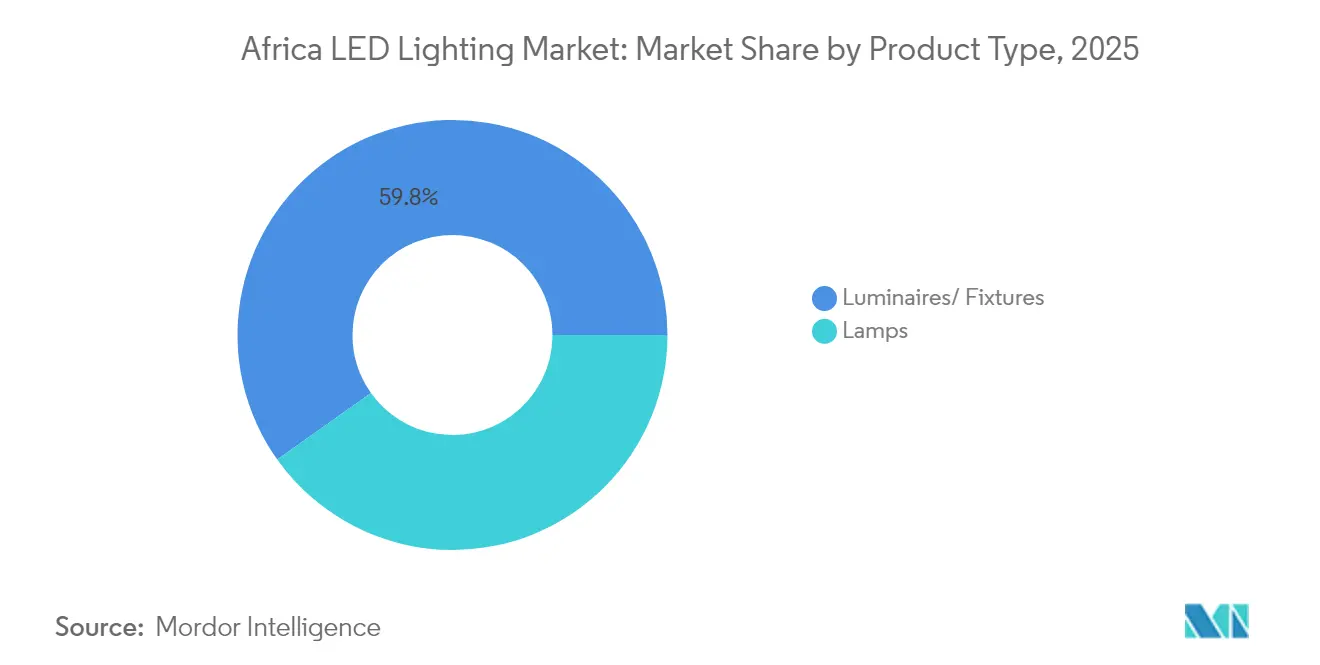
- By product type, luminaires commanded a 59.83% revenue share in 2025, while lamps are forecast to post the fastest growth of 7.96% CAGR through 2031.
- By application, residential lighting accounted for 53.02% of the 2025 Africa LED Lighting market share, and commercial projects are projected to expand at a 9.14% CAGR through 2031.
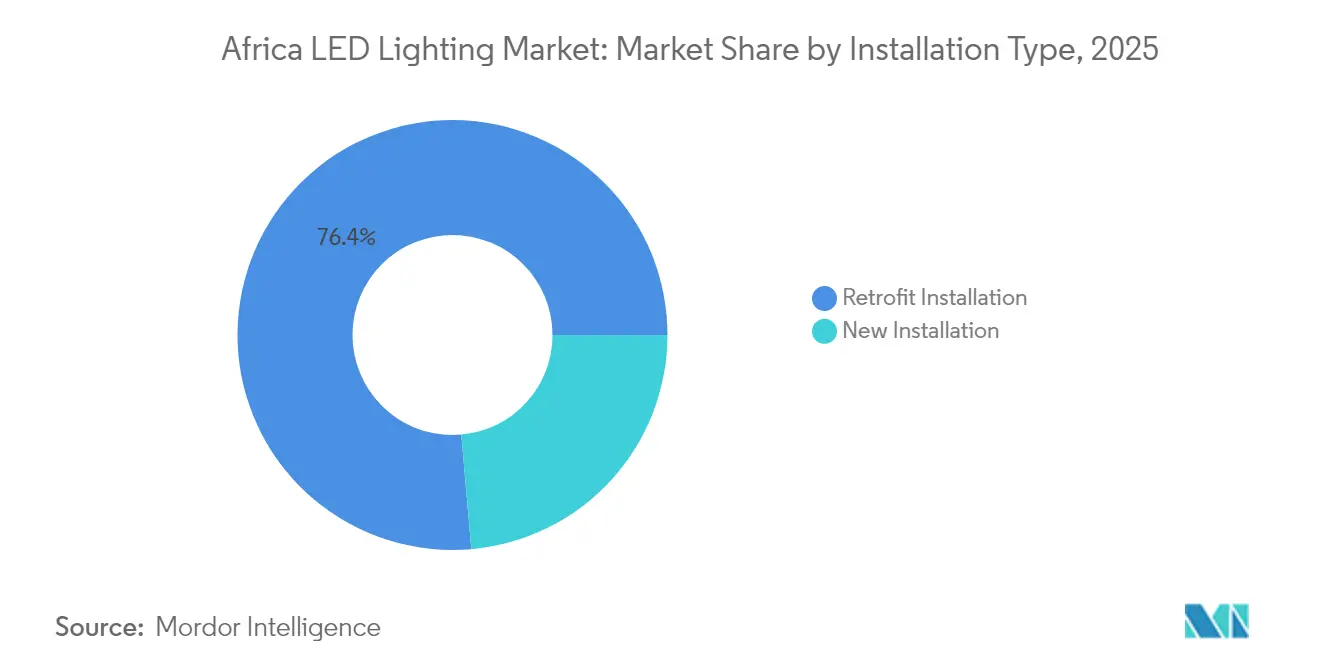
- By installation type, retrofit projects accounted for a 76.40% share of the Africa LED Lighting market size in 2025, whereas new installations are expected to grow at a 7.42% CAGR through 2031.
- By distribution channel, wholesale retail dominated with a 61.55% share in 2025, and e-commerce is anticipated to grow at an 8.1% CAGR to 2031.
- By geography, South Africa led with roughly 27.65% of regional revenue in 2025, while Kenya is forecast to deliver the highest 9.98% CAGR through 2031.
Note: Market size and forecast figures in this report are generated using Mordor Intelligence’s proprietary estimation framework, updated with the latest available data and insights as of 2026.
Market Trends and Insights
Drivers Impact Analysis of Africa LED Lighting Market*
| Driver | (~) % Impact on CAGR Forecast | Geographic Relevance | Impact Timeline |
|---|---|---|---|
| Government energy-efficiency regulations and phase-out mandates | +1.8% | South Africa, Ghana, Nigeria core markets | Medium term (2-4 years) |
| Declining LED component costs and rising affordability | +1.5% | Continental, strongest in price-sensitive segments | Short term (≤ 2 years) |
| Urban infrastructure expansion and smart-city projects | +1.2% | Lagos, Johannesburg, Nairobi, Casablanca | Long term (≥ 4 years) |
| Pay-as-you-go solar LED models unlocking rural demand | +0.9% | East Africa core, expanding to West Africa | Medium term (2-4 years) |
| E-commerce penetration enabling D2C LED distribution | +0.7% | Kenya, South Africa, Nigeria urban centers | Short term (≤ 2 years) |
| Free-zone manufacturing incentives boosting local output | +0.6% | Uganda, Nigeria, Egypt manufacturing hubs | Long term (≥ 4 years) |
| Source: Mordor Intelligence | |||
Government Energy-Efficiency Regulations and Phase-Out Mandates
South Africa’s Minimum Energy Performance Standards, effective January 2024, require the use of LED lighting in all government facilities, while Ghana’s 2025 policy framework directs public procurement toward certified high-efficiency lamps.[1]Ghana Energy Commission, “LED Policy Framework Launch 2025,” energycom.gov.gh Nigeria’s Standards Organization now enforces IEC 62560 import compliance that excludes low-grade lamps and elevates demand for certified brands. These directives ensure multi-year purchasing cycles, as agencies must meet schedule-driven retrofit targets. Certified suppliers gain predictable volume orders, and local distributors benefit from stocking a narrower yet higher-margin product mix that satisfies documentation checks at customs channels. Private builders often mirror public specifications, so regulatory momentum cascades into demand for retail, commercial, and industrial sectors as well.
Declining LED Component Costs and Rising Affordability
Global oversupply enabled LED chip prices to decline by 15-20% in 2024, while driver electronics achieved similar savings through platform standardization.[2] “LED Component Cost Analysis and Market Trends,” IEEE Transactions on Power Electronics, ieeexplore.ieee.org Uganda-based Pearlight converts the lower bill of materials into price tags that sit 10-15% below imported equivalents, catalyzing a cost-led switching wave among mid-income homeowners. In Nigeria, wholesalers spotlight breakeven payback periods of less than 18 months, an argument that resonates even where grid tariffs are subsidized. Component deflation also accelerates fixture replacement in municipal streetlight programs because budgets buy more poles per tranche, stretching limited capital across sprawling suburbs.
Urban Infrastructure Expansion and Smart-City Projects
The USD 5.4 million Light Up Lagos program finalized its second phase in October 2024, outfitting coastal roadways with networked luminaires that deliver remote dimming and fault detection. Nairobi County installed IoT-enabled streetlights in April 2025, and Kiambu followed with solar-powered systems one month later. These investments elevate LED penetration because new tenders embed lumen-per-watt minimums that legacy lamps cannot reach. Ancillary service providers-such as network planners, maintenance contractors, and data platform operators-gain new revenue streams, illustrating how lighting upgrades sit at the core of broader smart-city blueprints.
Pay-As-You-Go Solar LED Models Unlocking Rural Demand
Kenya’s M-KOPA platform enables households to obtain two-bulb kits for USD 0.50 per day, bundling financing with mobile payments and after-sales maintenance. The African Development Bank backed a USD 9.2 million village electrification plan in Senegal in January 2025, scaling the concept across 200 communities. These models bypass unreliable grids, cut kerosene expenses, and create monthly cash flows for distributors. Suppliers that integrate battery management and robust enclosures mitigate environmental wear, prolonging replacement cycles and lowering total ownership cost-key factors for repeat purchases in low-income segments.
Restraints Impact Analysis of Africa LED Lighting Market*
| Restraint | (~) % Impact on CAGR Forecast | Geographic Relevance | Impact Timeline |
|---|---|---|---|
| High upfront fixture cost in price-sensitive segments | -1.1% | Rural markets, low-income urban segments | Short term (≤ 2 years) |
| Limited consumer awareness in rural communities | -0.8% | Sub-Saharan Africa rural areas | Medium term (2-4 years) |
| Voltage instability causing premature driver failures | -0.6% | Nigeria, Ghana, parts of East Africa | Medium term (2-4 years) |
| Weak e-waste and recycling framework raising compliance cost | -0.4% | Continental, excluding South Africa | Long term (≥ 4 years) |
| Source: Mordor Intelligence | |||
High Upfront Fixture Cost in Price-Sensitive Segments
Many rural homes still view USD 15-25 per fixture as unattainable when kerosene lamps cost under USD 5. The price gap is more pronounced where electricity subsidies lower monthly bills, thereby reducing the visible benefit of efficiency. Programs that blend microloans with community-level bulk orders are easing the hurdle, yet adoption remains episodic. Manufacturers are experimenting with stripped-down optical packages that meet entry-level lumen needs while deferring premium features-such as integrated sensors-until incomes permit upgrades.
Voltage Instability Causing Premature Driver Failures
Frequent voltage dips in Nigeria and parts of Ghana shorten driver lifespans, inflating maintenance budgets and negating advertised savings. Municipal buyers now demand surge-protected drivers tested above 6 kV, shifting sourcing toward premium SKUs that carry higher initial costs. Global brands leverage this concern by bundling multi-year warranty terms, but smaller local assemblers face capital strain because warranty pools lock in working capital. Grid modernization projects remain years away, so fixture designs must continue to accommodate fluctuating power quality to safeguard brand reputation and curb negative word-of-mouth.
*Our forecasts treat driver/restraint impacts as directional, not additive. The impact forecasts reflect baseline growth, mix effects, and variable interactions.
Africa LED Lighting Market Segment Analysis
By Product Type:
Luminaires Maintain Volume Leadership While Lamps Accelerate GrowthLuminaires contributed 59.83% of 2025 sales as facility managers preferred integrated housings that simplify retrofit audits across large campuses. This leadership reflects how the Africa LED Lighting market favors turnkey solutions when tender documents stipulate specific beam angles, ingress protection ratings, and warranty duration. Lamps, although a smaller slice, are the fastest growing at an 7.96% CAGR. Cost-sensitive households can slot an A60 bulb into an existing socket without rewiring, making the category the entry point for first-time adopters. Genesis One Lighting validated the energy-saving promise by installing 2,400 high-bay luminaires in a Johannesburg mall, resulting in a 65% reduction in electricity use and reinforcing the value proposition for property managers.
The shift in mix influences procurement cycles. Luminaires often require upfront feasibility studies and installation crews, so purchases cluster around fiscal-year budgets. Lamps, by contrast, flow continuously through retail and e-commerce channels, smoothing revenue seasonality for wholesalers. Over time, the Africa LED Lighting market is likely to witness lamp upgrades incorporating smart chips that communicate via Zigbee or Bluetooth, a development that may redirect some luminaire demand into sockets already in place.


By Application:
Residential Dominance Mirrors Urbanization and Income UpliftsThe residential segment held a 53.02% share in 2025, driven by rapid household formation in greater Johannesburg, Lagos, and Nairobi. Energy-aware consumers are swapping 60-W incandescent bulbs for 9-W LEDs, a move that slashes monthly usage while preserving brightness. Commercial spaces are emerging as the fastest climber, buoyed by corporate carbon pledges that make lighting retrofits a quick win within ESG scorecards. Retail chains utilize high CRI fixtures to enhance product appeal and extend dwell time, while office landlords incorporate tunable white lamps to support occupant productivity, driving a 9.14% CAGR in commercial adoption.
Industrial uptake lags slightly yet grows steadily as factories discover that high-bay luminaires sustain lumen maintenance despite ambient temperatures above 40 °C. Specialized horticulture trials are also gaining traction: Florensis Kenya reported 93% energy savings and improvements in crop quality with Philips GreenPower modules, signaling how agriculture can become a niche volume driver. The Africa LED Lighting market size for niche verticals remains small today, but stands to expand once agritech financing packages normalize.
By Installation Type:
Retrofit Reigns Yet New-Build Specification RisesRetrofits accounted for 76.40% of spending in 2025 because legacy fluorescent and sodium-vapor lamps still dominate public facilities. Provincial bureaus assemble multi-building contracts that bundle audit, removal, and installation under performance guarantees, creating scale for contractors. South Africa’s mandatory retrofitting timetable ensures predictable bid flow. At the same time, new installations are advancing at a 7.42% CAGR, as city-edge housing estates, logistics parks, and data centers specify LED packages during the blueprint phases. The Africa LED Lighting market size for first-time installations is expected to narrow the gap with retrofit volumes by 2031 as construction accelerates across Nairobi’s satellite towns and Nigeria’s Lekki corridor.
Longer term, design-build firms will incorporate daylight-harvesting sensors and PoE cabling, features easier to integrate when lighting is planned pre-construction. As these buildings enter operation, ongoing service contracts-ranging from firmware updates to predictive driver replacement-will emerge as a secondary revenue stream, particularly appealing to systems integrators searching for recurring income.
By Distribution Channel:
E-Commerce Outpaces Traditional Wholesale ExpansionWholesale storefronts controlled 61.55% of revenue in 2025. Contractors favor them for hands-on product validation and the ability to resolve warranty claims face-to-face. However, e-commerce is growing at an 8.1% CAGR as smartphone ownership soars and last-mile delivery services proliferate. Kenya’s Solar Store and Jiji offer side-by-side lumen-per-watt comparisons that accelerate buying decisions, while mobile money removes cash-handling friction. Direct sales teams target mega-projects, supplying comprehensive bundles that include design, supply, and commissioning services.
The Africa LED Lighting market is increasingly adopting omni-channel strategies: distributors provide QR codes on shelf tags that link to live inventory online, and e-commerce portals offer in-store pickup for customers wary of delivery delays. Over time, data harvested from clickstream behaviors will feed demand forecasting algorithms, helping suppliers trim stock-outs and working capital needs.
Geography Analysis
Africa LED Lighting Market
South Africa led the Africa LED Lighting market in 2025, thanks to sturdy grid infrastructure, clear regulatory mandates, and the presence of multiple assembly plants. MEPS compliance spurred immediate retrofits across ministerial buildings, and Eskom’s rebate schemes shortened payback periods for commercial landlords. Nigeria followed as the second-largest buyer, though voltage instability raises total ownership costs and tempers lamp lifetimes. Still, the USD 5.4 million Light Up Lagos program demonstrated the state's resolve to modernize urban corridors, driving sustained orders from certified vendors.
East, North and West Africa LED Lighting Market
Kenya spearheads East African growth, using pay-as-you-go finance to propel rural household adoption rates past 40% by 2024. Ghana’s nationwide policy roll-out in 2025 positions Accra and Kumasi as new demand poles, and Morocco’s automotive clusters in Tangier segue into specialized purchases for vehicle lighting modules. Senegal benefits from African Development Bank funding that extends solar LED packages to 200 villages, proving the viability of donor-backed distribution frameworks. Together, these developments expand the Africa LED Lighting market's footprint beyond legacy metropolitan areas. Regional supply chains also evolve. Uganda’s free-zone incentives support the Pearlight plant, which has a 3 million unit annual capacity, reducing landed costs for inland markets. Meanwhile, Egyptian assemblers benefit from the proximity of Suez to supply North and West Africa. Manufacturers are increasingly tailoring SKUs for hot, dusty environments-raising IP ratings and thermal thresholds-to prevent premature failures that could damage brand equity. Variance in customs duties and certification paperwork demands market-specific entry playbooks, but rising policy alignment around IEC standards gradually eases cross-border product flows. Overall, geographic diversification cushions revenue risk and sustains long-run growth.
Regulatory Landscape
Regulation across Africa is tightening around mandatory safety and energy-performance compliance for general service lamps and luminaires, with increasing alignment to IEC-based requirements. In South Africa, the National Regulator for Compulsory Specifications (NRCS) enforces compulsory specifications VC 9109 (energy efficiency and functional performance) and VC 9110 (safety requirements), and suppliers must secure an NRCS Letter of Authority before products are sold. This requirement tends to shift demand toward certified brands and more complete importer documentation.
At the regional level, harmonization work through the African Electrotechnical Standardization Commission (AFSEC) supports member-state adoption of recommended standards and conformity-assessment guidance, including testing capacity aligned to ISO/IEC 17025. Policy direction is also shaped by mercury reduction commitments, with MEPS programs in multiple jurisdictions referencing Minamata-aligned phase-out of inefficient and mercury-containing lighting technologies by 2027. The resulting compliance pressure raises costs for low-end imports, while improving quality consistency in public procurement and formal retail channels.
Value Chain Analysis
The Africa LED lighting value chain is import-led, with upstream components (LED chips, drivers, optics, housings) predominantly sourced from Asia and brought in by regional importers that concentrate inventory in major commercial gateways such as Lagos, Accra, Abidjan, Durban, Cairo, and Mombasa. Local value addition is increasing through assembly and light manufacturing in select markets, while compliance needs are pushing more pre-shipment testing, labeling, and documentation at the importer stage. This is particularly relevant for products targeted at government tenders and utility or municipal programs.
Downstream, products move through wholesalers, project distributors, and contractor networks that bundle design, supply, and installation for retrofit-heavy demand, even as e-commerce expands reach in urban centers with fragmented last-mile logistics. Market surveillance and customs enforcement are becoming more structured through mechanisms such as Product Registry Systems (PRS) recommended in efficient-lighting compliance guidance, and public sector procurement (for street lighting and public buildings) continues to anchor large-volume ordering. After-sales service requirements such as warranties, surge protection, and maintenance coverage also shape distributor and contractor offerings.
Competitive Landscape
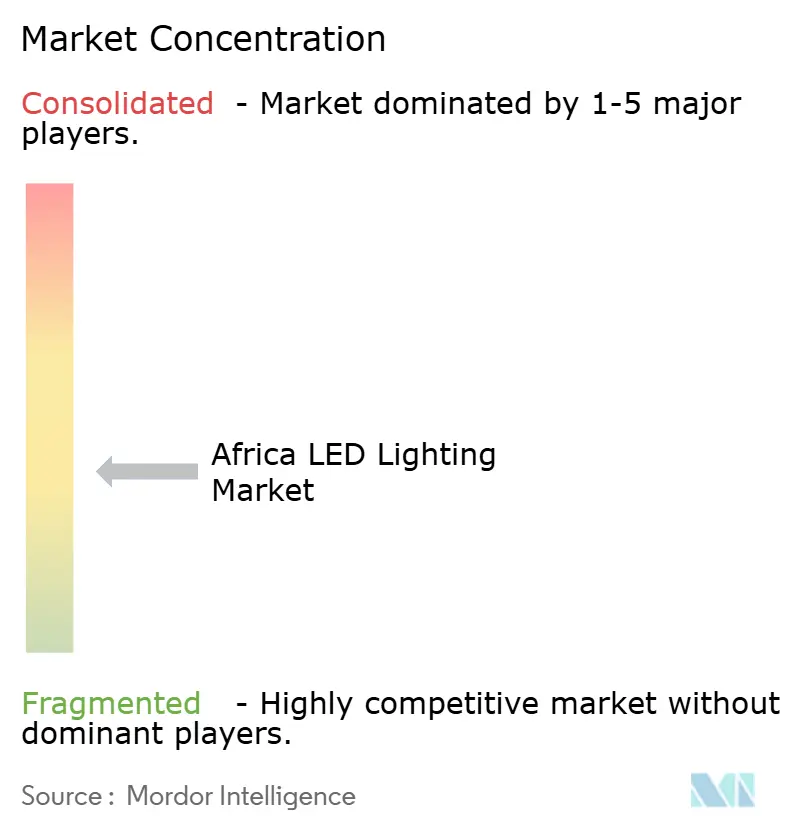
The Africa LED Lighting market remains moderately fragmented, as no single vendor holds a 12% revenue share, leaving scope for both global majors and nimble local players. Signify, OSRAM, and Panasonic rely on regional distributor networks to navigate customs procedures and after-sales servicing. These alliances swap margin for reach, but they also provide intelligence on shifting municipal tender criteria. Local independents compete on price and quicker lead times, sometimes sourcing chips from Shenzhen and assembling fixtures in small-batch runs.
Strategic moves center on localization. Hansa Green Technology’s February 2025 announcement to ramp production from its Hamriyah Free Zone plant targets West and East African buyers seeking region-specific voltage protections. Philips inked supply deals that include a Lesotho assembly line, enabling lower import duties and faster delivery of spares. International brands differentiate through extended warranties and on-site commissioning, tactics that reassure risk-averse government buyers. Surge protection enhancements and high ambient-temperature ratings headline product portfolios, directly addressing African pain points.
Competitive intensity is also evident in service layers. Siemens, Enlighted, and Zumtobel formed a joint venture in early 2024 to couple LED hardware with IoT analytics for asset tracking. Such packages appeal to malls and factories planning smart-facility upgrades, creating cross-selling opportunities for sensors and controls. While market entry barriers remain low at the low-end lamp tier, certification costs under IEC 62560 weed out substandard imports, gradually elevating the average product quality available to consumers. Midsize African brands, therefore, gain breathing room to move upmarket by adopting global safety standards.
Africa LED Lighting Industry Leaders
Signify N.V.
ams-OSRAM AG
Acuity Brands, Inc.
Eaton Corporation plc
Zumtobel Group AG
- *Disclaimer: Major Players sorted in no particular order
Africa LED Lighting Market Companies Covered in this Report
- Signify N.V.
- ams-OSRAM AG
- Acuity Brands, Inc.
- Eaton Corporation plc
- Zumtobel Group AG
- Schreder SA
- Foshan Electrical and Lighting Co., Ltd. (FSL Group)
- Opple Lighting Co., Ltd.
- Nichia Corporation
- CreeLED, Inc.
- LG Innotek Co., Ltd.
- Panasonic Holdings Corporation
- BEKA (Pty) Ltd trading as BEKA Schreder
- LED Lighting SA (Pty) Ltd
- Sunfor Technologies (Pty) Ltd
- Afrison LED (Pty) Ltd
- D.light Design Inc.
- BBOXX Limited
- Heliospectra AB

Market Opportunities and Future Outlook
Publicly funded electrification and energy-access programs are a key whitespace for LED penetration, since street lighting, public facilities, and road corridors increasingly specify efficient luminaires as part of broader grid-extension and clean-energy packages. In June 2026, the African Development Bank Group approved EUR 103.14 million for an electricity expansion program in Cote d'Ivoire, including installing 74,010 LED public lighting fixtures across 18 regions. The project illustrates how lighting volumes are being bundled into national power and distribution investments rather than treated as standalone municipal purchases.
Off-grid and social-infrastructure deployments also support demand for solar-integrated LED systems and ruggedized luminaires designed for voltage instability and harsh operating conditions. Nigeria's Rural Electrification Agency signed an MoU with the ECOWAS Commission in February 2026 for a USD 700,000 ROGEAP grant to electrify 15 public health and education facilities, and program structures like this tend to favor suppliers that can deliver compliant products, documentation, and service networks. Across smaller markets, donor-backed upgrades also create tender-led opportunities, including the African Development Bank Group's April 2026 approval of a USD 24.5 million grant for Sao Tome and Principe that includes replacement of outdated fixtures with 1,000 LED streetlights. For vendors and distributors, these programs emphasize procurement capability, logistics execution, and support for commissioning and maintenance.
Recent Industry Developments in Africa LED Lighting Market
- June 2026: Signify announced that from July 1, 2026, specification sports luminaires in Africa will transition to the Signify brand, with specification road, solar, tunnel, and flood luminaires scheduled to follow by the end of 2026. The consolidation of professional outdoor branding and product collateral under one identity is intended to support more consistent tender participation and channel enablement across multiple African markets.
- February 2026: ams-OSRAM launched its Simplify transformation and savings program, targeting EUR 200 million in run-rate savings by the end of fiscal year 2028. The program sharpens focus on core photonics capabilities and can influence LED component and module supply through portfolio prioritization and cost structure changes across its global operations.
- October 2024: The Light Up Lagos program finalized its second phase, outfitting coastal roadways with networked luminaires that enable remote dimming and fault detection. The deployment reinforced smart street lighting as a procurement template in major African cities, expanding demand for connected outdoor luminaires and associated installation and maintenance services.


Africa LED Lighting Market Report Scope and Research Methodology
Market Definition and Coverage
For this study, the Africa LED lighting market means the revenue generated from LED lamps and LED luminaires used for lighting across African countries, counted at the point of sale into the local market and tracked across common indoor and outdoor use.
Scope exclusions: This sizing does not count non-lighting LEDs (such as display backlights and indicator chips) or LED components sold as separate semiconductors.
Segments Covered in This Report
- By Product Type
- Lamps
- Luminaires / Fixtures
- By Distribution Channel
- Direct Sales
- Wholesale Retail
- E-commerce
- By Application
- Commercial Offices
- Retail Stores
- Hospitality
- Industrial
- Highway and Roadway
- Architectural
- Public Places
- Hospitals
- Horticulture Gardens
- Residential
- Automotive
- Others (Chemicals, Oil and Gas, Agriculture)
- By Installation Type
- New Installation
- Retrofit Installation
- By End User
- Indoor
- Outdoor
- Automotive
- By Country
- South Africa
- Nigeria
- Rest of Africa
Data Sources, Market Sizing, and Validation
Desk Research
Desk work set the guardrails for demand, supply, and pricing so the model does not lean on one single data series. We reviewed public energy and electrification releases, building and infrastructure pipelines, and trade patterns that influence how fast LED lighting is adopted.
Common references included sources such as the International Energy Agency (IEA), World Bank and IFC publications, UN Comtrade trade statistics, national statistics offices and customs bulletins in key African economies, and standards or efficiency guidance from public energy agencies. We also used company annual reports, investor presentations, and reputable press coverage to validate product mix shifts and channel behavior. When needed, our analysts checked paid subscriptions for company financials and intelligence, patent databases for technology direction, and an import-export shipment-level database for sanity checks on product flows. The desk sources listed here are illustrative and not exhaustive, since many other documents were used for cross-checking, validation, and clarification.
Primary Interviews and Surveys
Primary discussions were used to confirm what actually sells in the market and how pricing moves by country and channel, especially where public data is thin. We spoke with a mix of manufacturers, local assemblers, distributors, contractors, and large institutional buyers across the main African sub-regions so assumptions on conversion cycles, replacement demand, and project timing could be corrected before final sign-off.
Distribution of primary research fieldwork respondents
| Company type | Respondent position |
|---|---|
| Top tier: 37% | CXOs: 12% |
| Mid tier: 41% | Functional/Unit leaders: 30% |
| Smaller Players: 22% | Managers: 58% |
Market-Sizing & Forecasting
The core model uses a top-down build that reconstructs LED lighting demand from country-level construction activity, electrification progress, and retrofit intensity, which are then translated into unit consumption and value through typical replacement cycles. To keep the totals realistic, we also run selective bottom-up checks using sampled price bands by product type (lamps versus luminaires), channel markups, and supplier plus distributor revenue signals, and then we adjust the final totals when the two views drift too far.
Key inputs in the Africa context included the split between new installations and replacements, the share of LED within the broader lighting mix, average selling price movement by application (residential, commercial, industrial, and outdoor), public lighting and infrastructure project cadence, and import reliance versus local assembly that can shift realized prices. Where unit or price points were missing for smaller countries, gaps were handled by proxying from similar economies (income level and electrification rate), followed by an interview-led reasonableness check. For forecasting, we leaned on scenario analysis that ties adoption to macro and sector signals, and then the scenarios were narrowed using expert views on policy enforcement, project funding stability, and expected price erosion.
Data Validation & Update Cycle
Each model run is checked against independent signals such as import value trends, construction and infrastructure indicators, and the observed LED share shift in major end uses. Outliers are flagged, and then assumptions like ASP ranges, replacement cycles, and project timing are revisited until the direction matches what multiple sources support. Before sign-off, the work is reviewed in steps by another analyst so calculation issues and inconsistent definitions are caught early.
Reports are refreshed annually, and interim updates are made when material events occur, such as sharp currency moves, new efficiency rules, or major public lighting tenders being delayed or fast-tracked. Right before delivery, we do a final pass to confirm that the most recent public indicators and interview feedback are reflected in the published numbers.
Mordor Intelligence's Africa Led Lighting Market Size Compared Against Other Published Estimates
Published market sizes for Africa LED lighting can look far apart, even when they talk about similar technology, because the scope and the counting point are not always the same. Differences usually come from how firms treat adjacent categories, the year used for prices and currency conversion, and how aggressively adoption is assumed to move in informal and project-led channels.
Some external figures appear to talk about a wider lighting universe or mix in smart lighting layers and related electronics, which lifts the total when bundled reporting is used. In Mordor Intelligence, the value is counted for LED lamps and luminaires sold into African end markets, and the model is kept tied to observable adoption signals like retrofit cycles, import flows, and project execution timing rather than a single high-growth assumption.
Benchmark comparison
| Source | Market Size | Gaps in Research Methodology |
|---|---|---|
| Mordor Intelligence | USD 2.97 B (2026) | |
| Trade Journal A | USD 3.71 B (2023) | The estimate is presented as a continent-level LED market figure tied to an outlook source, but product boundaries and the pricing basis are not fully transparent, so overlap with broader lighting and smart lighting can inflate the total. |
| Industry Publication B | USD 5.49 B (2028) | This forward-looking number is reported as a single-point forecast, and the pathway from adoption rates to units and ASPs is not clearly shown, which can lead to a higher value if aggressive penetration and currency assumptions are applied. |
The spread across sources mainly traces back to what is counted as LED lighting, how the pricing year is chosen, and whether the forecast assumes faster conversion in public projects and informal retail than interviews typically support. By keeping the market tied to clear product definitions and a repeatable set of demand and price drivers, our estimate stays easier to reconcile against trade, project, and replacement signals.


Key Questions Answered in the Report
What is the current value of the Africa LED Lighting market?
The Africa LED Lighting market size stood at USD 2.97 billion in 2026.
How fast is demand expected to grow?
The market is forecast to record a 7.34% CAGR, taking revenues to USD 4.24 billion by 2031.
Which product category generates most revenue?
Integrated luminaires hold 59.83% of sales, driven by large-scale retrofit and new-build projects.
Which distribution channel is expanding fastest?
E-commerce platforms are expected to post an 8.1% CAGR as mobile payments and last-mile delivery improve.
Why do governments favor LEDs in infrastructure projects?
Energy-efficiency mandates and lower lifecycle costs make LEDs the default choice for streetlights and public buildings.
What limits faster rural adoption?
Higher upfront fixture prices and limited consumer awareness restrain take-up, though pay-as-you-go solar models are easing both barriers.
Page last updated on:


 Your data is secure and never sold or shared.


