
Market Overview
| Study Period | 2020 - 2031 |
|---|---|
| Forecast Data Period | 2026 - 2031 |
| Base Year Market Size (2025) | 4.73 Million tons |
| Market Volume (2026) | 4.99 Million tons |
| Market Volume (2031) | 6.36 Million tons |
| Growth Rate (2026 - 2031) | 4.97 % |
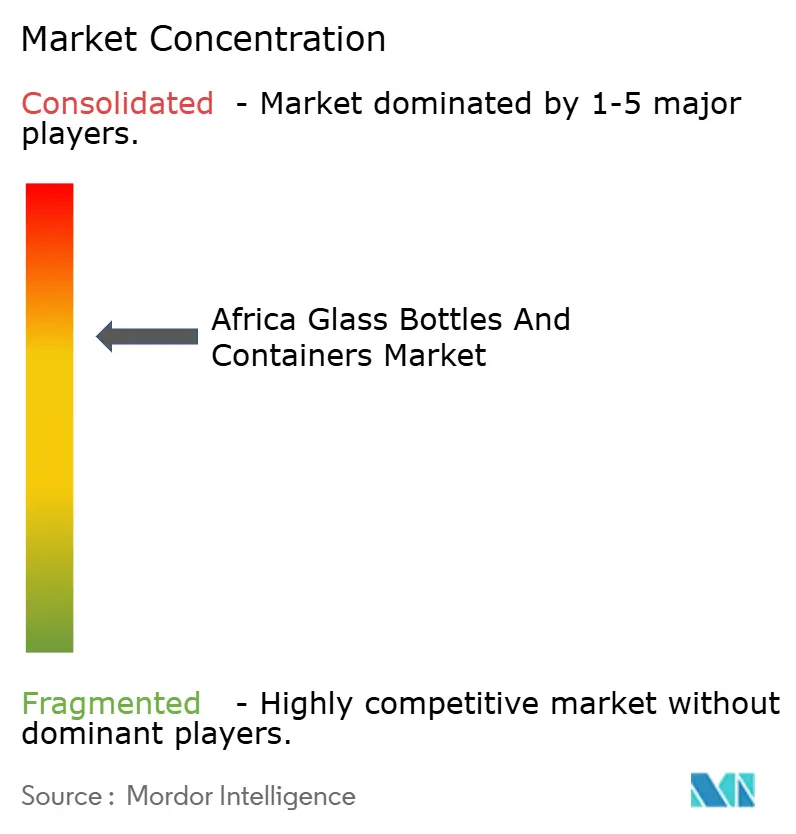
| Market Concentration | Medium |
Major Players *Disclaimer: Major Players sorted in no particular order Image © Mordor Intelligence. Reuse requires attribution under CC BY 4.0. | |
Africa Glass Bottles And Containers Market Analysis by Mordor Intelligence
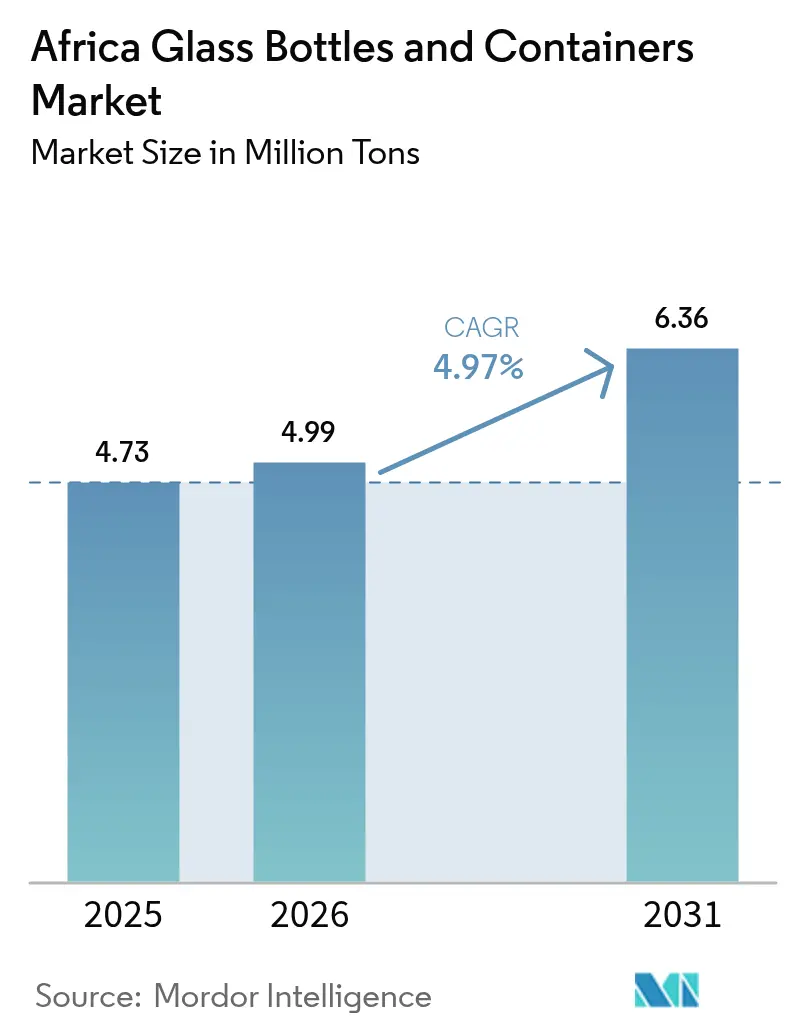
The Africa Glass Bottles and Containers Market size is projected to expand from 4.73 Million tons in 2025 and 4.99 Million tons in 2026 to 6.36 Million tons by 2031, registering a CAGR of 4.97% between 2026 to 2031. Healthy urban beverage demand, widening regulatory preference for fully recyclable packaging, and fresh furnace investments that lower reliance on imports are reinforcing a steady expansion runway. Producers are securing more post-consumer cullet, adopting hybrid furnaces to curb energy risk, and moving closer to large consumption centers to shrink logistics costs. At the same time, the emergence of premium local cosmetics brands, vibrant artisan-spirit launches, and tighter extended producer responsibility (EPR) rules are opening profitable niches for differentiated short-run glass. Competitive intensity is moderate but climbing, with large incumbents defending share through capacity additions while private equity, development finance, and regional champions back new greenfield builds.
Key Report Takeaways
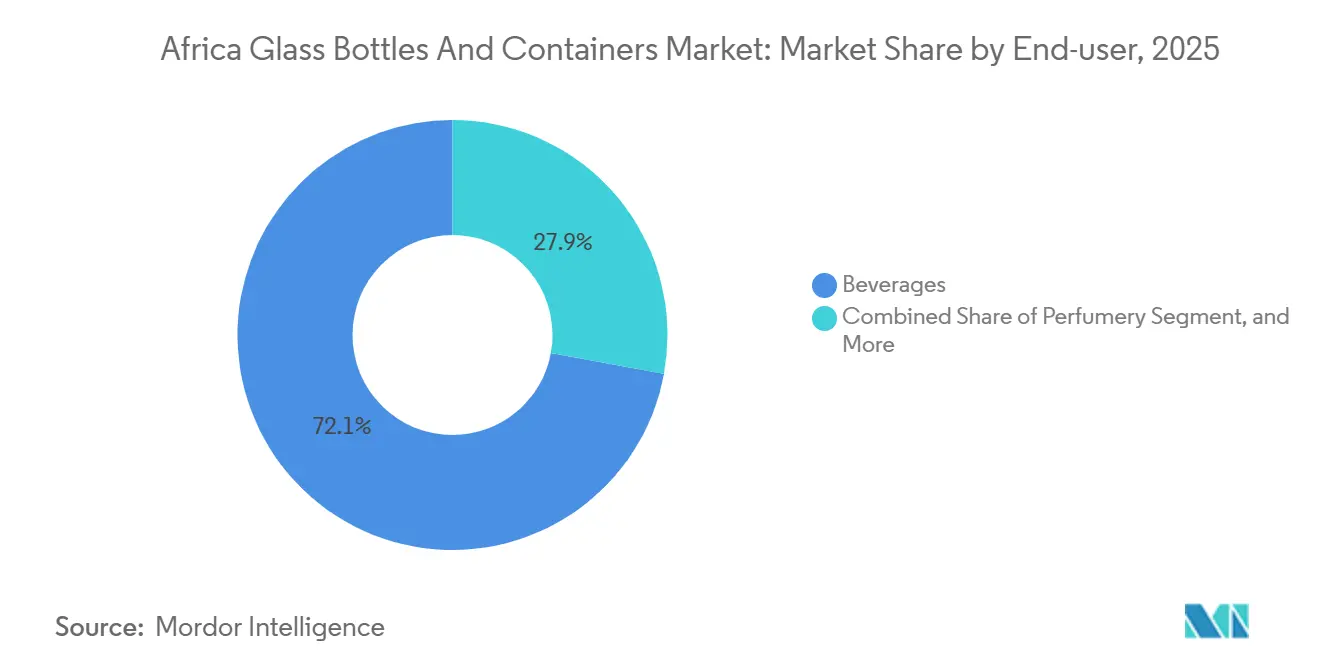
- By end-user, beverages led the Africa Glass Bottles and Containers Market in 2025, accounting for 72.12% of the market volume, while cosmetics and personal care are forecast to grow at a 5.88% CAGR through 2031.
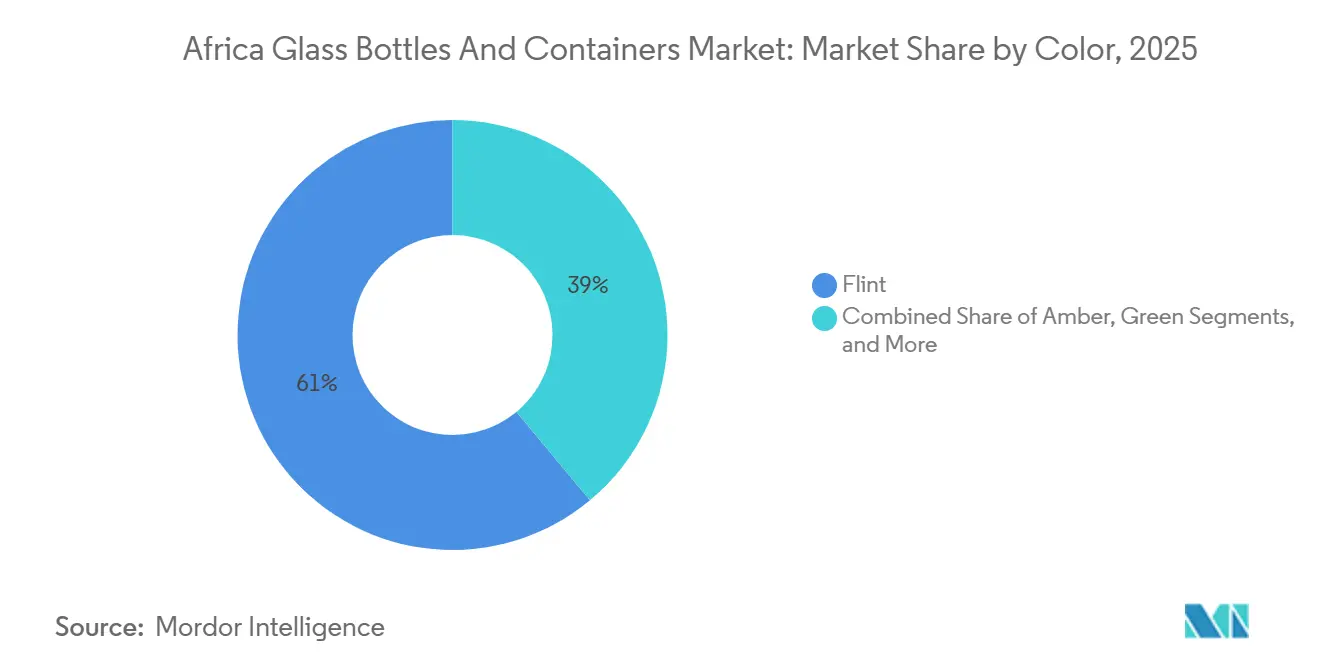
- By color, flint captured 61.04% of the 2025 volume, whereas amber is projected to advance at a 5.73% CAGR to 2031.
- By country, South Africa held 26.32% of the volume of the Africa Glass Bottles and Containers Market in 2025, while Kenya is expected to record the fastest 6.17% CAGR over 2026-2031.
Note: Market size and forecast figures in this report are generated using Mordor Intelligence’s proprietary estimation framework, updated with the latest available data and insights as of 2026.
Market Trends and Insights
Drivers Impact Analysis of Africa Glass Bottles And Containers Market*
| Driver | (~) % Impact on CAGR Forecast | Geographic Relevance | Impact Timeline |
|---|---|---|---|
| Rising Beverage Consumption and Premium-Packaging Demand | +1.2% | Nigeria, Kenya, South Africa, Egypt | Medium term (2-4 years) |
| Regulatory Push for Food-grade, Recyclable Packaging | +0.9% | Kenya, South Africa, Morocco, Egypt | Short term (≤ 2 years) |
| Urban Middle-class Expansion Boosting Beer and CSD Volumes | +1.0% | Nigeria, Kenya, Ethiopia, Tanzania, Ghana | Medium term (2-4 years) |
| AfCFTA-driven Intra-Africa Trade in Glass-packaged Goods | +0.7% | Southern and East Africa corridors | Long term (≥ 4 years) |
| Craft Alcohol and Artisan Spirits Boom | +0.5% | South Africa, Kenya, Nigeria, Ghana | Short term (≤ 2 years) |
| EU CBAM Pressure on Low-carbon Export Packaging | +0.4% | Egypt, Morocco, South Africa (export-oriented plants) | Long term (≥ 4 years) |
| Source: Mordor Intelligence | |||
Rising Beverage Consumption and Premium-Packaging Demand
Africa’s accelerating thirst for branded beer, spirits, and carbonated soft drinks is lifting high-value glass demand far faster than headline population growth. East African Breweries recovered more than 17 million returnable bottles in fiscal 2024-2025, evidence that refillable glass stays core to beer economics even as PET advances in water and juice.[1] Craft distillers such as Kenya’s Procera Gin now specify embossing, screen-printing, and bespoke closures, pushing converters toward shorter production runs with higher unit margins. In West Africa, Beta Glass booked NGN 78.2 billion (USD 97.4 million) first-half 2025 revenue, underscoring steady pull-through from beverage fillers.[2] As middle-income cohorts mature and premiumize consumption, this driver is expected to add about 1.2 percentage points to the baseline CAGR.
Regulatory Push For Food-grade, Recyclable Packaging
Governments are tightening disposal and safety standards, tilting the playing field toward infinitely recyclable glass. Kenya’s 2024 EPR rules introduced a KSh 150 import levy on each glass item and mandated producers to take-back schemes, effectively shielding local output from low-cost imports. A South African feasibility study showed that a ZAR 1 deposit can raise collection to 90%, diverting roughly 305,000-477,000 tons from landfills. The African Union’s 2024-2034 Circular Economy Action Plan fixes a 30% recycling target, giving manufacturers confidence to scale cullet infrastructure. These steps are forecast to lift the CAGR by 0.9 percentage points, with the sharpest early gains in Kenya and South Africa, where enforcement is already visible.
Urban Middle-class Expansion Boosting Beer And CSD Volumes
Rapid urbanization means more disposable income and a formal retail environment where packaged beverages dominate. Nigeria’s population now exceeds 235 million, with a median age of 18, a demographic dividend that beverage fillers are racing to serve. Beta Glass operates five domestic lines and commands roughly 70% of Nigerian glass-container demand, anchoring stable furnace utilization. In Kenya, the Consol-owned Central Glass Industries plant supplies East African Breweries at competitive landed cost benchmarks. As new bottling plants and refrigerated distribution fleets come on-stream, this driver adds around 1.0 percentage point to growth mid-decade.
AfCFTA-driven Intra-Africa Trade In Glass-packaged Goods
The Africa Continental Free Trade Area is lowering duties and border friction, letting scale suppliers backfill neighbors short on capacity. South Africa exported USD 51.6 million of glass bottles in 2022, mainly to Mozambique, Namibia, and Zimbabwe, a corridor where tariff lines have already dropped. Saint-Gobain Egypt aims to lift annual exports from EUR 60 million (USD 65.4 million) to EUR 120 million (USD 130.8 million) by leveraging the block’s single-window customs system. Over the long term, harmonized standards and new rail links are expected to add 0.7 percentage points to market CAGR.
Restraints Impact Analysis of Africa Glass Bottles And Containers Market*
| Restraint | (~) % Impact on CAGR Forecast | Geographic Relevance | Impact Timeline |
|---|---|---|---|
| Proliferation of PET and Aluminium Lightweight Formats | -0.8% | Nigeria, Kenya, Egypt, South Africa | Short term (≤ 2 years) |
| High Energy-input and Power-reliability Costs | -0.6% | Nigeria, South Africa, Egypt, Tanzania | Medium term (2-4 years) |
| Limited Food-grade Cullet Availability Due to Inefficient Collection Networks | -0.4% | Nigeria, Kenya, Ghana, Ethiopia | Medium term (2-4 years) |
| Currency Volatility and Soda-ash Import Tariffs | -0.3% | Nigeria, Kenya, Egypt, Tanzania | Short term (≤ 2 years) |
| Source: Mordor Intelligence | |||
Proliferation of PET and aluminium lightweight formats
Cheaper, lighter plastics and cans are capturing share in soft drinks, water, and entry-level wine. Coca-Cola Hellenic Bottling Company opened a Lagos PET hub capable of converting 13,000 tons annually into food-grade rPET, intensifying brand owner preference for single-trip plastic in on-the-go channels.[3] A recent International Aluminium Institute study placed glass at the top of the cost and emissions ladder per unit, reinforcing beverage firms’ multiformat hedging. Bag-in-box already accounted for 49.4% of South African domestic wine packaging in 2023, underscoring the pressure on glass displacement. Collectively, these forces are expected to dilute CAGR by 0.8 percentage points over the near term.
High Energy-input And Power-reliability Costs
Furnaces operate above 1,500 °C and require continuous power; frequent load shedding and high tariffs inflate melt costs. Africa generated 952.9 TWh in 2025, 75% from thermal sources, yet industrial users still endure brownouts that force diesel genset backups.[4] Capital-intensive solar arrays help, but payback stretches longer amid volatile feed-in tariffs. The African Development Corporation’s 2024 competitiveness review listed energy unreliability among the top three constraints for glassmaking. This drawback is projected to shave 0.6 percentage points off CAGR in the medium term, while hybrid furnace adoption gradually improves resilience.
*Our forecasts treat driver/restraint impacts as directional, not additive. The impact forecasts reflect baseline growth, mix effects, and variable interactions.
Africa Glass Bottles And Containers Market Segment Analysis
By End-user:
Beverages Dominate While Cosmetics AcceleratesBeverages accounted for 72.12% of 2025 volume, anchoring the Africa glass bottles and containers market leadership stack. Beer is the single largest sub-category, but premium spirits and wine sustain higher unit margins, especially in South Africa’s export-focused Western Cape. East African Breweries’ recovery of more than 17 million returnable bottles in fiscal 2024-2025 signals the entrenched dominance of refillable loops that favor glass over disposables. Non-alcoholic brands still lean on PET for value lines, though fluted glass remains the packaging of choice for premium juices.
Cosmetics and personal care is projected to grow at 5.88% through 2031, the fastest among all uses. Rising disposable income, strong adoption of online beauty, and the cachet of glass in fragrance and serums underpin demand. Arab Pharmaceutical Glass Company operates three furnaces, producing 1.25 million containers a day for pharma and beauty clients, demonstrating that quality-certified supply is available in-region. With global specialist Gerresheimer divesting its moulded-glass unit, regional converters see an opportunity to fill capability gaps and shorten lead times.

By Color:
Flint Still Ahead, Amber Closes The GapFlint held a 61.04% share by volume in 2025, confirming broad adoption across spirits, clear beverages, and food preserves. Central Glass Industries and Isanti Glass both leverage multi-color lines but still dedicate the lion’s share of furnace pull to transparent flint, citing steady reorder visibility from multinational fillers. Returnable formats for beer and CSDs also remain largely clear, as visibility supports consumer trust in refill schemes.
Amber is forecast to post a 5.73% CAGR, outpacing all other hues. Its ultraviolet barrier suits light-sensitive beer, pharma syrups, and essential oils. Kandil Glass, operating two plants with a 420-ton-per-day capacity, allocates an increasing proportion of pull to amber for export orders bound for Europe and North America. As regional pharma regulations favor photoprotective packaging and craft brewers upgrade shelf stability, amber’s share gain looks durable.n looks durable.
Geography Analysis
South Africa Glass Bottles and Containers Market
South Africa leads the Africa glass bottles and containers market with 26.32% of the 2025 volume, supported by deep furnace infrastructure and reliable cullet pipelines. Ardagh, post-Consol takeover, now exports to more than 15 African destinations and is piloting hybrid-furnace upgrades that blend natural gas and electricity to temper carbon intensity. The Glass Recycling Company’s nationwide network pays service fees to over 60,000 waste pickers, sustaining one of the continent’s highest recovery rates.
Kenya Glass Bottles and Containers Market
Kenya is turning into East Africa’s manufacturing springboard. The country is on track for a 6.17% CAGR through 2031, the fastest in the region. The Central Glass Industries plant, now under Consol, benefits from its proximity to Port Mombasa, allowing it to backfill landlocked neighbors. Bottlers increasingly localize supply after the 2024 KSh 150 per-item import fee, improving glass order visibility for domestic converters.
North and Sub-Saharan Africa Glass Bottles and Containers Market
Egypt and Morocco provide northern anchors. Kandil Glass exports 60% of its 750 million-container annual output, leveraging free-trade access to the European Union. Saint-Gobain Egypt will double exports to EUR 120 million (USD 130.8 million) once its Ain Sokhna plant comes fully on-stream. Rest-of-Africa markets such as Ghana, Tanzania, and Ethiopia are smaller but benefit from AfCFTA tariff relief and new soda-ash projects that promise raw-material self-sufficiency.
Regulatory Landscape
Regulation affecting glass bottles and containers across Africa is tightening around end-of-life responsibility and cross-border technical alignment, with Kenya and the East African Community (EAC) acting as key reference points. Kenya enacted the Sustainable Waste Management (Extended Producer Responsibility) Regulations in 2024, requiring packaging producers (including glass) to register with the National Environment Management Authority (NEMA) and operate take-back or deposit-refund mechanisms. This raises compliance and collection-system requirements for fillers and converters operating in the country.
Trade and standards dynamics are also creating both protection and friction. In May 2026, Kenya published the Finance Bill 2026 with a proposal to remove the excise-duty exemption for glass bottles originating from EAC partner states, which prompted a protest by Tanzania-based Kioo Limited and increased scrutiny of regional supply chains. Separately, the Rwanda Standards Board circulated a WTO TBT notification in January 2026 referencing draft regional guidance (DEAS 935:2025) for the manufacture and use of glass containers, signaling continued movement toward harmonized container requirements across the EAC to support pre-packaged food and cosmetics trade.
Competitive Landscape
The Africa glass bottles and containers market remains moderately concentrated, yet capacity is expanding. Ardagh Group, after its USD 1 billion Consol deal, controls the continent’s largest footprint across South Africa, Nigeria, Kenya, and Ethiopia. Beta Glass, about to be acquired by Helios Investment Partners for nearly EUR 100 million (USD 109.2 million), operates five lines and holds a dominant 70% share in Nigeria.
Middle East Glass and Kandil Glass anchor Egyptian supply, with 420 tons per day of installed pull and international regulatory certifications that attract multinationals. Smaller disruptors such as Isanti Glass in South Africa and African Glass Limited in Kenya focus on agile, custom-run production with faster lead times to cosmetics and craft spirits customers.
Strategic moves center on vertical integration into cullet collection, energy efficiency, and geographic diversification. Ardagh’s Money4Glass recycling incentive and Beta Glass’s February 2025 cullet network upgrade both a higher recycled content quotas. Technology investments include hybrid melters, electric boosting, and oxy-fuel trials aimed at trimming energy bills and CO₂ taxes. Exit strategies by global majors such as Gerresheimer, which is divesting moulded-glass plants outside Africa, may free up assets or know-how partnerships for African buyers.
Africa Glass Bottles And Containers Industry Leaders
-
Ardagh Group S.A.
-
Verallia Packaging S.A.S.
-
O-I Glass, Inc.
-
Beta Glass PLC
-
Middle East Glass Manufacturing Company S.A.E.
- *Disclaimer: Major Players sorted in no particular order
Africa Glass Bottles And Containers Market Companies Covered in this Report
- Ardagh Group S.A.
- Beta Glass PLC
- Consol Glass Pty Ltd
- O-I Glass, Inc.
- Verallia Packaging S.A.S.
- Isanti Glass 1 (Pty) Ltd
- Kandil Glass
- Middle East Glass Manufacturing Company S.A.E.
- Saverglass SAS
- African Glass Limited
- The National Company for Glass and Crystal S.A.E.
- Gerresheimer AG
- Arab Pharmaceutical Glass Company S.A.E.
- Dalgen Packaging CC
- Nampak Limited
- United Glass Containers Company (UGC)
- Société d'Exploitation de Verreries au Maroc (SEVAM)
Read Analysis of Africa Glass Bottles And Containers Companies
Market Opportunities and Future Outlook
Investment and ownership changes are creating opportunities across capacity additions, import substitution, and regional distribution. In West Africa, Helios Investment Partners completed the acquisition of controlling interests in Beta Glass PLC in February 2026, bringing fresh capital and an explicit cross-border expansion lens aligned with AfCFTA-driven trade in glass-packaged beverages and foods. In North Africa, BA Glass acquired a significant equity stake in Tunisia-based Sotuver in April 2026 (with Bayahi Group), expanding the strategic toolkit for multinational and regional fillers seeking shorter lead times, broader mold libraries, and more reliable supply across Mediterranean and African corridors.
Two operational themes shape near-term opportunities: (1) supply-side reinforcement through furnace rebuilds and new assets, and (2) circular-economy build-out to secure food-grade cullet. Beta Glass completed a furnace rebuild at its Delta plant in October 2025, adding incremental daily capacity and supporting higher utilization without greenfield lead times. Upstream, Ghana initiated construction steps for a USD 250 million glass project in Shama in February 2026 (float glass), which can affect local raw-material ecosystems and downstream fabrication ambitions even if it is not container-specific. Across Africa, Kenya’s EPR enforcement and South Africa’s established recycling networks continue to shift economics toward organized collection and higher recycled content, favoring container producers that integrate cullet sourcing, beneficiation, and compliant take-back partnerships.
Recent Industry Developments in Africa Glass Bottles And Containers Market
- February 2026: Helios Investment Partners finalized the acquisition of controlling interests in Beta Glass PLC on February 5, 2026. The transaction consolidates ownership in Nigeria's container-glass supply base and supports a more export-oriented footprint across West and Central Africa.
- October 2025: Beta Glass completed a furnace rebuild (DF1) at its Delta plant in Nigeria, with the company later highlighting the work as a key step-up in efficiency and capacity. The rebuild extends asset life and increases supply reliability for beverage and food customers that depend on short lead times and stable bottle availability.
- June 2024: Beta Glass activated an upgraded GF1 furnace at its Agbara plant to raise production capacity. This upgrade strengthened domestic supply coverage and helped the company defend share against imports and alternative packaging formats by improving throughput on core bottle lines.
Africa Glass Bottles And Containers Market Report Scope and Research Methodology
Market Definition and Coverage
For this study, the market covers glass bottles and glass containers used for packaging across Africa, and it is sized using physical demand flows linked to key end uses like beverages and food.
Scope exclusions: Excludes non-container glass products (such as flat glass and fiberglass) and excludes packaging made from plastics or metals.
Segments Covered in This Report
- By End-user
- Beverages
- Alcoholic
- Beer
- Wine
- Spirits
- Other Alcoholic Beverages (Cider and Other Fermented Drinks)
- Non-Alcoholic
- Juices
- Carbonated Drinks (CSDs)
- Dairy Product Based Drinks
- Other Non-Alcoholic Beverages
- Alcoholic
- Food (Jam, Jelly, Marmalades, Honey, Sausages and Condiments, Oil, Pickles)
- Cosmetics and Personal Care
- Pharmaceuticals (excluding Vials and Ampoules)
- Perfumery
- Beverages
- By Color
- Green
- Amber
- Flint
- Other Colors
- By Country
- Egypt
- Nigeria
- Kenya
- Morocco
- South Africa
- Rest of Africa
Data Sources, Market Sizing, and Validation
Desk Research
Desk research was used to set the initial country picture for glass bottles and containers in Africa, and to pressure-test early assumptions before interviews were started. We relied on public sources such as UN Comtrade trade statistics, UN Industrial Development Organization industrial indicators, World Bank macro series, and national statistics offices for population, income, and manufacturing signals that relate to packaged goods output.
To connect packaging demand with end-use activity, we also reviewed sources such as Food and Agriculture Organization datasets (for processed food and beverage indicators), public customs and port updates where available, and packaging or sustainability policy notes published by regulators. Company annual reports, investor presentations, and reputable press were used to track capacity moves and furnace rebuild cycles. We then used a paid company financials and intelligence subscription and an import and export shipment-level database selectively to cross-check scale and trade direction. The sources listed here are illustrative and not exhaustive, and many other public and paid references were used to collect data, validate assumptions, and clarify inconsistencies.
Primary Interviews and Surveys
Primary work focused on validating how glass bottles and containers are ordered, substituted, and supplied in different African markets, especially where official production series are incomplete. We spoke with a mix of manufacturers, distributors, and large end users such as beverage fillers and food packers, and then used follow-up discussions to confirm utilization ranges, import penetration, and the pace of lightweighting (which changes tonnage per container).
Distribution of primary research fieldwork respondents
| Company type | Respondent position |
|---|---|
| Top tier: 25% | CXOs: 17% |
| Mid tier: 58% | Functional/Unit leaders: 26% |
| Smaller Players: 17% | Managers: 57% |
Market-Sizing & Forecasting
Sizing used a top-down and bottom-up model, where the top-down side reconstructed country demand from container glass production, net trade movements, and packaged goods consumption signals. Where production reporting was patchy, trade was used as an anchor and then adjusted for known local manufacturing footprints and typical lead times.
To keep results tied to real activity, we used selective bottom-up approximations, such as sampled plant capacities and utilization bands collected in interviews, followed by a reasonableness check using container intensity for major end uses like beer, spirits, carbonated drinks, edible oils, and sauces. The inputs that mattered most were furnace capacity and rebuild schedules, import share trends by country, packaged beverage and processed food output indicators, shifts toward returnable bottles, and lightweighting rates that can reduce tonnage even when container counts rise.
Forecasts were built using scenario analysis. Macro demand drivers such as population and income direction, packaged beverage mix, and trade policy friction were translated into volume growth paths, then aligned with what interviewees expected for capacity additions and substitution pressure from alternative packaging. Where bottom-up signals were incomplete, we handled gaps through conservative utilization bands and then cross-checked against trade movement and end-use ratios to avoid overstatement.
Data Validation & Update Cycle
Outputs were reviewed in several steps so the final series did not rely on any one dataset or a single interview viewpoint. We compared implied consumption per capita and import reliance against known market realities, and any unusual jumps were traced back to the underlying production, trade, or utilization assumption and corrected.
Before sign-off, a separate analyst review is completed, including variance checks across countries and reconciliation of trend lines versus material events like furnace shutdowns or policy changes. Reports are refreshed annually, and interim updates are triggered when major events occur. After that, a fresh pass is completed before delivery so clients receive the latest view.
Mordor Intelligence's Africa Glass Bottles and Containers Market Estimate Compared With Other Published Estimates
Published market sizes for glass bottles and containers can differ because sources do not always align on geography, unit of measurement, and which container types are counted. Another common reason is that some figures are built as revenue totals, where the assumed price level and the exchange-rate timing can shift the USD value noticeably.
The table highlights this gap pattern, because in Mordor Intelligence's model the Africa market is expressed in million tons for container glass bottles and containers, whereas other sources commonly publish USD values for Middle East plus Africa glass packaging or container glass that can blend in wider packaging types and different price progressions.
Benchmark comparison
| Source | Market Size | Gaps in Research Methodology |
|---|---|---|
| Mordor Intelligence | USD 4.99 M (2026) | |
| Industry Portal A | USD 5.45 B (2025) | Uses Middle East plus Africa glass packaging revenue, which typically includes jars and other glass packaging types, and the USD total is sensitive to average selling price assumptions and currency conversion timing. |
| Market Publisher B | USD 7.74 B (2025) | Reports Middle East plus Africa container glass in value terms, and may apply a broader bottle set and different end-use boundaries, which can lift totals when regional pricing and mix are modeled aggressively. |
Across the three lines, the dispersion is mainly explained by volume versus value reporting and by regional scope expansion beyond Africa, and then amplified by how prices and currencies are applied. By tying the size build to production, trade movement, and capacity utilization checks, we can keep the result traceable to practical inputs and repeatable steps.
Key Questions Answered in the Report
What is the current size and growth outlook for Africa’s glass container sector?
The Africa glass bottles and containers market size stood at 4.99 million tons in 2026 and is projected to reach 6.36 million tons by 2031, reflecting a 4.97% CAGR.
Which end-user category drives the highest demand for glass bottles in Africa?
Beverages dominate with 72.12% share, propelled by beer, spirits and carbonated soft drinks that value glass for product protection and premium branding.
Why is South Africa considered the fastest-growing geography?
Major furnace investments following Ardagh’s Consol acquisition, coupled with Extended Producer Responsibility rules that favor glass recyclability, push South Africa’s forecast CAGR to 6.37%.
How are regulatory changes influencing material choice?
New EPR frameworks in South Africa, Kenya and other markets mandate higher recycling targets, making fully recyclable glass more attractive than multi-layer plastics.
What technologies help producers offset high energy costs?
Lightweighting via thin-wall designs, higher cullet ratios, waste-heat recovery and the gradual introduction of electric or hybrid furnaces reduce specific energy consumption and CO2 emissions.
What are the main competitive strategies among leading suppliers?
Market leaders focus on capacity expansions, lightweighting R&D, circular-economy partnerships and geographic diversification to capture intra-Africa trade opportunities.