Africa Fertilizer Market Size

| Icons | Lable | Value |
|---|---|---|
|
|
Study Period | 2016 - 2028 |
|
|
Market Size (2024) | USD 9.10 Billion |
|
|
Market Size (2028) | USD 12.01 Billion |
|
|
Largest Share by Crop Type | Field Crops |
|
|
CAGR (2024 - 2028) | 7.18 % |
|
|
Largest Share by Country | South Africa |
Major Players |
||
|
|
||
|
*Disclaimer: Major Players sorted in no particular order |
Africa Fertilizer Market Analysis
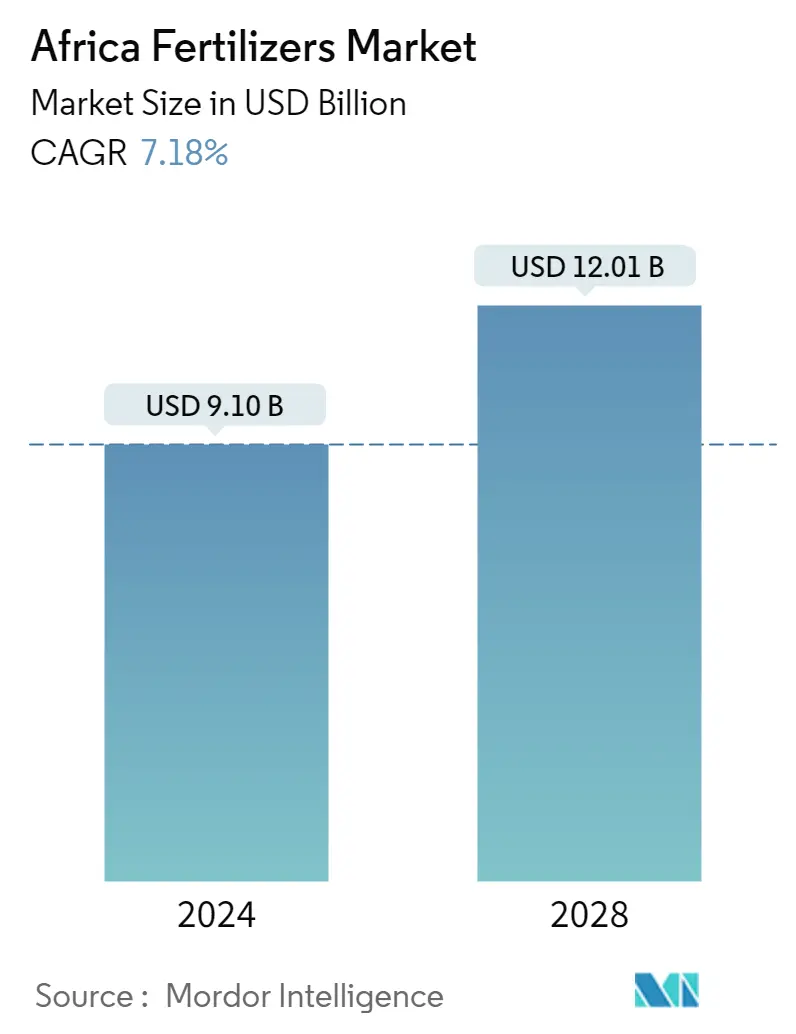
The Africa Fertilizers Market size is estimated at USD 9.10 billion in 2024, and is expected to reach USD 12.01 billion by 2028, growing at a CAGR of 7.18% during the forecast period (2024-2028).
- Fastest growing segment by Product - Iron : The alkaline soils with high pH and degrading health and quality of soils are making them deficient in Iron thus increasing the demand for high-yield crop production.
- Largest Segment by Crop Type - Field Crops : The domination of field crops in Africa Fertilizers market is mainly due to its large cultivation area in the region. They account for more than 95% of total crop area.
- Fastest growing by Speciality Type - Water Soluble : The watersoluble fertilizer absorption rate is more than double compared to conventional fertilizers reaching an efficiency of about 80-90% and reducing total fertilizer use.
- Largest segment by Country - South Africa : The crop yields in the country are relatively low compared to the global average and so the need for higher productivity is driving the fertilizer usage in South Africa
Africa Fertilizer Market Trends
This section covers the major market trends shaping the Africa Fertilizers Market according to our research experts:
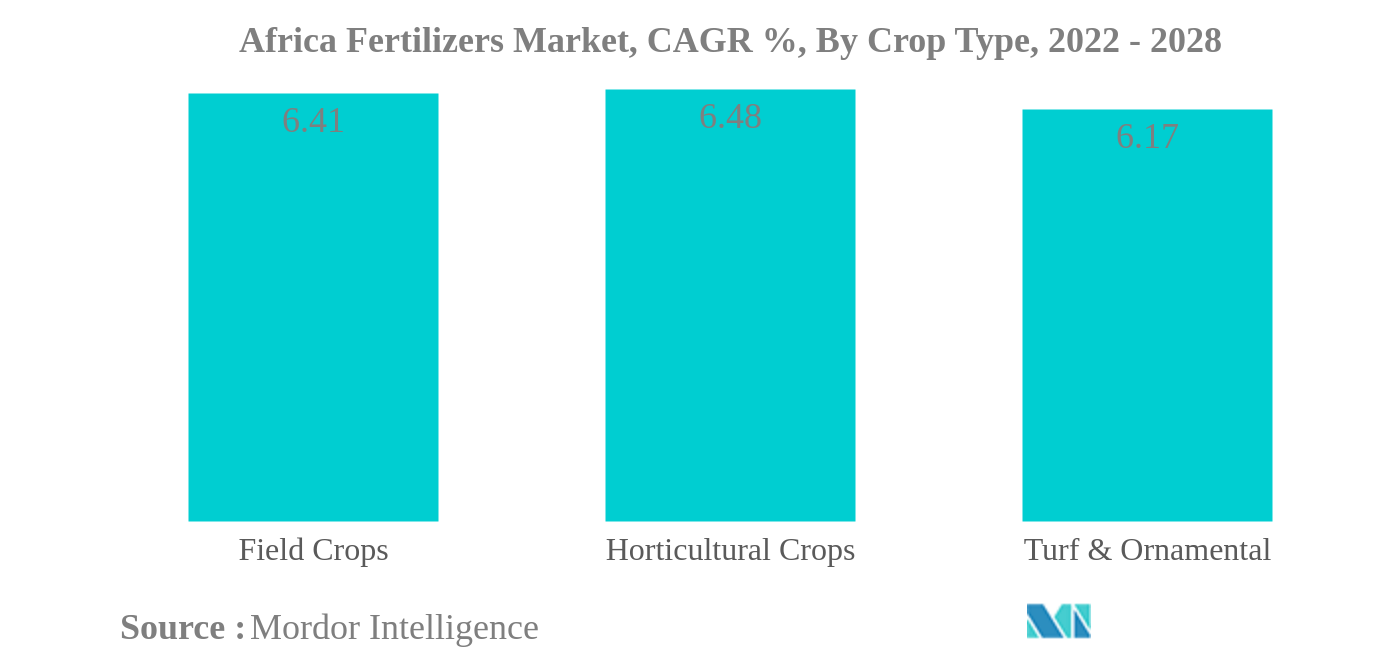
Field Crops is the largest segment by Crop Type.
- Field crops consume the most amount of fertilizers, accounting for 88.0% of the total fertilizer consumption in Africa. The consumption volume of these crops was 3.0 million metric tons in 2021, valued at USD 7.80 billion.
- Turf and ornamental crops ranked second and accounted for a share of 9.0% in the consumption of fertilizers in Africa in 2021. The market was valued at USD 829.6 million in 2021, with a volume consumption of 489.5 metric tons, owing to the growing demand for African flowers in the international markets.
- The horticultural crops accounted for just 3.0% of the total fertilizer consumption in Africa, valued at USD 230.1 million, in 2021, with a volume consumption of 133.9 thousand metric tons. However, the area under the cultivation of horticultural crops increased from 36.5 million hectares in 2016 to 37.7 million hectares in 2021. This increase in area was due to the growing demand for high-value crops like fruits and vegetables in the region, with increasing cases of hidden hunger and malnutrition. The need for higher productivity per hectare of these crops will increase the application of fertilizers in horticultural crops.
- The use of specialty fertilizers is increasing due to their ease of handling and application. The increase in the adoption of micro-irrigation systems is increasing the usage of specialty fertilizers.
- The application of fertilizers in the respective crop types is anticipated to grow during the forecast period, owing to the increasing need for food to feed the growing populations, for obtaining higher yields, and for crop productivity to meet the demand for respective crops.
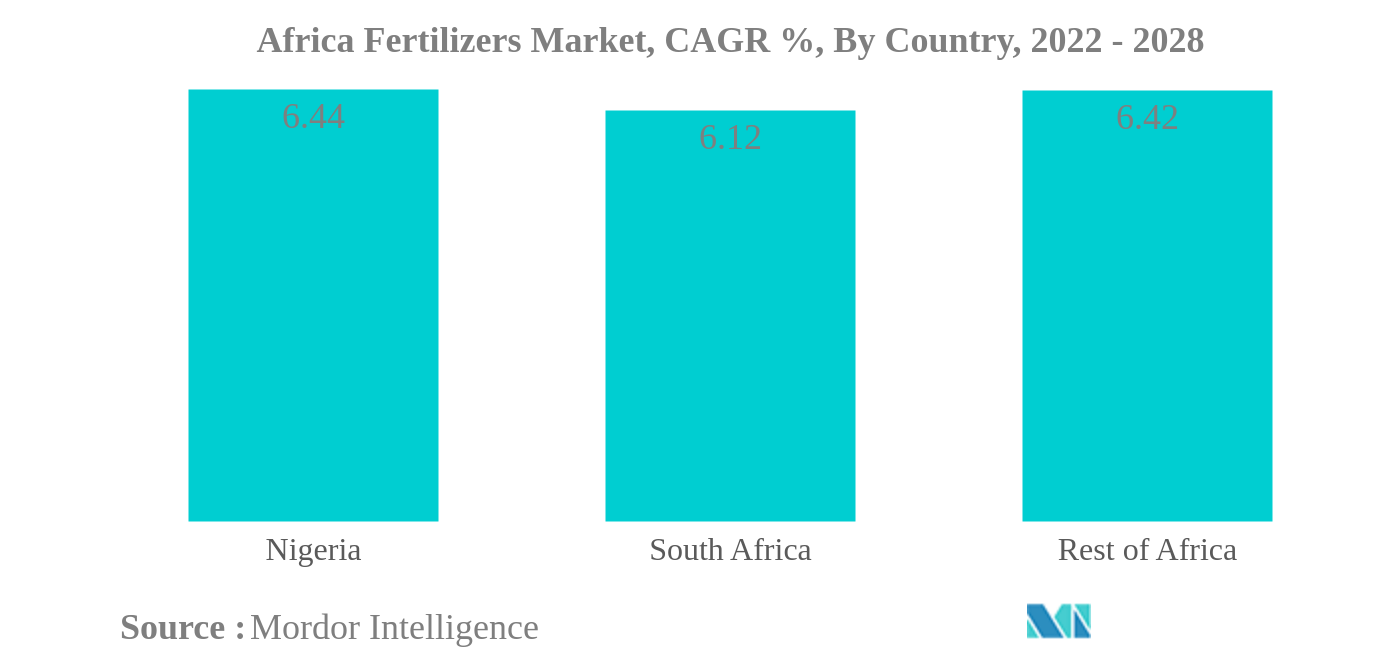
South Africa is the largest segment by Country.
- Africa has the potential to become a major fertilizer market as the region has abundant mineral reserves of three major plant macronutrients: nitrogen, phosphate, and potash. The continent is also subject to rapid population and income growth, along with changing food consumption habits. The pace and diversification of the region’s food needs may require the region’s farmers to increase agricultural production and yields, which is anticipated to boost fertilizer demand.
- South Africa is one of the major agriculture-producing countries in the continent and is import-dependent. All the potassic fertilizers are consumed domestically, and 60%-70% of nitrogenous fertilizers are imported. The South African fertilizer market has been operating in a deregulated environment, with no import tariffs or government-sponsored schemes.
- In this deregulated environment, the prices of fertilizers marketed in the country are highly influenced by currency exchange rates (ZAR/USD), overseas prices, and shipping costs. Thus, the growers are aiming for the long-term sustainability of high-quality grain production. Although crop rotations play an important role in maintaining and improving soil fertility, fertigation of the soil remains the major source of nutrient supply to the soil to balance the soil nutrient, as these are periodically consumed due to continuous production.
- According to the Food and Agriculture Organization, Nigeria has one of the highest rice consumption rates worldwide, producing 7 million metric tons of rice annually. The country’s economic growth over the last five years has been driven by growth in the agricultural sector, which is anticipated to boost the segment's growth during the forecast period.
Africa Fertilizer Industry Overview
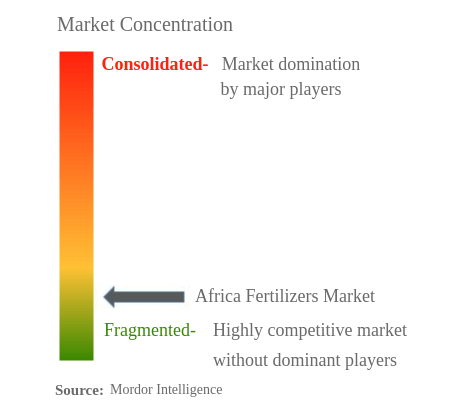
The Africa Fertilizers Market is fragmented, with the top five companies occupying 22.12%. The major players in this market are Foskor, ICL GROUP LTD, K+S AKTIENGESELLSCHAFT, UPL Limited and Yara International ASA, (sorted alphabetically).
Africa Fertilizer Market Leaders
Foskor
ICL GROUP LTD
K+S AKTIENGESELLSCHAFT
UPL Limited
Yara International ASA,
*Disclaimer: Major Players sorted in no particular order
Africa Fertilizer Market News
- November 2021: UPL Africa 'soft launched' its revolutionary crop monitoring and digital platform called CropVision. It uses the newest, and highly accurate, satellite data technology enabling the UPL exclusive distributors, their representatives and farmers to continuously monitor thousands of hectares from a single online platform.
- April 2019: Kynoch announced Mergers & Acquisitions of Profert Fertilizer a major role player in the granular and liquid fertilizer industry. This transaction will give Kynoch access to new markets and additional production resources, ultimately contributing to their motto of enhancing efficiency through innovation.
- March 2019: Kynoch Fertilizer, a leading plant nutrient producer and distributor, announced the Mergers & Acquisitions of Sidi Parani to build a substantial position in the fertilizer market in South Africa and Africa.
Africa Fertilizer Market Report - Table of Contents
1. EXECUTIVE SUMMARY & KEY FINDINGS
2. REPORT OFFERS
3. INTRODUCTION
3.1. Study Assumptions & Market Definition
3.2. Scope of the Study
3.3. Research Methodology
4. KEY INDUSTRY TRENDS
4.1. Acreage Of Major Crop Types
4.2. Average Nutrient Application Rates
4.3. Regulatory Framework
4.4. Value Chain & Distribution Channel Analysis
5. MARKET SEGMENTATION
5.1. Type
5.1.1. Complex
5.1.2. Straight
5.1.2.1. Micronutrients
5.1.2.1.1. Boron
5.1.2.1.2. Copper
5.1.2.1.3. Iron
5.1.2.1.4. Manganese
5.1.2.1.5. Molybdenum
5.1.2.1.6. Zinc
5.1.2.1.7. Others
5.1.2.2. Nitrogenous
5.1.2.2.1. Ammonium Nitrate
5.1.2.2.2. Urea
5.1.2.2.3. Others
5.1.2.3. Phosphatic
5.1.2.3.1. DAP
5.1.2.3.2. MAP
5.1.2.3.3. SSP
5.1.2.3.4. TSP
5.1.2.4. Potassic
5.1.2.4.1. MoP
5.1.2.4.2. SoP
5.1.2.5. Secondary Macronutrients
5.1.2.5.1. Calcium
5.1.2.5.2. Magnesium
5.1.2.5.3. Sulfur
5.2. Form
5.2.1. Conventional
5.2.2. Speciality
5.2.2.1. CRF
5.2.2.2. Liquid Fertilizer
5.2.2.3. SRF
5.2.2.4. Water Soluble
5.3. Application Mode
5.3.1. Fertigation
5.3.2. Foliar
5.3.3. Soil
5.4. Crop Type
5.4.1. Field Crops
5.4.2. Horticultural Crops
5.4.3. Turf & Ornamental
5.5. Country
5.5.1. Nigeria
5.5.2. South Africa
5.5.3. Rest Of Africa
6. COMPETITIVE LANDSCAPE
6.1. Key Strategic Moves
6.2. Market Share Analysis
6.3. Company Landscape
6.4. Company Profiles
6.4.1. Foskor
6.4.2. Gavilon South Africa
6.4.3. Haifa Group Ltd
6.4.4. ICL GROUP LTD
6.4.5. K+S AKTIENGESELLSCHAFT
6.4.6. Kynoch Fertilizer
6.4.7. Omnia Nutriology
6.4.8. UPL Limited
6.4.9. Yara International ASA,
7. KEY STRATEGIC QUESTIONS FOR FERTILIZER CEOS
8. APPENDIX
8.1. Global Overview
8.1.1. Overview
8.1.2. Porter's Five Forces Framework
8.1.3. Global Value Chain Analysis
8.1.4. Market Dynamics (DROs)
8.2. Sources & References
8.3. List of Tables & Figures
8.4. Primary Insights
8.5. Data Pack
8.6. Glossary of Terms
List of Tables & Figures
- Figure 1:
- AFRICA MARKET, AREA YOY GROWTH RATE, 2016 - 2021
- Figure 2:
- AFRICA MARKET, AREA YOY GROWTH RATE, 2016 - 2021
- Figure 3:
- AFRICA MARKET, VOLUME YOY GROWTH RATE, 2021 - 2021
- Figure 4:
- AFRICA MARKET, VOLUME YOY GROWTH RATE, 2021 - 2021
- Figure 5:
- AFRICA MARKET, VOLUME YOY GROWTH RATE, 2021 - 2021
- Figure 6:
- AFRICA MARKET, VOLUME YOY GROWTH RATE, 2021 - 2021
- Figure 7:
- AFRICA MARKET, VOLUME YOY GROWTH RATE, 2021 - 2021
- Figure 8:
- AFRICA MARKET, VOLUME YOY GROWTH RATE, 2021 - 2021
- Figure 9:
- AFRICA FERTILIZERS MARKET, VOLUME, METRIC TON, 2016 - 2028
- Figure 10:
- AFRICA FERTILIZERS MARKET, VALUE, USD, 2016 - 2028
- Figure 11:
- AFRICA FERTILIZERS MARKET, BY TYPE, VOLUME, METRIC TON, 2016 - 2028
- Figure 12:
- AFRICA FERTILIZERS MARKET, BY TYPE, VALUE, USD, 2016 - 2028
- Figure 13:
- AFRICA FERTILIZERS MARKET, VOLUME SHARE(%), BY TYPE, 2016 - 2028
- Figure 14:
- AFRICA FERTILIZERS MARKET, VALUE SHARE(%), BY TYPE, 2016 - 2028
- Figure 15:
- AFRICA FERTILIZERS MARKET, BY TYPE, COMPLEX, METRIC TON, 2016 - 2028
- Figure 16:
- AFRICA FERTILIZERS MARKET, BY TYPE, COMPLEX, USD, 2016 - 2028
- Figure 17:
- AFRICA FERTILIZERS MARKET, VALUE SHARE(%), BY CROP TYPE, 2016 - 2028
- Figure 18:
- AFRICA FERTILIZERS MARKET, BY NUTRIENT, VOLUME, METRIC TON, 2016 - 2028
- Figure 19:
- AFRICA FERTILIZERS MARKET, BY NUTRIENT, VALUE, USD, 2016 - 2028
- Figure 20:
- AFRICA FERTILIZERS MARKET, VOLUME SHARE(%), BY NUTRIENT, 2016 - 2028
- Figure 21:
- AFRICA FERTILIZERS MARKET, VALUE SHARE(%), BY NUTRIENT, 2016 - 2028
- Figure 22:
- AFRICA FERTILIZERS MARKET, BY PRODUCT, VOLUME, METRIC TON, 2016 - 2028
- Figure 23:
- AFRICA FERTILIZERS MARKET, BY PRODUCT, VALUE, USD, 2016 - 2028
- Figure 24:
- AFRICA FERTILIZERS MARKET, VOLUME SHARE(%), BY PRODUCT, 2016 - 2028
- Figure 25:
- AFRICA FERTILIZERS MARKET, VALUE SHARE(%), BY PRODUCT, 2016 - 2028
- Figure 26:
- AFRICA FERTILIZERS MARKET, BY PRODUCT, BORON, METRIC TON, 2016 - 2028
- Figure 27:
- AFRICA FERTILIZERS MARKET, BY PRODUCT, BORON, USD, 2016 - 2028
- Figure 28:
- AFRICA FERTILIZERS MARKET, VALUE SHARE(%), BY CROP TYPE, 2016 - 2028
- Figure 29:
- AFRICA FERTILIZERS MARKET, BY PRODUCT, COPPER, METRIC TON, 2016 - 2028
- Figure 30:
- AFRICA FERTILIZERS MARKET, BY PRODUCT, COPPER, USD, 2016 - 2028
- Figure 31:
- AFRICA FERTILIZERS MARKET, VALUE SHARE(%), BY CROP TYPE, 2016 - 2028
- Figure 32:
- AFRICA FERTILIZERS MARKET, BY PRODUCT, IRON, METRIC TON, 2016 - 2028
- Figure 33:
- AFRICA FERTILIZERS MARKET, BY PRODUCT, IRON, USD, 2016 - 2028
- Figure 34:
- AFRICA FERTILIZERS MARKET, VALUE SHARE(%), BY CROP TYPE, 2016 - 2028
- Figure 35:
- AFRICA FERTILIZERS MARKET, BY PRODUCT, MANGANESE, METRIC TON, 2016 - 2028
- Figure 36:
- AFRICA FERTILIZERS MARKET, BY PRODUCT, MANGANESE, USD, 2016 - 2028
- Figure 37:
- AFRICA FERTILIZERS MARKET, VALUE SHARE(%), BY CROP TYPE, 2016 - 2028
- Figure 38:
- AFRICA FERTILIZERS MARKET, BY PRODUCT, MOLYBDENUM, METRIC TON, 2016 - 2028
- Figure 39:
- AFRICA FERTILIZERS MARKET, BY PRODUCT, MOLYBDENUM, USD, 2016 - 2028
- Figure 40:
- AFRICA FERTILIZERS MARKET, VALUE SHARE(%), BY CROP TYPE, 2016 - 2028
- Figure 41:
- AFRICA FERTILIZERS MARKET, BY PRODUCT, ZINC, METRIC TON, 2016 - 2028
- Figure 42:
- AFRICA FERTILIZERS MARKET, BY PRODUCT, ZINC, USD, 2016 - 2028
- Figure 43:
- AFRICA FERTILIZERS MARKET, VALUE SHARE(%), BY CROP TYPE, 2016 - 2028
- Figure 44:
- AFRICA FERTILIZERS MARKET, BY PRODUCT, OTHERS, METRIC TON, 2016 - 2028
- Figure 45:
- AFRICA FERTILIZERS MARKET, BY PRODUCT, OTHERS, USD, 2016 - 2028
- Figure 46:
- AFRICA FERTILIZERS MARKET, VALUE SHARE(%), BY CROP TYPE, 2016 - 2028
- Figure 47:
- AFRICA FERTILIZERS MARKET, BY PRODUCT, VOLUME, METRIC TON, 2016 - 2028
- Figure 48:
- AFRICA FERTILIZERS MARKET, BY PRODUCT, VALUE, USD, 2016 - 2028
- Figure 49:
- AFRICA FERTILIZERS MARKET, VOLUME SHARE(%), BY PRODUCT, 2016 - 2028
- Figure 50:
- AFRICA FERTILIZERS MARKET, VALUE SHARE(%), BY PRODUCT, 2016 - 2028
- Figure 51:
- AFRICA FERTILIZERS MARKET, BY PRODUCT, AMMONIUM NITRATE, METRIC TON, 2016 - 2028
- Figure 52:
- AFRICA FERTILIZERS MARKET, BY PRODUCT, AMMONIUM NITRATE, USD, 2016 - 2028
- Figure 53:
- AFRICA FERTILIZERS MARKET, VALUE SHARE(%), BY CROP TYPE, 2016 - 2028
- Figure 54:
- AFRICA FERTILIZERS MARKET, BY PRODUCT, UREA, METRIC TON, 2016 - 2028
- Figure 55:
- AFRICA FERTILIZERS MARKET, BY PRODUCT, UREA, USD, 2016 - 2028
- Figure 56:
- AFRICA FERTILIZERS MARKET, VALUE SHARE(%), BY CROP TYPE, 2016 - 2028
- Figure 57:
- AFRICA FERTILIZERS MARKET, BY PRODUCT, OTHERS, METRIC TON, 2016 - 2028
- Figure 58:
- AFRICA FERTILIZERS MARKET, BY PRODUCT, OTHERS, USD, 2016 - 2028
- Figure 59:
- AFRICA FERTILIZERS MARKET, VALUE SHARE(%), BY CROP TYPE, 2016 - 2028
- Figure 60:
- AFRICA FERTILIZERS MARKET, BY PRODUCT, VOLUME, METRIC TON, 2016 - 2028
- Figure 61:
- AFRICA FERTILIZERS MARKET, BY PRODUCT, VALUE, USD, 2016 - 2028
- Figure 62:
- AFRICA FERTILIZERS MARKET, VOLUME SHARE(%), BY PRODUCT, 2016 - 2028
- Figure 63:
- AFRICA FERTILIZERS MARKET, VALUE SHARE(%), BY PRODUCT, 2016 - 2028
- Figure 64:
- AFRICA FERTILIZERS MARKET, BY PRODUCT, DAP, METRIC TON, 2016 - 2028
- Figure 65:
- AFRICA FERTILIZERS MARKET, BY PRODUCT, DAP, USD, 2016 - 2028
- Figure 66:
- AFRICA FERTILIZERS MARKET, VALUE SHARE(%), BY CROP TYPE, 2016 - 2028
- Figure 67:
- AFRICA FERTILIZERS MARKET, BY PRODUCT, MAP, METRIC TON, 2016 - 2028
- Figure 68:
- AFRICA FERTILIZERS MARKET, BY PRODUCT, MAP, USD, 2016 - 2028
- Figure 69:
- AFRICA FERTILIZERS MARKET, VALUE SHARE(%), BY CROP TYPE, 2016 - 2028
- Figure 70:
- AFRICA FERTILIZERS MARKET, BY PRODUCT, SSP, METRIC TON, 2016 - 2028
- Figure 71:
- AFRICA FERTILIZERS MARKET, BY PRODUCT, SSP, USD, 2016 - 2028
- Figure 72:
- AFRICA FERTILIZERS MARKET, VALUE SHARE(%), BY CROP TYPE, 2016 - 2028
- Figure 73:
- AFRICA FERTILIZERS MARKET, BY PRODUCT, TSP, METRIC TON, 2016 - 2028
- Figure 74:
- AFRICA FERTILIZERS MARKET, BY PRODUCT, TSP, USD, 2016 - 2028
- Figure 75:
- AFRICA FERTILIZERS MARKET, VALUE SHARE(%), BY CROP TYPE, 2016 - 2028
- Figure 76:
- AFRICA FERTILIZERS MARKET, BY PRODUCT, VOLUME, METRIC TON, 2016 - 2028
- Figure 77:
- AFRICA FERTILIZERS MARKET, BY PRODUCT, VALUE, USD, 2016 - 2028
- Figure 78:
- AFRICA FERTILIZERS MARKET, VOLUME SHARE(%), BY PRODUCT, 2016 - 2028
- Figure 79:
- AFRICA FERTILIZERS MARKET, VALUE SHARE(%), BY PRODUCT, 2016 - 2028
- Figure 80:
- AFRICA FERTILIZERS MARKET, BY PRODUCT, MOP, METRIC TON, 2016 - 2028
- Figure 81:
- AFRICA FERTILIZERS MARKET, BY PRODUCT, MOP, USD, 2016 - 2028
- Figure 82:
- AFRICA FERTILIZERS MARKET, VALUE SHARE(%), BY CROP TYPE, 2016 - 2028
- Figure 83:
- AFRICA FERTILIZERS MARKET, BY PRODUCT, SOP, METRIC TON, 2016 - 2028
- Figure 84:
- AFRICA FERTILIZERS MARKET, BY PRODUCT, SOP, USD, 2016 - 2028
- Figure 85:
- AFRICA FERTILIZERS MARKET, VALUE SHARE(%), BY CROP TYPE, 2016 - 2028
- Figure 86:
- AFRICA FERTILIZERS MARKET, BY PRODUCT, VOLUME, METRIC TON, 2016 - 2028
- Figure 87:
- AFRICA FERTILIZERS MARKET, BY PRODUCT, VALUE, USD, 2016 - 2028
- Figure 88:
- AFRICA FERTILIZERS MARKET, VOLUME SHARE(%), BY PRODUCT, 2016 - 2028
- Figure 89:
- AFRICA FERTILIZERS MARKET, VALUE SHARE(%), BY PRODUCT, 2016 - 2028
- Figure 90:
- AFRICA FERTILIZERS MARKET, BY PRODUCT, CALCIUM, METRIC TON, 2016 - 2028
- Figure 91:
- AFRICA FERTILIZERS MARKET, BY PRODUCT, CALCIUM, USD, 2016 - 2028
- Figure 92:
- AFRICA FERTILIZERS MARKET, VALUE SHARE(%), BY CROP TYPE, 2016 - 2028
- Figure 93:
- AFRICA FERTILIZERS MARKET, BY PRODUCT, MAGNESIUM, METRIC TON, 2016 - 2028
- Figure 94:
- AFRICA FERTILIZERS MARKET, BY PRODUCT, MAGNESIUM, USD, 2016 - 2028
- Figure 95:
- AFRICA FERTILIZERS MARKET, VALUE SHARE(%), BY CROP TYPE, 2016 - 2028
- Figure 96:
- AFRICA FERTILIZERS MARKET, BY PRODUCT, SULFUR, METRIC TON, 2016 - 2028
- Figure 97:
- AFRICA FERTILIZERS MARKET, BY PRODUCT, SULFUR, USD, 2016 - 2028
- Figure 98:
- AFRICA FERTILIZERS MARKET, VALUE SHARE(%), BY CROP TYPE, 2016 - 2028
- Figure 99:
- AFRICA FERTILIZERS MARKET, BY FORM, VOLUME, METRIC TON, 2016 - 2028
- Figure 100:
- AFRICA FERTILIZERS MARKET, BY FORM, VALUE, USD, 2016 - 2028
- Figure 101:
- AFRICA FERTILIZERS MARKET, VOLUME SHARE(%), BY FORM, 2016 - 2028
- Figure 102:
- AFRICA FERTILIZERS MARKET, VALUE SHARE(%), BY FORM, 2016 - 2028
- Figure 103:
- AFRICA FERTILIZERS MARKET, BY FORM, CONVENTIONAL, METRIC TON, 2016 - 2028
- Figure 104:
- AFRICA FERTILIZERS MARKET, BY FORM, CONVENTIONAL, USD, 2016 - 2028
- Figure 105:
- AFRICA FERTILIZERS MARKET, VALUE SHARE(%), BY CROP TYPE, 2016 - 2028
- Figure 106:
- AFRICA FERTILIZERS MARKET, BY SPECIALITY TYPE, VOLUME, METRIC TON, 2016 - 2028
- Figure 107:
- AFRICA FERTILIZERS MARKET, BY SPECIALITY TYPE, VALUE, USD, 2016 - 2028
- Figure 108:
- AFRICA FERTILIZERS MARKET, VOLUME SHARE(%), BY SPECIALITY TYPE, 2016 - 2028
- Figure 109:
- AFRICA FERTILIZERS MARKET, VALUE SHARE(%), BY SPECIALITY TYPE, 2016 - 2028
- Figure 110:
- AFRICA FERTILIZERS MARKET, BY SPECIALITY TYPE, CRF, METRIC TON, 2016 - 2028
- Figure 111:
- AFRICA FERTILIZERS MARKET, BY SPECIALITY TYPE, CRF, USD, 2016 - 2028
- Figure 112:
- AFRICA FERTILIZERS MARKET, VALUE SHARE(%), BY CROP TYPE, 2016 - 2028
- Figure 113:
- AFRICA FERTILIZERS MARKET, BY SPECIALITY TYPE, LIQUID FERTILIZER, METRIC TON, 2016 - 2028
- Figure 114:
- AFRICA FERTILIZERS MARKET, BY SPECIALITY TYPE, LIQUID FERTILIZER, USD, 2016 - 2028
- Figure 115:
- AFRICA FERTILIZERS MARKET, VALUE SHARE(%), BY CROP TYPE, 2016 - 2028
- Figure 116:
- AFRICA FERTILIZERS MARKET, BY SPECIALITY TYPE, SRF, METRIC TON, 2016 - 2028
- Figure 117:
- AFRICA FERTILIZERS MARKET, BY SPECIALITY TYPE, SRF, USD, 2016 - 2028
- Figure 118:
- AFRICA FERTILIZERS MARKET, VALUE SHARE(%), BY CROP TYPE, 2016 - 2028
- Figure 119:
- AFRICA FERTILIZERS MARKET, BY SPECIALITY TYPE, WATER SOLUBLE, METRIC TON, 2016 - 2028
- Figure 120:
- AFRICA FERTILIZERS MARKET, BY SPECIALITY TYPE, WATER SOLUBLE, USD, 2016 - 2028
- Figure 121:
- AFRICA FERTILIZERS MARKET, VALUE SHARE(%), BY CROP TYPE, 2016 - 2028
- Figure 122:
- AFRICA FERTILIZERS MARKET, BY APPLICATION MODE, VOLUME, METRIC TON, 2016 - 2028
- Figure 123:
- AFRICA FERTILIZERS MARKET, BY APPLICATION MODE, VALUE, USD, 2016 - 2028
- Figure 124:
- AFRICA FERTILIZERS MARKET, VOLUME SHARE(%), BY APPLICATION MODE, 2016 - 2028
- Figure 125:
- AFRICA FERTILIZERS MARKET, VALUE SHARE(%), BY APPLICATION MODE, 2016 - 2028
- Figure 126:
- AFRICA FERTILIZERS MARKET, BY APPLICATION MODE, FERTIGATION, METRIC TON, 2016 - 2028
- Figure 127:
- AFRICA FERTILIZERS MARKET, BY APPLICATION MODE, FERTIGATION, USD, 2016 - 2028
- Figure 128:
- AFRICA FERTILIZERS MARKET, VALUE SHARE(%), BY CROP TYPE, 2016 - 2028
- Figure 129:
- AFRICA FERTILIZERS MARKET, BY APPLICATION MODE, FOLIAR, METRIC TON, 2016 - 2028
- Figure 130:
- AFRICA FERTILIZERS MARKET, BY APPLICATION MODE, FOLIAR, USD, 2016 - 2028
- Figure 131:
- AFRICA FERTILIZERS MARKET, VALUE SHARE(%), BY CROP TYPE, 2016 - 2028
- Figure 132:
- AFRICA FERTILIZERS MARKET, BY APPLICATION MODE, SOIL, METRIC TON, 2016 - 2028
- Figure 133:
- AFRICA FERTILIZERS MARKET, BY APPLICATION MODE, SOIL, USD, 2016 - 2028
- Figure 134:
- AFRICA FERTILIZERS MARKET, VALUE SHARE(%), BY CROP TYPE, 2016 - 2028
- Figure 135:
- AFRICA FERTILIZERS MARKET, BY CROP TYPE, VOLUME, METRIC TON, 2016 - 2028
- Figure 136:
- AFRICA FERTILIZERS MARKET, BY CROP TYPE, VALUE, USD, 2016 - 2028
- Figure 137:
- AFRICA FERTILIZERS MARKET, VOLUME SHARE(%), BY CROP TYPE, 2016 - 2028
- Figure 138:
- AFRICA FERTILIZERS MARKET, VALUE SHARE(%), BY CROP TYPE, 2016 - 2028
- Figure 139:
- AFRICA FERTILIZERS MARKET, BY CROP TYPE, FIELD CROPS, METRIC TON, 2016 - 2028
- Figure 140:
- AFRICA FERTILIZERS MARKET, BY CROP TYPE, FIELD CROPS, USD, 2016 - 2028
- Figure 141:
- AFRICA FERTILIZERS MARKET, VALUE SHARE(%), BY TYPE, 2016 - 2028
- Figure 142:
- AFRICA FERTILIZERS MARKET, BY CROP TYPE, HORTICULTURAL CROPS, METRIC TON, 2016 - 2028
- Figure 143:
- AFRICA FERTILIZERS MARKET, BY CROP TYPE, HORTICULTURAL CROPS, USD, 2016 - 2028
- Figure 144:
- AFRICA FERTILIZERS MARKET, VALUE SHARE(%), BY TYPE, 2016 - 2028
- Figure 145:
- AFRICA FERTILIZERS MARKET, BY CROP TYPE, TURF & ORNAMENTAL, METRIC TON, 2016 - 2028
- Figure 146:
- AFRICA FERTILIZERS MARKET, BY CROP TYPE, TURF & ORNAMENTAL, USD, 2016 - 2028
- Figure 147:
- AFRICA FERTILIZERS MARKET, VALUE SHARE(%), BY TYPE, 2016 - 2028
- Figure 148:
- AFRICA FERTILIZERS MARKET, BY COUNTRY, VOLUME, METRIC TON, 2016 - 2028
- Figure 149:
- AFRICA FERTILIZERS MARKET, BY COUNTRY, VALUE, USD, 2016 - 2028
- Figure 150:
- AFRICA FERTILIZERS MARKET, VOLUME SHARE(%), BY COUNTRY, 2016 - 2028
- Figure 151:
- AFRICA FERTILIZERS MARKET, VALUE SHARE(%), BY COUNTRY, 2016 - 2028
- Figure 152:
- AFRICA FERTILIZERS MARKET, BY COUNTRY, NIGERIA, METRIC TON, 2016 - 2028
- Figure 153:
- AFRICA FERTILIZERS MARKET, BY COUNTRY, NIGERIA, USD, 2016 - 2028
- Figure 154:
- AFRICA FERTILIZERS MARKET, VALUE SHARE(%), BY CROP TYPE, 2016 - 2028
- Figure 155:
- AFRICA FERTILIZERS MARKET, BY COUNTRY, SOUTH AFRICA, METRIC TON, 2016 - 2028
- Figure 156:
- AFRICA FERTILIZERS MARKET, BY COUNTRY, SOUTH AFRICA, USD, 2016 - 2028
- Figure 157:
- AFRICA FERTILIZERS MARKET, VALUE SHARE(%), BY CROP TYPE, 2016 - 2028
- Figure 158:
- AFRICA FERTILIZERS MARKET, BY COUNTRY, REST OF AFRICA, METRIC TON, 2016 - 2028
- Figure 159:
- AFRICA FERTILIZERS MARKET, BY COUNTRY, REST OF AFRICA, USD, 2016 - 2028
- Figure 160:
- AFRICA FERTILIZERS MARKET, VALUE SHARE(%), BY CROP TYPE, 2016 - 2028
- Figure 161:
- AFRICA FERTILIZERS MARKET, MOST ACTIVE COMPANIES, BY NUMBER OF STRATEGIC MOVES, 2018 - 2021
- Figure 162:
- AFRICA FERTILIZERS MARKET, MOST ADOPTED STRATEGIES, 2018 - 2021
- Figure 163:
- AFRICA FERTILIZERS MARKET SHARE(%), BY MAJOR PLAYERS, 2021
Africa Fertilizer Industry Segmentation
Complex, Straight are covered as segments by Type. Conventional, Speciality are covered as segments by Form. Fertigation, Foliar, Soil are covered as segments by Application Mode. Field Crops, Horticultural Crops, Turf & Ornamental are covered as segments by Crop Type. Nigeria, South Africa are covered as segments by Country.| Type | |||||||||||||||||||||||||||||||
| Complex | |||||||||||||||||||||||||||||||
|
| Form | ||||||
| Conventional | ||||||
|
| Application Mode | |
| Fertigation | |
| Foliar | |
| Soil |
| Crop Type | |
| Field Crops | |
| Horticultural Crops | |
| Turf & Ornamental |
| Country | |
| Nigeria | |
| South Africa | |
| Rest Of Africa |
Market Definition
- AVERAGE NUTRIENT APPLICATION RATE - This refers to the average volume of nutrient consumed per hectare of farmland in each country.
- CROP TYPES COVERED - Field Crops: Cereals, Pulses, Oilseeds, Fiber Crops, and Forage Crops, Horticulture: Fruits, Vegetables, Plantation Crops and Spices, Turf Grass and Ornamentals
- MARKET ESTIMATION LEVEL - Market Estimations for various types of fertilizers has been done at the product-level and not at the nutrient-level.
- NUTRIENT TYPES COVERED - Primary Nutrients: N, P and K, Secondary Macronutrients: Ca, Mg and S, Micronutients: Zn, Mn, Cu, Fe, Mo, B, and Others
Research Methodology
Mordor Intelligence follows a four-step methodology in all our reports.
- Step-1: Identify Key Variables: In order to build a robust forecasting methodology, the variables and factors identified in Step-1 are tested against available historical market numbers. Through an iterative process, the variables required for market forecast are set and the model is built on the basis of these variables.
- Step-2: Build a Market Model: Market-size estimations for the forecast years are in nominal terms. Inflation is not a part of the pricing, and the average selling price (ASP) is kept constant throughout the forecast period for each country.
- Step-3: Validate and Finalize: In this important step, all market numbers, variables and analyst calls are validated through an extensive network of primary research experts from the market studied. The respondents are selected across levels and functions to generate a holistic picture of the market studied.
- Step-4: Research Outputs: Syndicated Reports, Custom Consulting Assignments, Databases & Subscription Platforms


