Market Overview
| Study Period | 2018 - 2031 |
|---|---|
| Base Year For Estimation | 2025 |
| Forecast Data Period | 2026 - 2031 |
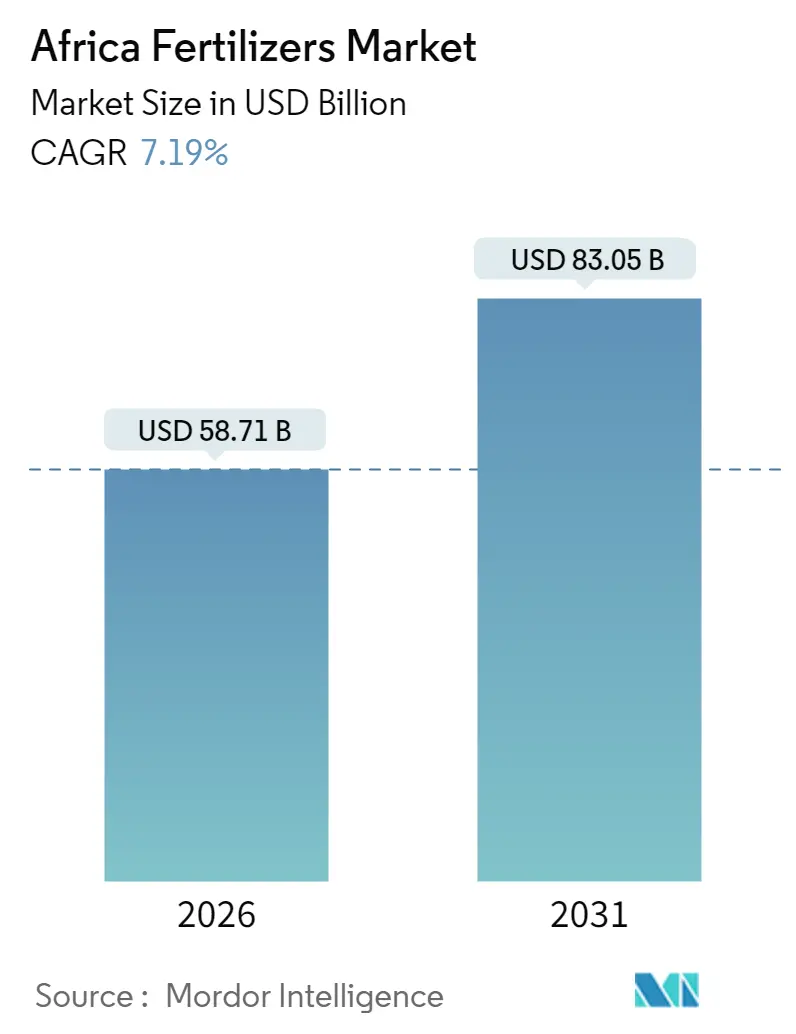
| Market Size (2026) | USD 58.71 Billion |
| Market Size (2031) | USD 83.05 Billion |
| Growth Rate (2026 - 2031) | 7.19% CAGR |
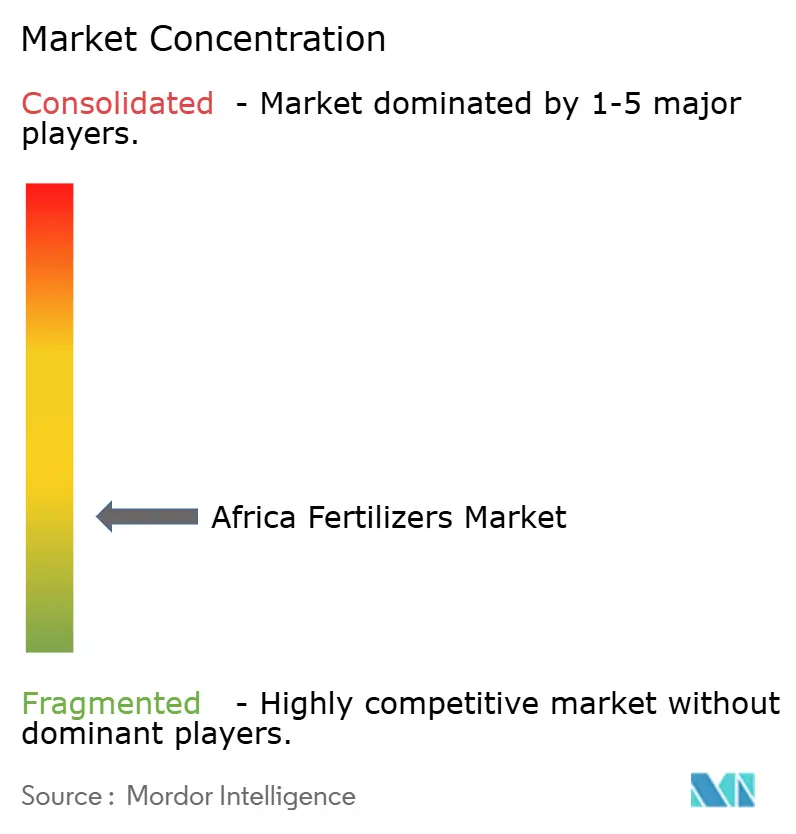
| Market Concentration | Low |
Major Players *Disclaimer: Major Players sorted in no particular order Image © Mordor Intelligence. Reuse requires attribution under CC BY 4.0. | |
Africa Fertilizers Market Analysis by Mordor Intelligence
The Africa fertilizer market was valued at USD 54.77 billion in 2025 and estimated to grow from USD 58.71 billion in 2026 to reach USD 83.05 billion by 2031, at a CAGR of 7.19% during the forecast period (2026-2031). Steady policy alignment across the continent and domestic capacity expansions support this advance as governments prioritize input self-sufficiency and food security. Complex fertilizers dominate volumes by offering balanced nutrient packages that fit precision programs, while straight urea gains cost tailwinds from new Nigerian plants. Digital agronomy, green ammonia investments, and targeted subsidies are broadening smallholder access and stimulating private capital flows toward distribution upgrades. Persistent logistics gaps and recurring global price spikes remain headwinds, but sustained demand for nutrient-dense staple production underpins a resilient growth outlook for the Africa fertilizer market.
Key Report Takeaways
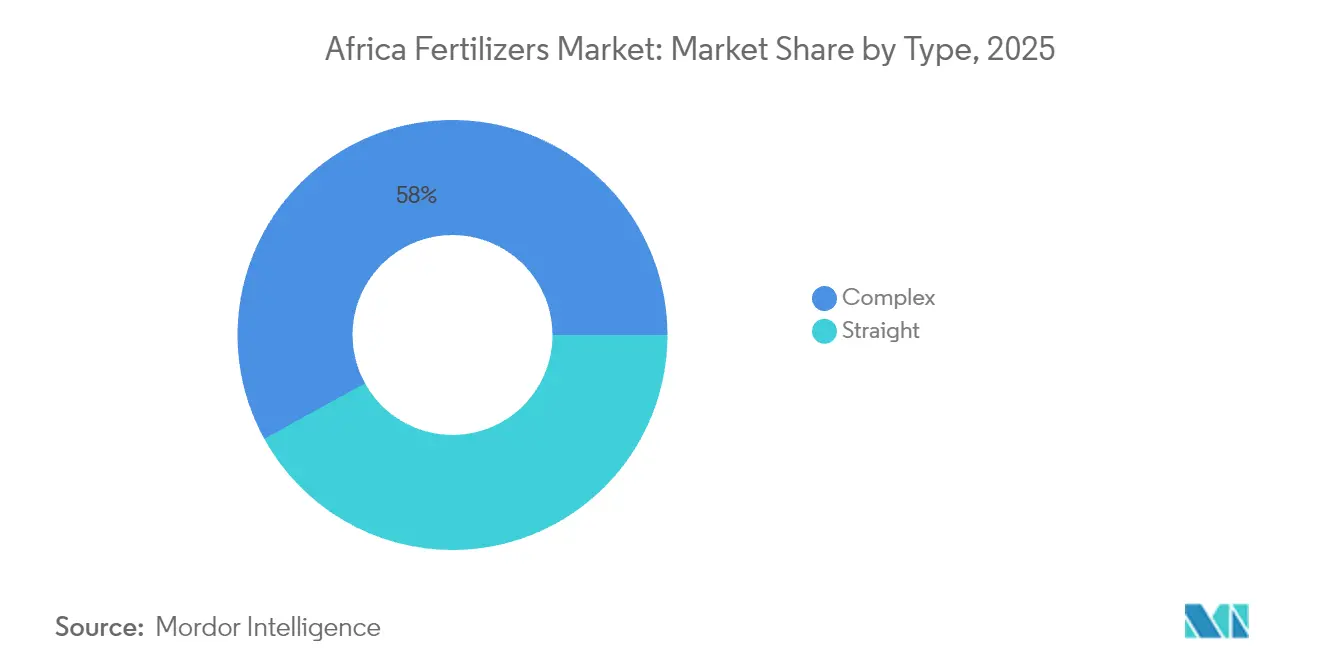
- By Type, complex fertilizers led with 58.02% of the Africa fertilizer market share in 2025, while complex fertilizers are predicted to grow at an 8.27% CAGR through 2031.
- By Form, conventional led with 90.76% of the Africa fertilizer market size in 2025, while conventional form is projected to expand at a 7.14% CAGR to 2031.
- By Application mode, fertigation led with 60.93% of the Africa fertilizer market size in 2025, while foliar application is projected to expand at an 8.27% CAGR to 2031.
- By Crop type, field crops accounted for a 90.88% share of the Africa fertilizer market size in 2025, while field crop are predicted to grow at a 7.14% CAGR through 2031.
- By Geography, Nigeria led with 12.37% of the Africa fertilizer market size in 2025, while South Africa is advancing at a 6.41% CAGR through 2031.
Note: Market size and forecast figures in this report are generated using Mordor Intelligence’s proprietary estimation framework, updated with the latest available data and insights as of January 2026.
Africa Fertilizers Market Trends and Insights
Drivers Impact Analysis
| Driver | (~) % Impact on CAGR Forecast | Geographic Relevance | Impact Timeline |
|---|---|---|---|
| Rising food-security pressure in Africa | +1.8% | Continental, with the highest impact in Nigeria, Kenya, and Ethiopia | Medium term (2-4 years) |
| Subsidy reforms & Abuja+ Nairobi policy momentum | +1.5% | Implementation is continent-wide, led by Nigeria, Kenya, and Ghana. | Short term (≤ 2 years) |
| Rapid scale-up of domestic production capacity | +1.2% | Nigeria, Morocco, Egypt, South Africa | Medium term (2-4 years) |
| Digital agronomy platforms driving optimized use | +0.9% | Kenya, South Africa, and Ghana, with spillover to West Africa | Long term (≥ 4 years) |
| Low-carbon (green) ammonia investments | +0.7% | Morocco, Egypt, with renewable energy integration | Long term (≥ 4 years) |
| Micronutrient-led bio-fortification demand | +0.4% | Nigeria, Ghana, and Kenya biofortification programs | Medium term (2-4 years) |
| Source: Mordor Intelligence | |||
Understand The Key Trends Shaping This Market
Download PDF
Rising Food-Security Pressure in Africa
Africa's growing population, projected to reach 1.4 billion by 2030, combined with declining arable land per capita, creates sustained demand for increased fertilizer use. Nigeria's zinc-biofortified rice program, launched in April 2024, exemplifies how governments are linking food security to micronutrient density rather than just caloric sufficiency, driving demand for specialized formulations beyond traditional NPK blends. This shift toward nutrient-dense crop production requires higher fertilizer application rates and more sophisticated nutrient management, particularly in maize systems where split applications of straight fertilizers increased yields 22-46% over NPK blends in Nigeria's Middle-Belt trials. The economic imperative intensifies as food import bills strain foreign exchange reserves, making domestic production efficiency a national security priority. Agricultural productivity gains through fertilizer intensification become the primary pathway to food self-sufficiency, creating sustained demand growth even during price volatility cycles.
Subsidy Reforms & Abuja Nairobi Policy Momentum
The Nairobi Declaration 2024 establishes binding fertilizer application targets of 50 kilograms per hectare across African Union member states, creating policy-driven demand that transcends traditional market dynamics. Kenya's Finance Bill 2025 paradoxically removes VAT exemptions on fertilizers while allocating KES 10 billion (USD 77.4 billion) for fertilizer subsidies, indicating the government's commitment to maintaining input access despite fiscal pressures. Nigeria's National Agricultural Technology and Innovation Policy (2022-2027) demonstrates coordinated continental approaches, with subsidy programs increasingly targeting specific crops and regions to maximize food security outcomes. The policy momentum creates predictable demand patterns that enable private sector investment in distribution networks and local blending facilities. Implementation effectiveness varies significantly, with Ghana and Nigeria achieving higher subsidy delivery rates than landlocked Sahel countries facing logistics constraints.
Rapid Scale-Up of Domestic Production Capacity
Strategic capacity additions fundamentally alter Africa's fertilizer trade balance, with Dangote's 3 million tons per year urea facility positioning Nigeria as a net exporter rather than importer. OCP Group's USD 13 billion green investment program through 2028 will expand production to 9 million tons annually, while Indorama's USD 75 million African Development Bank loan supports a third urea production line in Nigeria. These expansions reduce import dependency and create regional supply hubs that can serve neighboring countries more cost-effectively than traditional European or Asian suppliers[1]Source: African Development Bank, “African Development Bank approves US$75 million loan to Indorama Eleme Fertilizer and Chemicals Limited to expand fertilizer production in Nigeria,” afdb.org . Angola's USD 1.4 billion ammonia and urea plant, with 4,000 tons daily capacity, exemplifies how resource-rich countries are leveraging natural gas reserves for fertilizer production. The geographic concentration of new capacity in Nigeria, Morocco, and Egypt creates supply chain advantages for neighboring countries while potentially disrupting established import patterns from traditional suppliers.
Digital Agronomy Platforms Driving Optimized Use
Technology adoption accelerates fertilizer use efficiency through data-driven application timing and rates, with Malawi's WhatsApp-based AI chatbot 'Ulangizi' reaching 150-200 farmers per support agent despite smartphone penetration constraints. South Africa's data-driven training initiatives produced 40% average yield increases among emerging farmers, with maize yields rising from 4.2 to 6.0 metric tons per hectare through optimized fertilization and irrigation management. Ghana's AI-driven soil testing and fertilizer recommendations demonstrate how precision agriculture can reduce input waste while maintaining productivity gains. Infrastructure constraints limit scalability, with 80% of farmers reporting inadequate access to reliable weather and market data that would enable optimal fertilizer timing decisions. The human-in-the-loop model proves essential for trust-building and adoption, particularly where AI recommendations conflict with traditional farming practices.
Restraints Impact Analysis
| Restraint | (~) % Impact on CAGR Forecast | Geographic Relevance | Impact Timeline |
|---|---|---|---|
| Fertilizer price–affordability shocks | -1.4% | Continental, the highest impact in landlocked Sahel countries | Short term (≤ 2 years) |
| Weak logistics & retail distribution networks | -1.1% | Landlocked countries, rural areas across the continent | Medium term (2-4 years) |
| Agro-ecology policy headwinds on synthetics | -0.6% | Kenya, South Africa, and Ghana policy environments | Long term (≥ 4 years) |
| High cost of capital for African green projects | -0.5% | Project finance markets, renewable energy integration | Long term (≥ 4 years) |
| Source: Mordor Intelligence | |||
Fertilizer Price–Affordability Shocks
In July 2025, global fertilizer prices increased by 15% in the first half of 2025. Diammonium phosphate (DAP) prices rose by 23%, while triple superphosphate (TSP) prices increased by 43%. These increases resulted from strong Asian demand, China's export restrictions, and high sulfur input costs. The price surge affected smallholder farmers' ability to maintain input intensity levels, as the World Bank's DAP accessibility index reached 1.72 in June 2025, surpassing the early-2022 crisis peaks. Kenya's Finance Bill 2025 compounds affordability pressures by imposing 16% VAT on previously exempt fertilizers, potentially increasing costs by KES 480 (USD 3.71) per 50-kilogram bag and raising total production costs by 15% for smallholders. The price transmission mechanism varies significantly across countries, with Nigeria's rice import duty waivers in 2024 depressing farm-gate prices and reducing farmers' capacity to invest in fertilizers for subsequent seasons. Currency devaluations amplify import cost pressures, while limited access to credit markets prevents farmers from smoothing input purchases across price cycles. Subsidy programs provide partial relief but often suffer from timing delays and targeting inefficiencies that limit their effectiveness during acute price spikes.
Weak Logistics and Retail Distribution Networks
Transport and distribution bottlenecks add 30-60% to farm-gate fertilizer costs in landlocked regions, with port congestion and limited rail connectivity creating supply chain vulnerabilities that persist despite capacity expansion investments. The Red Sea crisis forced fertilizer shipments to reroute around the Cape of Good Hope, adding 10-14 days transit time and increasing freight costs for East African markets, while container throughput growth from 19.2 million to 34.9 million TEUs between 2010-2022 still lags demand growth. Rural retail networks remain fragmented, with limited storage capacity and working capital constraints preventing dealers from maintaining adequate inventory during peak application seasons. Last-mile delivery challenges are particularly acute in countries like Chad and the Central African Republic, where road infrastructure limits access to remote farming communities. Digital payment systems and mobile money integration show promise for reducing transaction costs, but adoption rates remain low in rural areas with limited connectivity and financial literacy.
Segment Analysis
By Type: Complex Fertilizers Lead Through Integrated Nutrient Delivery
Complex fertilizers dominate with 58.02% market share in 2025, driven by their ability to deliver balanced nutrition in single applications that reduce labor costs and improve nutrient synchronization for smallholder farmers. The 8.27% CAGR growth rate through 2031 reflects increasing sophistication in crop nutrition management, particularly as extension services promote integrated nutrient management practices. Complex fertilizers maintain a significant presence through urea's affordability advantage and flexibility in customized application programs, while micronutrients experience rapid adoption in biofortification programs across Nigeria, Ghana, and Kenya.
In Africa, complex fertilizer market growth is driven by their ability to provide multiple plant nutrients necessary for crop growth in a single application, including primary nutrients, secondary nutrients, and micronutrients. The segment's expansion is supported by increasing awareness among farmers about the benefits of balanced crop nutrition and the environmental advantages of complex fertilizers, which allow for reduced application rates while minimizing both environmental and soil impacts. The emergence of advanced fertilizer types, such as controlled-release and slow-release variants, is further bolstering the adoption of complex fertilizers in the region, particularly in high-value crops and modern farming operations.
Note: Segment shares of all individual segments available upon report purchase
Get Detailed Market Forecasts at the Most Granular Levels
Download PDF
By Form: Conventional Dominance Faces Specialty Innovation Pressure
Conventional fertilizers hold a 90.76% market share in 2025 and are expected to grow at a 7.14% CAGR through 2031. This dominance reflects the cost sensitivity of smallholder farmers who prioritize affordability over advanced formulations. The segment shows strong growth potential due to increasing awareness of efficient agricultural practices and rising demand for high-value crops. Conventional fertilizers see high adoption rates in intensive farming systems and horticultural crops, where precise nutrient management is essential. The growth is supported by modern irrigation system adoption in commercial farming operations and expanding agricultural practices across the region.
The market leadership of conventional fertilizers stems from their widespread availability, established distribution networks, and lower prices compared to specialty alternatives. These fertilizers dominate field crop applications, accounting for 96% of total fertilizer consumption. Large-scale farming operations and farmers' experience with traditional fertilizer applications strengthen this position. The extensive retail network and accessibility of conventional fertilizers, particularly in rural areas, reinforce their market dominance. In Africa, where cost is a primary factor in fertilizer selection, the conventional segment's value proposition remains strong.
By Application Mode: Fertigation Efficiency Drives Adoption
Fertigation commands 60.93% market share in 2025, reflecting water-use efficiency priorities in arid and semi-arid regions where irrigation infrastructure investments enable precise nutrient delivery synchronized with water application. The method's dominance stems from its ability to reduce fertilizer waste while improving crop uptake efficiency, particularly valuable as fertilizer prices remain elevated and water scarcity intensifies across the continent. The fertigation trend aligns with greenhouse expansion and protected agriculture adoption, where controlled environments enable optimization of both water and nutrient delivery systems.
Foliar application emerges as the fastest-growing mode at 8.27% CAGR through 2031, driven by its effectiveness in addressing micronutrient deficiencies and providing rapid nutrient correction during critical growth stages. Digital agriculture platforms increasingly provide application timing recommendations that improve efficiency across all modes, with AI-driven advisory services helping farmers optimize nutrient delivery based on soil moisture, weather patterns, and crop growth stages.
By Crop Type: Field Crops Maintain Overwhelming Dominance
Field crops hold 90.88% market share in 2025, demonstrating Africa's emphasis on staple grain production for food security. Maize, rice, and wheat cultivation systems account for most fertilizer consumption across the continent. This dominance stems from smallholder farming systems prioritizing subsistence and local market production, where fertilizer investments must yield tangible increases in staple crop production. The market projects a 7.14% CAGR through 2031, driven by population-based demand for caloric production and government policies emphasizing food self-sufficiency over export crop diversification. Horticultural crops constitute a high-value segment requiring premium fertilizers, particularly in Kenya's flower industry and South Africa's fruit exports, where nutrient management directly affects quality and export competitiveness.
Foliar application forms a significant segment in the African fertilizers market by enabling direct nutrient absorption through leaves. This method proves especially effective for micronutrient application and rapid treatment of nutrient deficiencies. Phosphatic fertilizers dominate the foliar application segment, with micronutrients and secondary nutrients following. The technique gains increasing adoption among farmers growing high-value crops and those needing swift nutrient uptake. In the specialty fertilizer category, liquid fertilizers prevail in foliar application due to their complete dissolution characteristics and minimal residue formation. The method's accuracy and rapid response prove valuable for addressing nutrient deficiencies during essential growth phases.

Note: Segment shares of all individual segments available upon report purchase
Get Detailed Market Forecasts at the Most Granular Levels
Download PDF
Geography Analysis
Africa's fertilizer market exhibits pronounced regional variations, with Nigeria leading consumption at 12.37% market share in 2025, driven by its large agricultural sector and domestic production capacity that positions the country as both a major consumer and emerging exporter. The country's transformation from fertilizer importer to potential regional supplier through Dangote's 3 million tons per year urea facility and Indorama's expansion creates supply chain advantages for neighboring West African markets. Morocco leverages its phosphate resources and OCP Group's USD 13 billion investment program to serve both domestic and export markets, while implementing a continent-wide phosphorus-based soil restoration initiative launched in February 2024 .
South Africa emerges as the fastest-growing market at 6.41% CAGR through 2031, propelled by commercial farming modernization and export-oriented crop production that demands sophisticated nutrition management. The country's emerging farmers achieved 40% yield increases through data-driven fertilizer practices, with maize yields rising from 4.2 to 6.0 metric tons per hectare, demonstrating the productivity potential when precision nutrition meets improved extension services.
Smaller markets across East and West Africa face infrastructure constraints that limit fertilizer access, with transport costs adding 30-60% to farm-gate prices in landlocked countries like Chad and Mali. Continental trade integration through the African Continental Free Trade Area shows promise for reducing input costs, with Malawi studies indicating potential 20.51% reductions in agricultural input prices through tariff elimination and trade facilitation measures.
Competitive Landscape
The Africa fertilizer market is fragmented, with the top players including Yara International ASA, SABIC Agri-Nutrients Co., ICL Group Ltd, K+S Aktiengesellschaft, and Golden Fertilizer Company Limited, creating a competitive environment that balances established multinational presence with emerging regional champions and technology-enabled disruptors. The market structure enables both scale advantages for major players and niche opportunities for specialized suppliers targeting precision agriculture and premium crop segments.
Strategic patterns reveal a shift toward vertical integration and regional supply chain control, with companies investing in domestic production capacity to reduce import dependency and capture value across the fertilizer supply chain. Technology adoption becomes a key differentiator, as digital agriculture platforms and precision application systems create opportunities for companies to provide integrated solutions beyond commodity fertilizer sales.
Yara International's strong Q1 2025 results, with EBITDA of USD 638 million driven by improved margins and strategic portfolio optimizations, demonstrate how global players adapt their Africa strategies to emphasize profitability over volume in volatile market conditions [3]Source: Yara International ASA, “Yara 3Q 2024 Report,” yara.com . Opportunities exist in last-mile distribution, digital advisory services, and specialty formulations for high-value crops, while regulatory compliance requirements create barriers that favor established players with technical expertise and regulatory affairs capabilities.
Africa Fertilizers Industry Leaders
Yara International ASA
SABIC Agri-Nutrients Co.
ICL Group Ltd
K+S Aktiengesellschaft
Golden Fertilizer Company Limited
- *Disclaimer: Major Players sorted in no particular order
Need More Details on Market Players and Competitors?
Download PDF
Recent Industry Developments
- March 2025: Morocco approves USD 32.5 billion in green hydrogen projects, positioning the country as a renewable ammonia production hub for both domestic fertilizer manufacturing and European export markets, with multiple international partnerships targeting large-scale green fertilizer production.
- January 2023: ICL has entered into a strategic partnership agreement with General Mills, in which it will be the supplier of strategic specialty phosphate solutions to General Mills. The long-term agreement will also focus on international expansion.
- May 2022: ICL launched three new NPK formulations of Solinure, a product with increased trace elements to optimize yields. The new water-soluble fertilizers contain increased levels of fully chelated trace elements and magnesium, which aid plant growth and optimize yields during critical stages, including winter production periods
Africa Fertilizers Market Report Scope
Complex, Straight are covered as segments by Type. Conventional, Speciality are covered as segments by Form. Fertigation, Foliar, Soil are covered as segments by Application Mode. Field Crops, Horticultural Crops, Turf & Ornamental are covered as segments by Crop Type. Nigeria, South Africa are covered as segments by Country.Type
| Complex | ||
| Straight | Micronutrients | Boron |
| Copper | ||
| Iron | ||
| Manganese | ||
| Molybdenum | ||
| Zinc | ||
| Others | ||
| Nitrogenous | Ammonium Nitrate | |
| Urea | ||
| Others | ||
| Phosphatic | DAP | |
| MAP | ||
| SSP | ||
| TSP | ||
| Potassic | MoP | |
| SoP | ||
| Secondary Macronutrients | Calcium | |
| Magnesium | ||
| Sulfur | ||
Form
| Conventional | |
| Speciality | CRF |
| Liquid Fertilizer | |
| SRF | |
| Water Soluble |
Application Mode
| Fertigation |
| Foliar |
| Soil |
Crop Type
| Field Crops |
| Horticultural Crops |
| Turf & Ornamental |
Country
| Nigeria |
| South Africa |
| Rest of Africa |
| Type | Complex | ||
| Straight | Micronutrients | Boron | |
| Copper | |||
| Iron | |||
| Manganese | |||
| Molybdenum | |||
| Zinc | |||
| Others | |||
| Nitrogenous | Ammonium Nitrate | ||
| Urea | |||
| Others | |||
| Phosphatic | DAP | ||
| MAP | |||
| SSP | |||
| TSP | |||
| Potassic | MoP | ||
| SoP | |||
| Secondary Macronutrients | Calcium | ||
| Magnesium | |||
| Sulfur | |||
| Form | Conventional | ||
| Speciality | CRF | ||
| Liquid Fertilizer | |||
| SRF | |||
| Water Soluble | |||
| Application Mode | Fertigation | ||
| Foliar | |||
| Soil | |||
| Crop Type | Field Crops | ||
| Horticultural Crops | |||
| Turf & Ornamental | |||
| Country | Nigeria | ||
| South Africa | |||
| Rest of Africa | |||
Need A Different Region or Segment?
Customize Now
Market Definition
- MARKET ESTIMATION LEVEL - Market Estimations for various types of fertilizers has been done at the product-level and not at the nutrient-level.
- NUTRIENT TYPES COVERED - Primary Nutrients: N, P and K, Secondary Macronutrients: Ca, Mg and S, Micronutients: Zn, Mn, Cu, Fe, Mo, B, and Others
- AVERAGE NUTRIENT APPLICATION RATE - This refers to the average volume of nutrient consumed per hectare of farmland in each country.
- CROP TYPES COVERED - Field Crops: Cereals, Pulses, Oilseeds, and Fiber Crops Horticulture: Fruits, Vegetables, Plantation Crops and Spices, Turf Grass and Ornamentals
| Keyword | Definition |
|---|---|
| Fertilizer | Chemical substance applied to crops to ensure nutritional requirements, available in various forms such as granules, powders, liquid, water soluble, etc. |
| Specialty Fertilizer | Used for enhanced efficiency and nutrient availability applied through soil, foliar, and fertigation. Includes CRF, SRF, liquid fertilizer, and water soluble fertilizers. |
| Controlled-Release Fertilizers (CRF) | Coated with materials such as polymer, polymer-sulfur, and other materials such as resins to ensure nutrient availability to the crop for its entire life cycle. |
| Slow-Release Fertilizers (SRF) | Coated with materials such as sulfur, neem, etc., to ensure nutrient availability to the crop for a longer period. |
| Foliar Fertilizers | Consist of both liquid and water soluble fertilizers applied through foliar application. |
| Water-Soluble Fertilizers | Available in various forms including liquid, powder, etc., used in foliar and fertigation mode of fertilizer application. |
| Fertigation | Fertilizers applied through different irrigation systems such as drip irrigation, micro irrigation, sprinkler irrigation, etc. |
| Anhydrous Ammonia | Used as fertilizer, directly injected into the soil, available in gaseous liquid form. |
| Single Super Phosphate (SSP) | Phosphorus fertilizer containing only phosphorus which has lesser than or equal to 35%. |
| Triple Super Phosphate (TSP) | Phosphorus fertilizer containing only phosphorus greater than 35%. |
| Enhanced Efficiency Fertilizers | Fertilizers coated or treated with additional layers of various ingredients to make it more efficient compared to other fertilizers. |
| Conventional Fertilizer | Fertilizers applied to crops through traditional methods including broadcasting, row placement, ploughing soil placement, etc. |
| Chelated Micronutrients | Micronutrient fertilizers coated with chelating agents such as EDTA, EDDHA, DTPA, HEDTA, etc. |
| Liquid Fertilizers | Available in liquid form, majorly used for application of fertilizers to crops through foliar and fertigation. |
Need More Details on Market Definition?
Ask a Question
Research Methodology
Mordor Intelligence follows a four-step methodology in all our reports.
- Step-1: IDENTIFY KEY VARIABLES: In order to build a robust forecasting methodology, the variables and factors identified in Step-1 are tested against available historical market numbers. Through an iterative process, the variables required for market forecast are set and the model is built on the basis of these variables.
- Step-2: Build a Market Model: Market-size estimations for the forecast years are in nominal terms. Inflation is not a part of the pricing, and the average selling price (ASP) is kept constant throughout the forecast period for each country.
- Step-3: Validate and Finalize: In this important step, all market numbers, variables and analyst calls are validated through an extensive network of primary research experts from the market studied. The respondents are selected across levels and functions to generate a holistic picture of the market studied.
- Step-4: Research Outputs: Syndicated Reports, Custom Consulting Assignments, Databases & Subscription Platforms

Get More Details On Research Methodology
Download PDF


