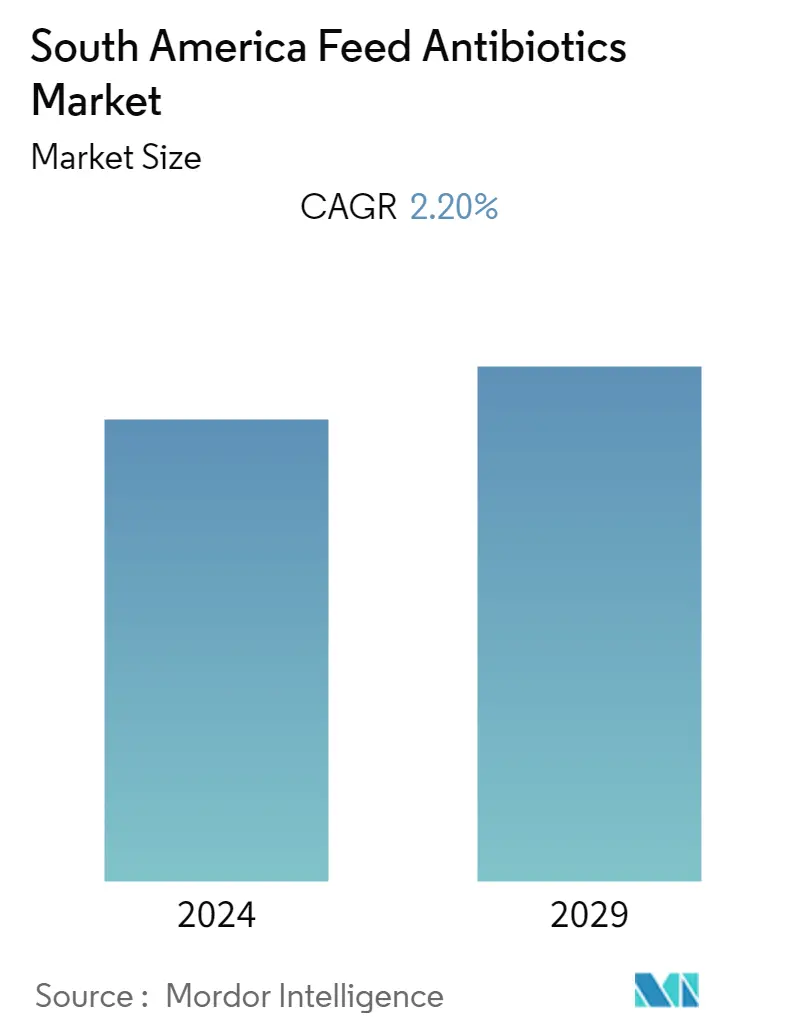
South America Feed Antibiotics Market Size

| Study Period | 2019 - 2029 |
| Base Year For Estimation | 2023 |
| Forecast Data Period | 2024 - 2029 |
| Historical Data Period | 2019 - 2022 |
| CAGR | 2.20 % |
Major Players
*Disclaimer: Major Players sorted in no particular order |
Need a report that reflects how COVID-19 has impacted this market and its growth?
South America Feed Antibiotics Market Analysis
The South America feed antibiotics market is projected to register a CAGR of 2.2% during the forecast period 2020-2025. Industrialization, increasing animal disease, expansion of the meat market, and changing demographics are the major factors for attractiveness in this region. The feed antibiotics are used in the livestock industry to obtain a high feed efficiency rate and to prevent and treat disease in the herds of animals or in an individual animal. Tetracyclines, Penicillins, sulfonamide, macrolides are some of the major antibiotics used in the livestock industry.
South America Feed Antibiotics Market Trends
This section covers the major market trends shaping the South America Feed Antibiotics Market according to our research experts:
Increased Livestock Production
Increasing meat-based product consumption resulted in a surge in livestock production. According to the Chamber of Industry and Commerce of Meat and Derivatives of the Argentina Republic (CICCRA), in 2017, Argentina recorded one of the largest per capita beef consumption levels in the world, at 55.9 kg per head, and the poultry consumption was 39.9 kg per capita. According to the Food and Agriculture Organization, the poultry population in 2016 was 2521754 thousand heads and increased to 2684758 thousand heads in the year 2018 whereas the ruminants population was 85703185 heads in 2016 and increased to 87284331 heads in 2018 in South America. Poultry market is growing by 10% each year and is focused on exporting as the cost of chicken meat produced in Argentina is one of the cheapest in the world. To meet the demand, meat and milk producers tend to increase their supply by boosting productivity. Feed antibiotics are one of the ways by which meat quality and milk production can be increased.

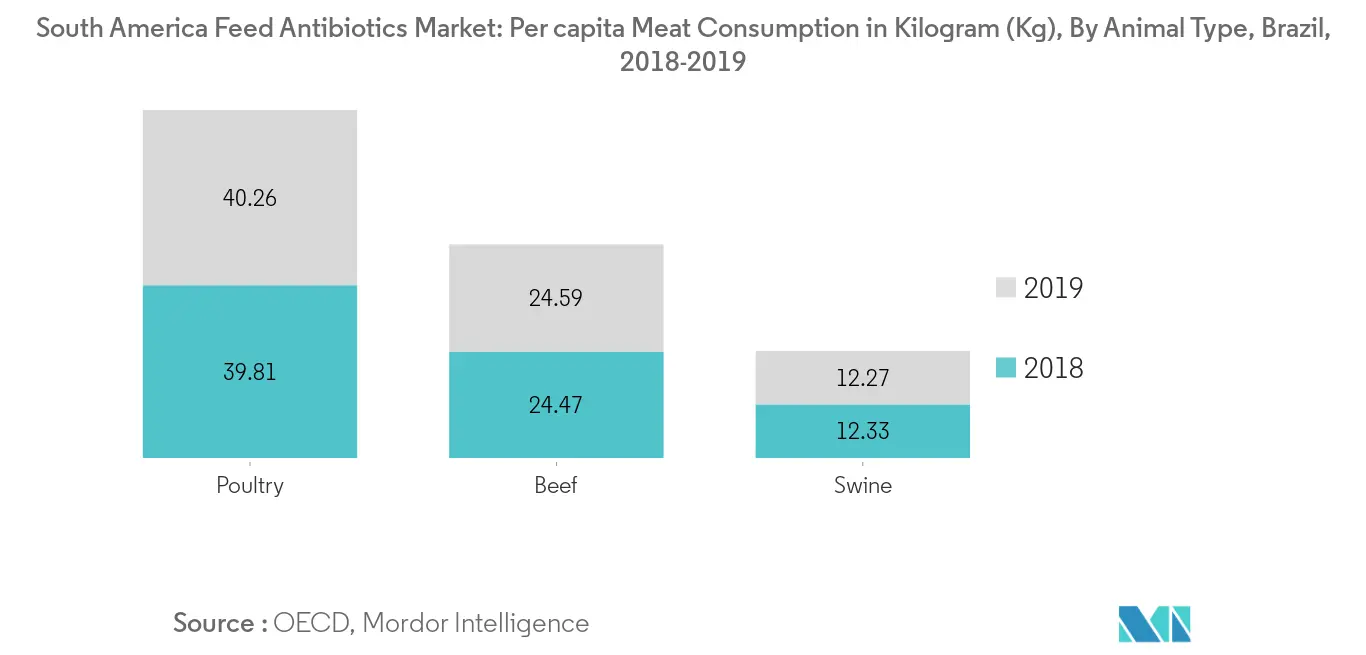
Increased Meat Consumption Among Consumer
Despite the increasing concern regarding the antimicrobial resistance in humans due to the use of antibiotics in livestock, meat consumption is increasing every year. According to the Organisation for Economic Co-ordination and Development (OECD), the per capita poultry meat consumption in Brazil was 39.81 kg, swine consumption was 12.33 kg and beef consumption was 24.47 kg in the year 2018. Poultry meat is the most consumed by humans with higher per capita consumption in the region. In general, antibiotics in livestock is used to treat and prevent disease in the livestock. But in a few countries, farmers also use this to increase the weight of their animals. According to the American meat institute, consuming the meat of the animal treated with antibiotic cause antimicrobial resistance in humans (resistance to that antibiotics). The government of various countries is following strict regulations to monitor and regulate the usage of antibiotics by educating farmers and so on. This abolishes the misconception of usage in livestock leading to an increase in meat consumption, increasing the need for quality meat production with the help of antibiotics.
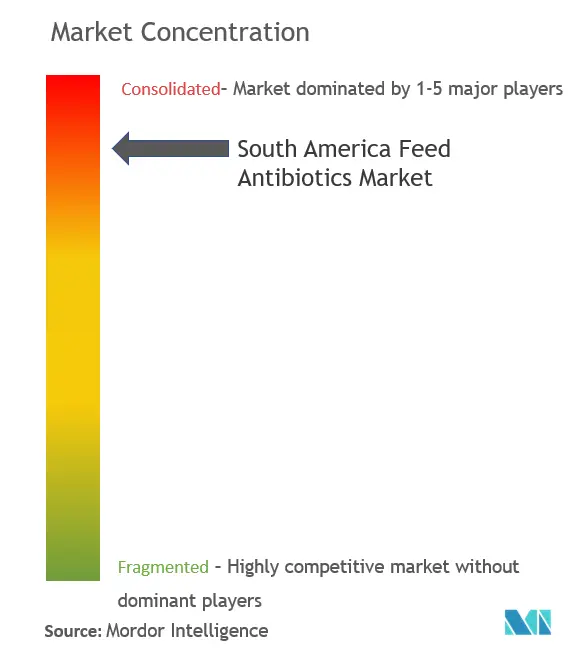
South America Feed Antibiotics Industry Overview
The feed antibiotics market in South America is a consolidated market with few major players like Bayer Health care, Merck Animal Health, Boehringer Ingelheim International GmbH, and Elanco accounting for more than 50% of the total market share. The companies follow mergers and acquisitions, expansions, investment in R&D are some of the few most adopted strategies by these players in expanding their business.
South America Feed Antibiotics Market Leaders
Bayer Healthcare AG
American Regent Inc.
Merck Animal Health
Beohringer International
Elanco Animal Inc.
*Disclaimer: Major Players sorted in no particular order
South America Feed Antibiotics Market Report - Table of Contents
-
1. INTRODUCTION
-
1.1 Study Deliverables
-
1.2 Study Assumptions
-
1.3 Scope of the Study
-
-
2. RESEARCH METHODOLOGY
-
3. EXECUTIVE SUMMARY
-
4. MARKET DYNAMICS
-
4.1 Market Overview
-
4.2 Market Drivers
-
4.3 Market Restraints
-
4.4 Porters Five Force Analysis
-
4.4.1 Threat of New Entrants
-
4.4.2 Bargaining Power of Buyers/Consumers
-
4.4.3 Bargaining Power of Suppliers
-
4.4.4 Threat of Substitute Products
-
4.4.5 Intensity of Competitive Rivalry
-
-
-
5. MARKET SEGMENTATION
-
5.1 Type
-
5.1.1 Tetracyclines
-
5.1.2 Penicillins
-
5.1.3 Sulfonamides
-
5.1.4 Macrolides
-
5.1.5 Aminoglycosides
-
5.1.6 Cephalosporins
-
5.1.7 Others
-
-
5.2 Animal Type
-
5.2.1 Ruminant
-
5.2.2 Poultry
-
5.2.3 Swine
-
5.2.4 Aquaculture
-
5.2.5 Others
-
-
5.3 Geography
-
5.3.1 Argentina
-
5.3.2 Brazil
-
5.3.3 Rest of South America
-
-
-
6. COMPETITIVE LANDSCAPE
-
6.1 Most Adopted Strategies
-
6.2 Market Share Analysis
-
6.3 Company Profiles
-
6.3.1 Bayer HealthCare AG
-
6.3.2 Merck Animal Health
-
6.3.3 Zomedica
-
6.3.4 Elanco
-
6.3.5 Zoetis
-
6.3.6 American Regent Inc.
-
6.3.7 LG Life Sciences Limited
-
-
-
7. MARKET OPPORTUNITIES AND FUTURE TRENDS
-
8. IMPACT OF COVID 19
South America Feed Antibiotics Industry Segmentation
The South America Feed Antibiotics Market is Segmented By Type (Tetracyclines, Penicillins, Sulfonamides, Macrolides, Aminoglycosides, Cephalosporins, and Others), By Animal Type (Ruminant, Poultry, Swine, Aquaculture, and Others), in the countries like Brazil, Argentina and Rest of South America.
| Type | |
| Tetracyclines | |
| Penicillins | |
| Sulfonamides | |
| Macrolides | |
| Aminoglycosides | |
| Cephalosporins | |
| Others |
| Animal Type | |
| Ruminant | |
| Poultry | |
| Swine | |
| Aquaculture | |
| Others |
| Geography | |
| Argentina | |
| Brazil | |
| Rest of South America |
South America Feed Antibiotics Market Research FAQs
What is the current South America Feed Antibiotics Market size?
The South America Feed Antibiotics Market is projected to register a CAGR of 2.20% during the forecast period (2024-2029)
Who are the key players in South America Feed Antibiotics Market?
Bayer Healthcare AG, American Regent Inc., Merck Animal Health, Beohringer International and Elanco Animal Inc. are the major companies operating in the South America Feed Antibiotics Market.
What years does this South America Feed Antibiotics Market cover?
The report covers the South America Feed Antibiotics Market historical market size for years: 2019, 2020, 2021, 2022 and 2023. The report also forecasts the South America Feed Antibiotics Market size for years: 2024, 2025, 2026, 2027, 2028 and 2029.
South America Feed Antibiotics Industry Report
Statistics for the 2024 South America Feed Antibiotics market share, size and revenue growth rate, created by Mordor Intelligence™ Industry Reports. South America Feed Antibiotics analysis includes a market forecast outlook to 2029 and historical overview. Get a sample of this industry analysis as a free report PDF download.
South America Feed Antibiotics Report Snapshots


