
Africa Entertainment And Telecommunication Market Size and Share
Market Overview
| Study Period | 2021 - 2031 |
|---|---|
| Forecast Data Period | 2026 - 2031 |
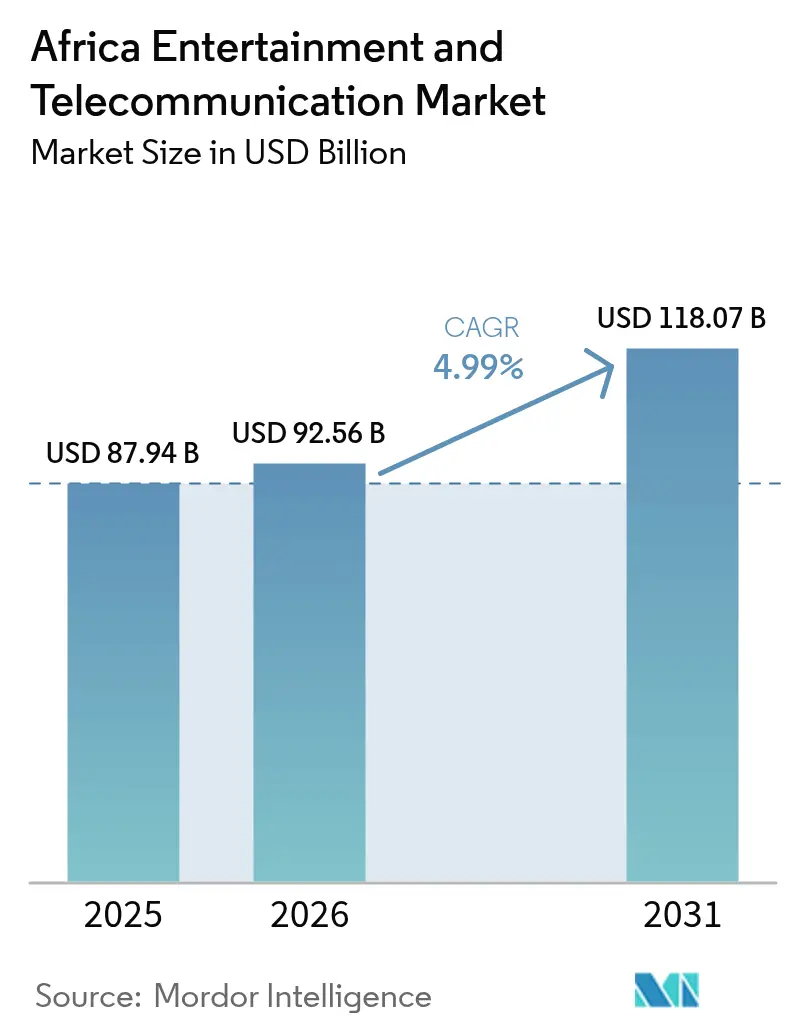
| Base Year Market Size (2025) | USD 87.94 Billion |
| Market Size (2026) | USD 92.56 Billion |
| Market Size (2031) | USD 118.07 Billion |
| Growth Rate (2026 - 2031) | 4.99% CAGR |
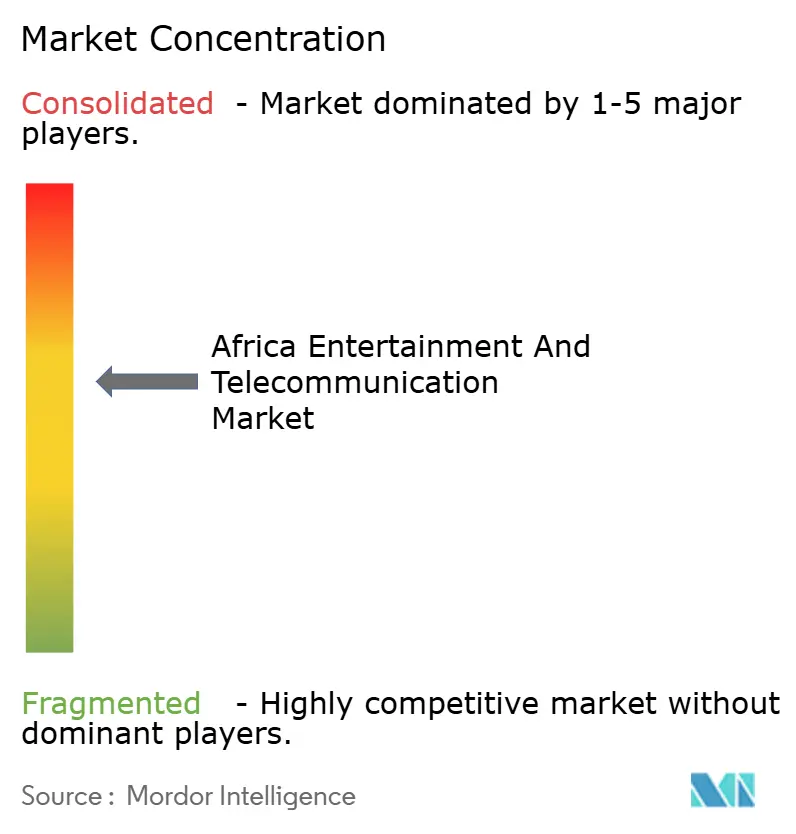
| Market Concentration | Medium |
Major Players *Disclaimer: Major Players sorted in no particular order Image © Mordor Intelligence. Reuse requires attribution under CC BY 4.0. | |
Africa Entertainment And Telecommunication Market Analysis by Mordor Intelligence
The Africa entertainment and telecommunication market size is expected to grow from USD 87.94 billion in 2025 to USD 92.56 billion in 2026 and is forecast to reach USD 118.07 billion by 2031 at 4.99% CAGR over 2026-2031. Robust mobile-first infrastructure, early 5G fixed-wireless access, and low-earth-orbit satellite rollouts collectively widen broadband availability while sidestepping legacy fixed-line constraints. Infrastructure-sharing mandates compress tower capital expenditure, freeing operator cash flow for spectrum acquisitions and network densification. Local-content quotas spur international streaming platforms to finance Nollywood and Afrobeats originals, accelerating data traffic and subscription uptake. Meanwhile, coastal hyperscale data centers reduce latency for cloud gaming and other edge workloads, stimulating premium-speed data bundle sales.
Key Report Takeaways
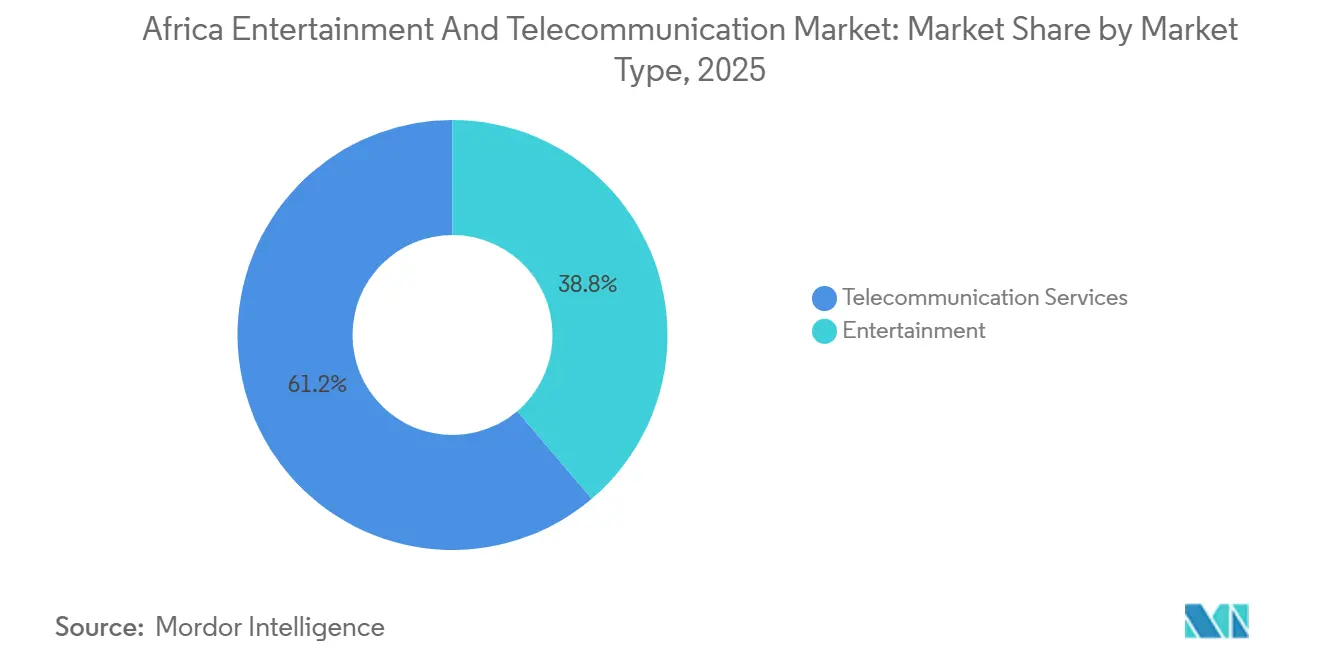
- Telecommunication services led with 61.22% revenue share in 2025, while entertainment is advancing at a 5.67% CAGR through 2031.
- By connectivity technology, 4G and LTE held 46.47% of the Africa entertainment and telecommunication market share in 2025, whereas 5G is the fastest growing layer at 5.45% CAGR to 2031.
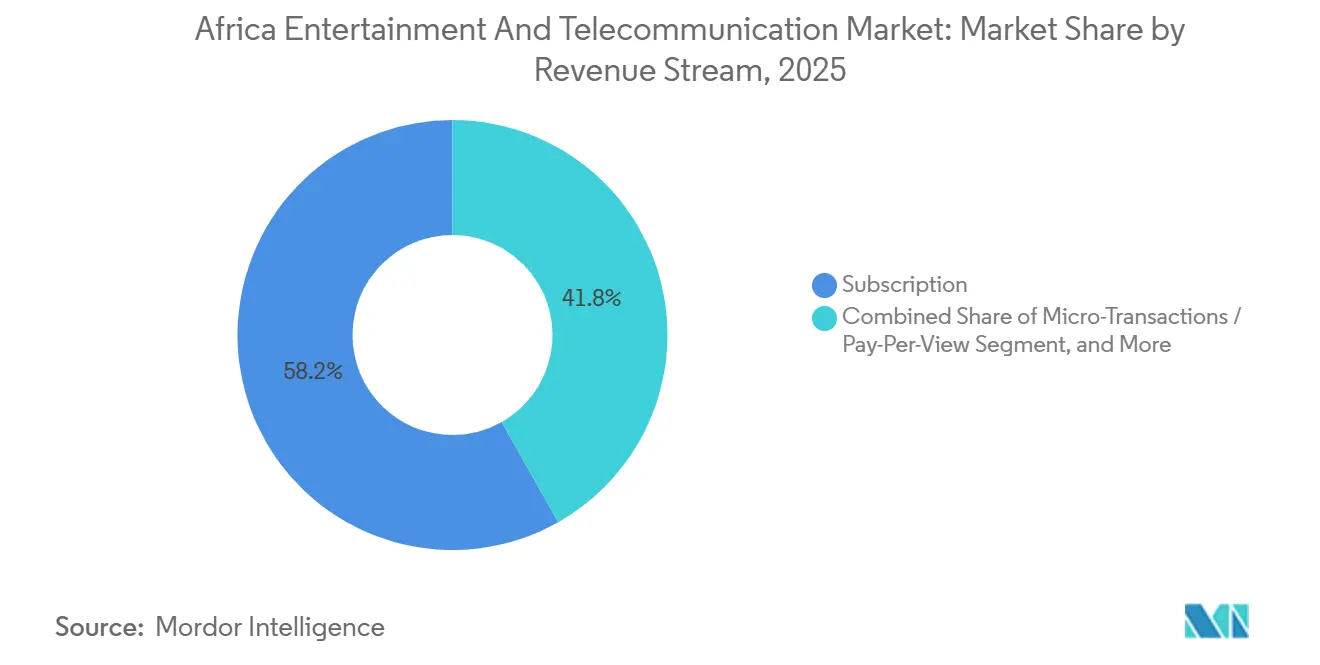
- By revenue stream, subscriptions contributed 58.19% of value in 2025, yet micro-transactions and pay-per-view are projected to expand at 5.94% CAGR between 2026-2031.
- By subscriber category, consumers represented 72.53% of the Africa entertainment and telecommunication market size in 2025, while enterprise accounts are poised for the quickest rise at 5.87% CAGR through 2031.
- By geography, South Africa commanded 26.72% revenue share in 2025, but Nigeria posts the strongest growth trajectory at 5.81% CAGR to 2031.
Note: Market size and forecast figures in this report are generated using Mordor Intelligence’s proprietary estimation framework, updated with the latest available data and insights as of 2026.
Africa Entertainment And Telecommunication Market Trends and Insights
Drivers Impact Analysis*
| Driver | (~) % Impact on CAGR Forecast | Geographic Relevance | Impact Timeline |
|---|---|---|---|
| Rapid rollout of 5G fixed-wireless access in capital cities | +1.20% | South Africa, Nigeria, Kenya, Egypt, Morocco | Short term (≤ 2 years) |
| Mobile-money-bundled data plans among unbanked youth | +1.00% | East Africa (Kenya, Tanzania, Uganda), West Africa (Nigeria, Ghana) | Medium term (2-4 years) |
| Infrastructure-sharing mandates lowering tower capex | +0.80% | Pan-African, with early adoption in Nigeria, South Africa, Kenya | Medium term (2-4 years) |
| Local-content incentives boosting OTT subscriptions | +0.70% | Nigeria, South Africa, Kenya, Ghana | Medium term (2-4 years) |
| Coastal hyperscale data centers enabling cloud gaming | +0.50% | Nigeria (Lagos), Kenya (Nairobi), South Africa (Cape Town, Johannesburg) | Long term (≥ 4 years) |
| Expansion of low-earth-orbit satellite constellations for rural connectivity | +0.60% | Rural and peri-urban zones across Sub-Saharan Africa | Long term (≥ 4 years) |
| Source: Mordor Intelligence | |||
Rapid Rollout of 5G Fixed-Wireless Access in Capital Cities
Capital deployments of 5G fixed-wireless access supply fiber-like speeds at roughly one-third of last-mile cost. Operators such as MTN South Africa and Safaricom Nairobi marketed unlimited home-broadband plans that undercut local fiber by about 30%.[1]Safaricom PLC, “Annual Report and Financial Statements 2025,” safaricom.co.ke National regulators obligate passive-infrastructure sharing, trimming site acquisition delays and smoothing fast-track rollouts. Because household fixed-line penetration lingers under 1% across most African economies, 5G emerges as the primary household pipe rather than a pure mobile upgrade. The model also pushes legacy internet service providers toward wholesale alignment, deepening operator dominance at the access layer.
Mobile-Money-Bundled Data Plans Among Unbanked Youth
Linking airtime and data purchases to mobile-wallet top-ups converts unbanked youths into digital subscribers without credit cards. Platforms such as M-Pesa, Telebirr, and MTN Mobile Money embed frictionless data-bundle menus inside payment apps, slashing acquisition costs and lifting ecosystem stickiness. Agent networks originally designed for cash-in and cash-out activities now double as connectivity storefronts across peri-urban markets. As mobile-money throughput nears the USD 700 billion mark annually, bundled data plans remain a prime lever for prepaid growth, especially where scratch-card distribution is expensive or insecure.
Infrastructure-Sharing Mandates Lowering Tower Capex
Nigeria, Kenya, and South Africa direct operators to co-locate equipment on common masts, reducing per-site capital outlay by roughly 25-30%. Higher tenancy ratios improve tower-company asset returns, luring infrastructure-fund capital and widening rural coverage economics. Lower diesel use at shared sites further trims operating costs and aligns with decarbonization pledges. Cost savings free cash for mid-band spectrum auctions and urban 5G densification, reinforcing a cycle in which lighter balance-sheet stress feeds broader network footprints.[2]GSMA, “Mobile Economy Sub-Saharan Africa 2025,” gsma.com
Local-Content Incentives Boosting OTT Subscriptions
Mandatory quotas require global streaming brands to dedicate 30% of catalog budgets to African productions, triggering a wave of Nollywood and local-language commissions. Regional platforms that already source predominantly domestic content gain licensing leverage, stretching marketing reach without equivalent budget escalation. Subscriber additions quicken where exclusive originals align with national culture and language, while tax rebates on domestic shoots attract foreign studios and upskill local crews. The uplift in creative-sector spending supports a broader digital-economy narrative that underpins steady data-traffic growth.
Restraints Impact Analysis*
| Restraint | (~) % Impact on CAGR Forecast | Geographic Relevance | Impact Timeline |
|---|---|---|---|
| Under-sea cable fragility causing backbone outages | -0.90% | West Africa (Nigeria, Ghana, Senegal, Côte d'Ivoire), East Africa (Kenya, Tanzania) | Short term (≤ 2 years) |
| Currency devaluation compressing ARPU in key markets | -0.80% | Nigeria, Egypt, Ghana, Zambia | Medium term (2-4 years) |
| Nollywood and Afrobeats piracy on Telegram channels | -0.50% | Nigeria, South Africa, Kenya, Ghana | Medium term (2-4 years) |
| High 3.5 GHz spectrum fees delaying 5G in Francophone Africa | -0.40% | Francophone West and Central Africa (Senegal, Côte d'Ivoire, Cameroon, Gabon) | Long term (≥ 4 years) |
| Source: Mordor Intelligence | |||
Under-Sea Cable Fragility Causing Backbone Outages
Submarine-fiber breaks exposed reliance on single routes when a 2024 failure sidelined 12 nations for three days. Mobile operators throttled video, enterprises lost cloud uptime, and local e-commerce shed over USD 100 million in potential transactions. Slow repair-ship mobilization underscores the need for mesh topologies and redundant landings, yet financing remains constrained. Until additional loops like Equiano and 2Africa fully land, corporate digital-transformation projects face elevated continuity risk.
Currency Devaluation Compressing ARPU in Key Markets
Sharp local-currency falls erode revenue once translated into U.S. dollars, even where nominal local pricing rises. Operators hold substantial U.S.-dollar liabilities for spectrum and equipment, so margin squeeze restrains reinvestment appetite. Frequent bundle repricing stresses subscriber loyalty and accelerates churn toward lower-priced competitors. Volatility also complicates long-range capital planning, nudging firms to hedge at higher cost or delay radio-access modernizations.
*Our forecasts treat driver/restraint impacts as directional, not additive. The impact forecasts reflect baseline growth, mix effects, and variable interactions.
Segment Analysis
By Market Type: Entertainment Outpaces Legacy Voice Revenue
Entertainment added momentum to the Africa entertainment and telecommunication market size as telecommunication services still accounted for 61.22% of 2025 earnings. Voice revenue slipped to 18% of the telecommunication mix after over-the-top chat apps displaced domestic and international calling minutes. Data now underwrites 68% of operator turnover, mainly from video streaming, social networking, and nascent cloud use. Complementary services such as mobile money and IoT delivered 14% and grow double digits because enterprises demand connected devices for agriculture and logistics.
Subscription video-on-demand held 42% of entertainment receipts in 2025, buoyed by Showmax, Netflix, and IrokoTV, while digital music captured 22% thanks to Boomplay's surging user base. Video gaming secured 18% and gains extra lift from mobile esports, a format well suited to Africa's handset-first habits. E-publishing and digital advertising combined for the residual slice, but both still climb as smartphone adoption widens and print legacy channels migrate online. Collectively, entertainment’s superior 5.67% CAGR confirms a pivot toward content monetization inside the wider Africa entertainment and telecommunication market.


By Connectivity Technology: 5G Gains Despite 4G Dominance
4G and LTE owned 46.47% Africa entertainment and telecommunication market share in 2025, affirming their status as workhorse layers. Yet 5G advances at a 5.45% clip because fixed-wireless packages undercut home fiber while matching speed expectations. Legacy 2G and 3G footprints continue to recede as sub-USD 50 smartphones arrive, freeing spectrum for higher efficiency air interfaces. Satellite broadband’s 3% revenue share may seem minor, but Starlink-driven landmark pricing shifts the competitive calculus in underserved provinces.
By 2025, 29 nations counted at least one active 5G network, and operators tout installation costs roughly one-quarter of fiber deployments, lifting return profiles. Spectrum auctions, however, move at uneven cadence; Francophone reserve prices slow launches and cede mindshare to Anglophone peers. Long-run uptake hinges on smartphone affordability and the regulatory pace at which digital-dividend and 3.5 GHz bands clear for commercial use.
By Revenue Stream: Micro-Transactions Challenge Subscription Bundles
Subscriptions still ruled 58.19% of 2025 inflows, yet consumer behavior skews toward micro-spend as disposable income ebbs and inflation climbs. Daily and weekly prepaid packets align with irregular earnings cycles, unlike postpaid contracts that linger below 10% penetration outside South Africa and Kenya. Advertising-funded apps draw eyeballs but face ad-load tolerance ceilings, prompting content owners to test freemium ladders.
Showmax’s mobile-only tier demonstrates hybrid monetization, with single-title rentals capturing impulse demand while nurturing trialists into repeat payers. Mobile gaming micro-purchases average USD 1.50 but scale on a 120 million-gamer base, illustrating long-tail economics. Wholesale licensing remains niche, yet operators see margin upside in asset-light syndication, especially where regulatory ceilings cap direct pricing power.

By Subscriber Category: Enterprise Adoption Accelerates IoT Deployment
Consumers formed 72.53% of 2025 SIM and subscription lines, undergirded by rising smartphone penetration and 6.2 GB average monthly usage. Prepaid dominates because credit access is limited, making small bundle denominations critical. Enterprises, though smaller in headcount, expand faster and command higher average revenue per connection, pushing the Africa entertainment and telecommunication market size into higher-margin territory.
Small and medium enterprises integrate point-of-sale terminals with mobile wallets, emphasizing affordability, whereas large firms embrace dedicated fiber and private 5G for latency-sensitive industrial automation. IoT links touched 45 million units in 2025, with livestock tracking and fleet telematics leading the pack. Two-factor authentication messaging services also contribute meaningful enterprise revenue, highlighting a diversified corporate ARPU mix.
Geography Analysis
South Africa contributed 26.72% to 2025 turnover, buoyed by mature infrastructure and an 88% smartphone penetration rate. Nigeria, holding 28% share within West Africa, enjoys the highest forward growth at 5.81% CAGR, aligned to its 220 million population and early 5G exploits. Kenya delivered 9% of regional value, leveraging M-Pesa’s ecosystem to bundle connectivity and finance, while Egypt captured 8% but faces forex headwinds that dilute margins despite rapid fiber rollouts.
West Africa collectively generated 38% of the Africa entertainment and telecommunication market size in 2025, thanks to mobile-money prevalence and tower-sharing policies that slash rural build costs. East Africa supplied 22%, led by Kenya’s fintech nexus and Ethiopia’s market liberalization, which dents the former monopoly’s comfort zone. North Africa’s 15% share leans on comparatively stronger fixed-line bases, yet currency pressure tempers capex. Southern Africa, outside South Africa, grows more slowly as smaller economies wrestle with import-price inflation for radio equipment, although satellite broadband introductions in Zambia and Zimbabwe begin narrowing the digital divide.
Urban hubs host edge compute that lowers gaming and enterprise-cloud latency under 50 ms, fortifying premium-data bundle uptake. Rural advancement, meanwhile, pivots on Starlink and allied LEO networks delivering 100 Mbps links at USD 60 monthly, pressuring incumbents to hasten 4G densification before satellite mindshare solidifies.
Regulatory Landscape
Africa's regulatory agenda for telecommunications and digital media is shifting toward continental coordination alongside country-level spectrum and infrastructure rules. In March 2026, African ICT ministers adopted the Algiers Declaration on African Telecommunications Sovereignty and Integrated Connectivity (2026-2030), a roadmap that references universal connectivity, cross-border digital infrastructure, and a framework direction for regulating OTT platforms. Uneven spectrum readiness continues to shape rollout speed, with fewer than 30% of African nations having allocated 5G spectrum by mid-2025, which keeps national regulator timelines and reserve-price decisions central to deployment pacing.
Implementation capacity and cross-border governance are being advanced through African Union and regional bodies. In May 2026, the African Union Commission deployed the 3rd cohort of the AU Digital and Innovation Fellowship to support operationalization of the Digital Transformation Strategy for Africa (2020-2030), linking digital connectivity to digital public infrastructure and data policy. In June 2026, Smart Africa and EACO signed a 36-month MoU to harmonize digital policies and facilitate cross-border digital services, reducing compliance fragmentation for operators and content platforms seeking regional scale.
Competitive Landscape
The top five operators MTN Group, Vodacom, Orange Middle East and Africa, Airtel Africa, and Safaricom command roughly 55% revenue, yielding a moderately concentrated structure. Tower-sharing accords with IHS Towers and American Tower cut rollout costs by near-30%, aiding profitability amid forex volatility. Strategic thrusts revolve around 5G fixed-wireless, mobile-wallet ecosystems, and edge nodes with hyperscalers; Vodacom-Microsoft Azure’s 35 ms latency milestone exemplifies such collaboration.[3]Vodacom Group, “Financial Results 2025,” vodacom.com
Disruptive entrants include Starlink and OneWeb, whose LEO constellations circumvent terrestrial backhaul gaps, and regional content specialists like IrokoTV that leverage local-content rules to win culturally attuned audiences cheaper than global giants. Smaller operators such as Rain focus on data-only propositions that skip voice overhead and emphasize unlimited models. Regulatory reforms such as mandatory infrastructure sharing and spectrum-auction redesign lower financial barriers for green-field aspirants and promote service-based competition rather than pure facilities play.
Patent filings around network slicing, edge orchestration, and fintech-telco convergence signal a shift from hardware-centric expansion to software-driven differentiation. Operators aim to fold cloud services, content, and payments into single-pane-of-glass super-apps, raising switching costs and insulating against over-the-top encroachment. The Africa entertainment and telecommunication market therefore evolves toward vertically integrated digital ecosystems anchored by mobile connectivity.
Africa Entertainment And Telecommunication Industry Leaders
Telkom SA SOC Ltd
Orange Africa & Middle-East
MTN Group
Maroc Telecom SA
Vodacom Group Limited
- *Disclaimer: Major Players sorted in no particular order

Market Opportunities and Future Outlook
Backbone and metro capacity additions create whitespace for higher-quality video, gaming, and enterprise cloud services where latency and reliability have constrained adoption. In May 2026, an Orange-backed consortium initiated the Via Africa subsea cable project (20,000 km) linking Europe to Atlantic coastal African markets including Nigeria, Senegal, and Cote d'Ivoire, while Seacom launched a high-capacity terrestrial fiber route between Nairobi (Kenya) and Kampala (Uganda) in June 2026. Safaricom's July 2026 confirmation as the Kenyan landing partner for Meta's Daraja subsea cable into Mombasa further anchors new international capacity and landing-station activity, supporting hyperscale and edge-node buildouts connected to cloud-enabled entertainment and digital services.
A second opportunity set sits where regulatory restructuring overlaps with platform-led monetization, spanning OTT, advertising-funded content, and mobile-money bundling. Senegal's National Assembly adopted a law in March 2026 establishing the National Media Regulatory Council (CNRM) to regulate digital platforms, social media, and AI alongside traditional media, tightening governance expectations for streaming and creator platforms. Nigeria's July 2026 direction to defer enforcement of internet platform rules pending policy harmonization points to an active policy reset that favors clearer, consolidated compliance pathways for cross-border operators and content providers. On the access side, Ghana's July 2026 removal of NGIC's wholesale 5G exclusivity opens space for additional wholesale and retail 5G models, while AXIAN Telecom (Yas) securing up to EUR 270 million from the EBRD in July 2026 for fiber deployment and 4G/5G modernization in Senegal and Kenya reflects ongoing investable demand for network upgrades that can support subscriptions and micro-transaction-led entertainment spend.
Recent Industry Developments
- June 2026: MTN Group Fintech partnered with Ant International to launch a super-app platform in Nigeria aimed at expanding MoMo ecosystem services. The initiative strengthens MTN's position in bundled connectivity and payments, supporting higher-frequency micro-purchase behavior across digital content and services.
- December 2025: Vodacom Group acquired a 30% stake in Community Investment Ventures Holdings for USD 180 million, adding access to around 1.2 million additional fiber connections. The stake expands Vodacom's fixed broadband footprint that supports higher-capacity video streaming, cloud use, and enterprise connectivity bundles.
- March 2024: A major undersea cable failure disrupted connectivity across 12 African countries for about three days, exposing concentration risk in international and regional backbone routes. The outage increased operator and policymaker focus on redundancy, diversified landings, and alternative backhaul, which affects service quality for streaming, gaming, and cloud applications.


Research Methodology Framework and Report Scope
Market Definition and Coverage
This market is defined as revenues earned from telecommunication services and entertainment services delivered across Africa, including consumer and enterprise usage. The coverage reflects how connectivity enables content access, and how entertainment is monetized through subscriptions, advertising, and paid viewing.
Scope exclusions: Hardware device sales (such as handsets, TVs, or routers) and pure infrastructure construction revenues are not counted in this market value.
Segmentation Overview
- By Market Type
- Telecommunication Services
- Voice (Fixed And Mobile)
- Data (Fixed And Mobile)
- Other Telco Services (IoT, Messaging)
- Entertainment
- Digital Music
- Download
- Streaming
- Video Games
- Video-On-Demand
- Svod
- Tvod
- Download-To-Own
- E-Publishing
- Advertising
- Newspaper
- Magazine
- Digital Music
- Telecommunication Services
- By Connectivity Technology
- 2G
- 3G
- 4G / LTE
- 5G
- Satellite Broadband
- By Revenue Stream
- Subscription
- Advertising-Funded
- Micro-Transactions / Pay-Per-View
- Licensing And Wholesale
- By Subscriber Category
- Consumer
- Enterprise
- Sme
- Large Enterprise
Data Sources, Market Sizing, and Validation
Desk Research
Desk research was used to set the market structure and to anchor the model in consistent public indicators before field checks were run. We referenced sources such as the International Telecommunication Union (ITU), World Bank, national telecom regulators and ministries, GSMA public insights, and UNESCO cultural statistics to understand subscriber bases, data usage, and broader demand patterns.
To convert activity signals into market value, we also reviewed operator annual reports, audited filings, investor presentations, and credible press coverage on pricing moves, spectrum rollout, and packaging changes. Where company financial split data was not fully visible, we used paid subscriptions focused on company financials and intelligence, along with news and financials, to standardize revenue mapping across markets. This list of sources is illustrative, and additional public references were also used to collect data, validate it, and clarify assumptions.
Primary Interviews and Surveys
Primary work was used to confirm how telecom and entertainment revenues are recognized in practice, and to stress test pricing, adoption, and monetization trends at a country level. We spoke with a mix of telecom operators, content distributors, regulators, infrastructure partners, enterprise buyers, and industry experts across Africa so gaps from desk findings could be filled and assumptions could be cross-checked before totals were finalized.
Distribution of primary research fieldwork respondents
| Company type | Respondent position | Region |
|---|---|---|
| Top tier: 29% | CXOs: 15% | |
| Mid tier: 51% | Functional/Unit leaders: 32% | |
| Smaller Players: 20% | Managers: 53% |
Market-Sizing & Forecasting
The core sizing logic is a top-down build where subscriber bases and usage indicators are translated into revenue pools by service type, then reconstructed by connectivity technology and revenue stream. In practice, inputs such as mobile and fixed subscriber counts, ARPU ranges, data consumption growth, 4G/LTE and 5G coverage expansion, and advertising intensity in digital media were treated as the main value drivers that move the totals.
Selective bottom-up approximations were then used to keep the total grounded, including roll ups from a sample of operator revenues, channel checks on pricing packs, and sampled ASP times volume checks for paid content formats (such as pay-per-view and micro-transactions). When country level splits were missing, gaps were handled using proxy ratios from comparable markets, then corrected using interview feedback, so the final country mix stayed realistic.
For forecasting, scenario analysis was used to reflect how network upgrades, spectrum availability, and local content and licensing dynamics can shift outcomes year to year. Assumptions were also aligned to expert views on adoption timing so the model did not overreact to short-term promotions or one-off events.
Data Validation & Update Cycle
Model outputs were checked against independent signals such as reported telecom service revenues, subscriber and SIM penetration trends, and technology migration shares to ensure totals remained consistent with observed market behavior. Variance checks were run at multiple levels, and outliers were reviewed again with supporting logic, or re-contact triggers when a number moved beyond an expected range.
Before sign-off, the work goes through a multi-step analyst review so the calculations, assumptions, and conversions remain consistent across countries and revenue streams. Reports are refreshed annually, and interim updates are made when material events occur, such as sharp currency swings, major pricing resets, or policy changes that alter market direction. Right before delivery, a fresh pass is completed so clients receive the latest updated view.
Mordor Intelligence's Africa Entertainment and Telecommunication Market Size Measured Against Other Published Estimates
Published market values for Africa entertainment and telecommunication can differ even when the topic name looks similar, because the included revenue lines and the timing of key inputs are not handled the same way. Differences usually come from whether the work blends adjacent industries, how pricing and currency are normalized, and how quickly the model is refreshed after market shocks.
Device and network equipment sales sit outside Mordor Intelligence's scope here, which is one reason our total can look lower than estimates that mix service revenues with hardware and rollout spend. Another gap often comes from how content monetization is treated, where some figures use aggressive assumptions for ad funded growth or count wholesale licensing without checking for double counting across distributors.
Benchmark comparison
| Source | Market Size | Gaps in Research Methodology |
|---|---|---|
| Mordor Intelligence | USD 87.94 B (2025) | |
| Industry Association A | USD 95.20 B (2025) | Often includes device sales and parts of network equipment revenue alongside service spend, and may apply blended ARPU assumptions without a clear split by technology migration. |
| Global Consultancy B | USD 83.10 B (2025) | Tends to use conservative currency conversion timing and slower uptake for 5G and digital entertainment monetization, which can compress the value pool versus observed price pack changes. |
Across the three numbers, the spread is mainly explained by what is counted as service revenue versus adjacent hardware or infrastructure spend, and by how pricing and currency timing are treated. By keeping the model tied to subscriber, coverage, ARPU, and monetization signals that can be checked in the open, the resulting estimate stays easier to trace and repeat for planning decisions.


Key Questions Answered in the Report
How large will Africa’s entertainment and telecommunication market be by 2031?
The sector is projected to reach USD 118.07 billion by 2031.
Which connectivity technology is expanding the fastest across Africa?
5G is registering the quickest rise, advancing at a 5.45% CAGR through 2031 thanks to fixed-wireless access rollouts.
Which segment currently drives the most revenue?
Telecommunication services remain the primary contributor, accounting for 61.22% of 2025 market value.
Why is Nigeria growing faster than South Africa?
Nigeria combines population scale with rapid 5G deployment and mobile-money-bundled data plans, yielding a 5.81% CAGR that outpaces South Africa.
How are operators keeping network-build costs down?
Regulatory mandates for tower co-location reduce capital expenditure by up to 30%, freeing cash for wider 5G and rural coverage.
What business model is challenging traditional subscriptions?
Micro-transactions and pay-per-view options are expanding at a 5.94% CAGR, reflecting consumer demand for granular spending control.
Page last updated on:


