
| Study Period | 2018 - 2030 |
| Base Year For Estimation | 2024 |
| Forecast Data Period | 2025 - 2030 |
| Market Size (2025) | USD 3.65 Billion |
| Market Size (2030) | USD 5.93 Billion |
| CAGR (2025 - 2030) | 10.16 % |
| Market Concentration | Low |
Major Players*Disclaimer: Major Players sorted in no particular order |


Africa Energy Drinks Market Analysis
The Africa Energy Drinks Market size is estimated at 3.65 billion USD in 2025, and is expected to reach 5.93 billion USD by 2030, growing at a CAGR of 10.16% during the forecast period (2025-2030).
The African energy drink industry landscape is experiencing significant transformation, driven by rapid urbanization and changing consumer demographics. The region's urban population reached 652 million in 2023 and is projected to expand to 722 million by 2026, creating new consumption patterns and market opportunities. This urbanization trend has led to the emergence of modern retail formats and improved distribution networks, making energy drinks more accessible to consumers. The shift towards urban living has also contributed to busier lifestyles and increased demand for convenience products, particularly among young professionals and students seeking energy-boosting beverages. Major retailers are responding to this trend by expanding their presence, with companies like Spar operating 2,500 stores in South Africa alone as of 2022.
Health consciousness and wellness trends are reshaping consumer preferences in the African energy drink market. A notable demographic shift is occurring in South Africa, where approximately 50% of the adult population was either overweight (23%) or obese (27%) in 2022, with the World Obesity Federation projecting adult obesity rates to reach 37% by 2030. This health awareness has led to increased demand for beverages with functional benefits and cleaner ingredients. Manufacturers are responding by introducing products with reduced sugar content, natural caffeine sources, and added vitamins and minerals. The industry is witnessing a significant shift towards premium and health-oriented offerings, with companies investing in research and development to create innovative formulations that appeal to health-conscious consumers.
The market is experiencing a notable surge in demand for natural and organic energy drinks, particularly among urban consumers. Recent surveys indicate that approximately 20% of urban populations in key markets like Egypt, Kenya, and South Africa show a strong preference for organic food and beverages. This trend has prompted manufacturers to develop new product lines featuring natural ingredients, herbal extracts, and plant-based energy boosters. Companies are increasingly focusing on clean-label products, transparent ingredient sourcing, and sustainable packaging solutions to meet evolving consumer expectations. The industry is witnessing significant investment in sustainable practices and eco-friendly packaging alternatives, reflecting growing environmental consciousness among African consumers.
Innovation and product diversification are driving market evolution, with manufacturers introducing new flavors and functional variants to capture diverse consumer preferences. The market is particularly resonating with younger demographics, as evidenced by Nigeria's median age of 19.4 in 2022, representing a significant opportunity for energy drink manufacturers. Companies are leveraging advanced marketing strategies and digital platforms to connect with younger consumers, while also focusing on product customization to meet local taste preferences. The industry is seeing increased collaboration between global and local players, leading to the development of unique flavor profiles and formulations specifically tailored for African consumers. This localization strategy has become crucial for market success, with companies investing in local production facilities and distribution networks to better serve regional markets. The market structure of energy drinks in Africa is evolving rapidly, driven by these dynamic changes.
Africa Energy Drinks Market Trends
Consumer perception of energy drinks in Africa is primarily influenced by concerns associated with excessive consumption and potential side effects
- Consumption of energy drinks products is highly valued by individuals of different ages in the African region particularly prevalent among those aged 20 to 30. Energy drink consumption was higher among people who were younger and had higher levels of education.
- Product attributes such as sugar-free and natural ingrdients enrgy drinks attract the consumers in the African region with the rising awareness of the health risks associated with sugar consumption. Sugary drinks have been linked to a number of health problems, including obesity, diabetes, and heart disease.
- The population living in large urban areas in the country has increased constantly supporting the gorwth of energy drinks. The retail price of an average energy drinks ranges between USD 1 to USD 1.50 per 250ml.
- Demand for low calories and sugar free alternatives has risen among consumers in the country due to health effects of high sugar intake and consumption diabetes and obesity. Although approximately 43% of the population is suffering from obesity in Ghana.
Understand The Key Trends Shaping This Market
Download PDF
OTHER KEY INDUSTRY TRENDS COVERED IN THE REPORT
- Companies are focused towards developing specialized formulations tailored to specific needs such as mental focus, workout performance
- Major brands are focusing constantly in product formulations, packaging and functionality to stay competetitve in the market
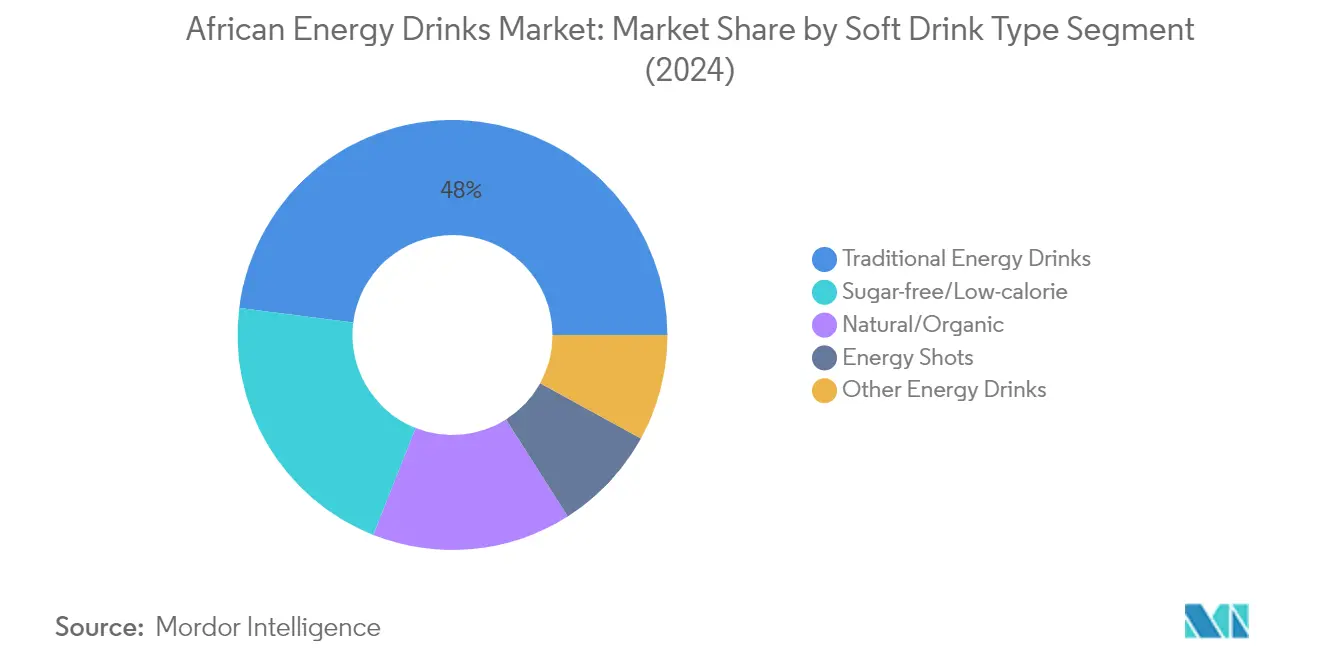
Segment Analysis: Soft Drink Type
Traditional Energy Drinks Segment in African Energy Drinks Market
Traditional energy drinks continue to dominate the African energy drink market, commanding approximately 48% of the market value in 2024. This significant market position is primarily driven by the increasing availability of energy drinks in diverse flavors and ingredient combinations across the region. The segment's strong performance is particularly notable in Nigeria, which stands as the largest consumer of traditional energy drinks, capturing over half of the regional consumption. The surge in demand is largely attributed to Africa's predominantly young demographic profile and their fast-paced lifestyle requirements. Major brands in this segment have been actively expanding their product portfolios with innovative flavors and formulations to maintain their market leadership, while also focusing on enhanced distribution networks across both urban and rural areas.
Natural/Organic Energy Drinks Segment in African Energy Drinks Market
The natural/organic energy drinks segment is experiencing remarkable growth in the African market, projected to achieve approximately 12% growth annually from 2024 to 2029. This impressive growth trajectory is driven by increasing health consciousness among consumers and a growing preference for clean-label products. The segment's expansion is particularly strong in Nigeria, where consumers are increasingly gravitating towards organic food and beverage choices. Manufacturers are responding to this trend by introducing new energy drinks to the market fortified with natural ingredients such as ginseng, green tea extracts, and natural fruit flavors. The segment is also benefiting from the rising awareness about the potential health risks associated with artificial additives and synthetic ingredients, prompting consumers to seek healthier alternatives in their energy drink choices.
Remaining Segments in Soft Drink Type
The African energy drinks market encompasses several other significant segments, including sugar-free/low-calorie energy drinks, energy shots, and other specialized variants. The sugar-free/low-calorie segment has gained substantial traction among health-conscious consumers and those managing their sugar intake. Energy shots, while occupying a smaller market share, serve a distinct consumer base seeking concentrated energy boosts in smaller portions. The other specialized variants category includes functional energy drinks, caffeine-free options, and hybrid beverages that combine energy-boosting properties with other functional benefits. These segments collectively contribute to the market's diversity and cater to specific consumer preferences and dietary requirements across different African regions.
Segment Analysis: Packaging Type
Metal Can Segment in Africa Energy Drinks Market
Metal cans dominate the African energy drinks packaging landscape, commanding approximately 57% market share in 2024. This dominance can be attributed to several key factors, including their superior temperature insulation properties, which keep beverages refreshingly cold a crucial feature in Africa's warm climate. The segment's strong position is further reinforced by consumer preferences and brand associations, as leading energy drink manufacturers predominantly use metal cans for their products. South Africa, a key market in the region, has demonstrated strong recycling capabilities for beverage cans, achieving a recycling rate of 72%, which has positively influenced both consumer acceptance and manufacturer preference for this packaging format. Major brands like Monster Energy and Red Bull have diversified their metal can offerings, introducing various sizes ranging from sleek 355 ml cans to larger 473 ml and 591 ml variants to cater to different consumer preferences and occasions.
Glass Bottles Segment in Africa Energy Drinks Market
The glass bottles segment is experiencing remarkable growth in the African energy drinks market, projected to achieve approximately 14% growth annually from 2024 to 2029. This surge in growth is primarily driven by the increasing consumer perception of glass packaging as a premium and sustainable alternative. The segment's growth is particularly pronounced in the natural/organic energy drinks category, where glass packaging aligns well with the premium positioning and clean-label trends. Glass bottles are gaining favor among manufacturers due to their ability to preserve product quality and enhance shelf appeal. The material's infinite recyclability and zero chemical leaching properties resonate strongly with environmentally conscious consumers, particularly in South Africa where approximately 38% of consumers actively prioritize sustainable packaging choices. Manufacturers are leveraging glass packaging to differentiate their products and target premium market segments, contributing to the segment's robust growth trajectory.
Remaining Segments in Packaging Type
PET bottles represent a significant segment in the African energy drinks market, offering a balance between convenience and cost-effectiveness. This packaging format is particularly popular for larger volume products and is favored in retail channels where portability and resealability are key consumer requirements. The segment benefits from ongoing innovations in recycling technology and the introduction of bio-based PET materials, addressing environmental concerns while maintaining functional benefits. Manufacturers are increasingly investing in PET bottle recycling initiatives and exploring options like 100% recycled PET and bio-based alternatives to enhance sustainability credentials while maintaining the practical advantages of plastic packaging.
Segment Analysis: Distribution Channel
Off-trade Segment in African Energy Drinks Market
The off-trade segment maintains its dominant position in the African energy drinks market, commanding approximately 95% of the total market share in 2024. This substantial market presence is primarily driven by supermarkets and hypermarkets, which have emerged as the leading retail channels for energy drink sales. The segment's strong performance can be attributed to ongoing discounting strategies, particularly for sugar-free and low-calorie energy drinks. Off-trade retailers have successfully diversified their product offerings, presenting customers with a wide array of flavors and brands through established chains like Advance Cash n Carry, 7-Eleven, Checkers, and Cambridge. These retailers are actively prioritizing customer loyalty through various strategies such as in-store signage, posters, and digital displays, while maintaining efficient supply chains to ensure seamless availability of diverse energy drink offerings.
On-trade Segment in African Energy Drinks Market
The on-trade segment is demonstrating remarkable growth potential in the African energy drinks market, with projections indicating a robust growth trajectory of approximately 12% from 2024 to 2029. This impressive growth is largely driven by the increasing popularity of energy drinks in establishments like pubs, bars, and recreation centers, where these beverages are frequently used as mixers in both alcoholic and non-alcoholic cocktails. The segment's expansion is further supported by the rising trend of customizing ready-to-drink (RTD) energy beverages, allowing customers to personalize their drinks by selecting specific ingredients and packaging types. The growth is particularly notable in urban areas where establishments are innovating with energy drink-based offerings, including products like the "bomb serve" that incorporate energy drinks into cocktails, catering to the evolving preferences of young urban consumers seeking unique beverage experiences.
Africa Energy Drinks Market Geography Segment Analysis
Energy Drinks Market in South Africa
South Africa dominates the African energy drink market, commanding approximately 39% of the market value in 2024. The country's market leadership is driven by its robust retail infrastructure and evolving consumer preferences toward healthier beverage options. The presence of well-established supermarket chains and convenience stores has significantly enhanced the accessibility of energy drinks across urban and suburban areas. South African consumers are increasingly gravitating toward sugar-free and low-calorie variants, reflecting a growing health consciousness in the region. The market is further bolstered by the country's vibrant fitness culture, with approximately 21% of South Africans holding gym memberships. The on-trade channel, particularly through sports bars and clubs, has emerged as a significant distribution avenue, with top energy drinks gaining popularity both as standalone beverages and as mixers. The country's sophisticated cold chain infrastructure and efficient distribution networks have enabled manufacturers to maintain product quality and expand their reach across different regions.
Energy Drinks Market in Nigeria
Nigeria represents one of the most dynamic markets for energy drinks in Africa, projected to grow at approximately 14% annually from 2024 to 2029. The country's market is characterized by a vibrant youth demographic that increasingly embraces energy drinks in Nigeria as part of their lifestyle. The rising popularity of gaming culture, with 23% of Nigerians engaged in online gaming, has created a substantial consumer base for energy drinks. The market's growth is further propelled by the expanding fitness services landscape and increasing health consciousness among consumers. Nigerian retailers are actively diversifying their energy drink offerings, introducing new flavors and sugar-free variants to cater to evolving consumer preferences. The on-trade segment, particularly in cities like Lagos, Lekki, and Victoria Island, has emerged as a significant growth driver, with energy drinks becoming increasingly popular in the nightlife scene. The market also benefits from the country's robust distribution networks and the growing presence of modern retail formats.
Energy Drinks Market in Egypt
Egypt's energy drinks market demonstrates strong potential, driven by rapid urbanization and changing consumer lifestyles. The market benefits from the country's young, dynamic population that increasingly views energy drinks as lifestyle products rather than mere beverages. Egyptian consumers show a growing preference for energy drinks with natural ingredients and functional benefits, reflecting a broader trend toward healthier consumption patterns. The market's development is supported by the country's well-established retail infrastructure, particularly in major cities like Cairo and Alexandria. The on-trade channel has emerged as a significant distribution avenue, with energy drinks gaining popularity in cafes, restaurants, and entertainment venues. Local manufacturers are actively innovating with new flavors and formulations, while international brands maintain a strong presence through strategic partnerships with local distributors. The market also benefits from Egypt's position as a regional trade hub, facilitating efficient distribution and logistics.
Energy Drinks Market in Other Countries
The energy drinks market in other African countries, including Kenya, Ghana, Ethiopia, and Morocco, exhibits diverse growth patterns influenced by local consumer preferences and economic conditions. These markets are characterized by increasing urbanization and a growing young population that forms the primary consumer base for energy drinks. The retail landscape in these countries is evolving, with modern trade formats gradually gaining prominence alongside traditional retail channels. International brands are actively expanding their presence through strategic partnerships with local distributors, while domestic manufacturers are emerging with products tailored to local tastes and preferences. The market development in these countries is supported by improving distribution infrastructure and rising disposable incomes. Health and wellness trends are increasingly influencing consumer choices, leading to growing demand for natural and functional energy drinks. The on-trade channel, particularly in urban areas, plays a crucial role in market growth through bars, cafes, and entertainment venues.
Get Analysis on Important Geographic Markets
Download PDF
Africa Energy Drinks Industry Overview
Top Companies in Africa Energy Drinks Market
The African energy drinks market features a mix of global giants and regional players actively pursuing growth through various strategic initiatives. Companies are increasingly focusing on product innovation, particularly in developing sugar-free and natural variants to cater to health-conscious consumers. Operational agility is demonstrated through investments in sustainable packaging solutions, with many players transitioning to recyclable materials and implementing efficient supply chain practices. Strategic partnerships, especially with celebrities and sports organizations, have become a common approach to enhance brand visibility and market penetration. Geographic expansion remains a key focus, with companies establishing new manufacturing facilities and distribution networks across different African countries while simultaneously strengthening their presence in existing markets through enhanced retail partnerships and digital commerce capabilities.
Market Led By Global Brands, Local Innovation
The African energy drinks market exhibits a moderate level of consolidation, with global beverage conglomerates like Red Bull, Monster Beverage, and PepsiCo maintaining significant market positions through their established distribution networks and brand recognition. Red Bull's market share is particularly notable, as the company continues to leverage its extensive research and development capabilities to introduce innovative products while maintaining quality standards through advanced manufacturing processes. Regional players such as Tiger Brands and Mofaya Beverage Company have carved out their niches by offering products tailored to local tastes and preferences, often competing through competitive pricing strategies and strong local market understanding.
The market demonstrates dynamic competitive characteristics with a healthy mix of both global and local players actively pursuing growth opportunities. Merger and acquisition activities have been relatively modest, with companies primarily focusing on organic growth strategies and strategic partnerships rather than major consolidation moves. The competitive landscape is further shaped by the emergence of new local players who are introducing innovative products and leveraging their understanding of regional consumer preferences, while established companies continue to strengthen their positions through brand extensions and market penetration strategies. Red Bull's market share in South Africa is also a significant factor in the competitive dynamics, influencing strategic decisions across the industry.
Innovation and Local Adaptation Drive Success
Success in the African energy drinks market increasingly depends on companies' ability to balance product innovation with local market adaptation. Incumbent players must focus on developing health-conscious product variants while maintaining their core offerings, supported by robust distribution networks and strategic partnerships with local retailers. Companies need to invest in sustainable packaging solutions and digital marketing capabilities while building strong relationships with distributors and retailers to ensure consistent market presence. The ability to navigate regional regulatory requirements and maintain price competitiveness while ensuring product quality remains crucial for maintaining market share.
For contenders looking to gain ground, the focus should be on identifying and serving underserved market segments through innovative product offerings and competitive pricing strategies. Success factors include developing strong local manufacturing capabilities, establishing efficient distribution networks, and building brand awareness through targeted marketing campaigns. Companies must also consider potential regulatory changes regarding sugar content and caffeine levels, while addressing the growing consumer demand for healthier alternatives. The ability to maintain product differentiation while managing production costs and establishing strong relationships with local stakeholders will be crucial for long-term success in this competitive market. Notably, energy drink manufacturers in South Africa are increasingly focusing on these strategies to enhance their market presence.
Africa Energy Drinks Market Leaders
-
Monster Beverage Corporation
-
PepsiCo, Inc.
-
Red Bull GmbH
-
Suntory Holdings Limited
-
The Coca-Cola Company
- *Disclaimer: Major Players sorted in no particular order

Need More Details on Market Players and Competiters?
Download PDF
Africa Energy Drinks Market News
- October 2023: Miss South Africa Natasha Joubert has expanded her business venture by collaborating with the MoFaya energy drink business. Joubert has launched the Berry Queen-flavoured energy drink under the MoFaya energy drink brand.
- October 2023: Switch Energy Drink introduced 3 new flavors in the African region. The three new limited-edition flavors are Sour Worms, Naartjie & Grape, and Kiwi, Mango & Strawberry.
- September 2023: Switch Energy Drink launched a special limited-edition flavor in celebration of South African Heritage Day. As a brand deeply rooted in the South African spirit, Switch Energy Drink is excited to contribute to the festivities with this special edition.
Free With This Report
We provide a comprehensive and exhaustive set of data pointers for global, regional, and country-level metrics that illustrate the fundamentals of the soft drinks industry. With the help of 45+ free charts, clients can access in-depth market analysis based on price trend analysis of per capita spending on various soft drinks, through granular-level segmental information supported by a repository of market data, trends, and expert analysis. Data and analysis on soft drink category, packaging type, distribution channel insights into consumer preferences and purchasing patterns, an overview of key market players, etc., are available in the form of comprehensive reports as well as excel-based data worksheets.


Africa Energy Drinks Market Report - Table of Contents
1. EXECUTIVE SUMMARY & KEY FINDINGS
2. REPORT OFFERS
3. INTRODUCTION
- 3.1 Study Assumptions & Market Definition
- 3.2 Scope of the Study
- 3.3 Research Methodology
4. KEY INDUSTRY TRENDS
- 4.1 Consumer Buying Behaviour
- 4.2 Innovations
- 4.3 Brand Share Analysis
- 4.4 Regulatory Framework
5. MARKET SEGMENTATION (includes market size in Value in USD and Volume, Forecasts up to 2030 and analysis of growth prospects)
-
5.1 Soft Drink Type
- 5.1.1 Energy Shots
- 5.1.2 Natural/Organic Energy Drinks
- 5.1.3 Sugar-free or Low-calories Energy Drinks
- 5.1.4 Traditional Energy Drinks
- 5.1.5 Other Energy Drinks
-
5.2 Packaging Type
- 5.2.1 Glass Bottles
- 5.2.2 Metal Can
- 5.2.3 PET Bottles
-
5.3 Distribution Channel
- 5.3.1 Off-trade
- 5.3.1.1 Convenience Stores
- 5.3.1.2 Online Retail
- 5.3.1.3 Supermarket/Hypermarket
- 5.3.1.4 Others
- 5.3.2 On-trade
-
5.4 Country
- 5.4.1 Egypt
- 5.4.2 Nigeria
- 5.4.3 South Africa
- 5.4.4 Rest of Africa
6. COMPETITIVE LANDSCAPE
- 6.1 Key Strategic Moves
- 6.2 Market Share Analysis
- 6.3 Company Landscape
-
6.4 Company Profiles
- 6.4.1 Aje Group
- 6.4.2 Halewood International South Africa (Pty) Ltd
- 6.4.3 Mofaya Beverage Company (PTY) Ltd
- 6.4.4 Monster Beverage Corporation
- 6.4.5 Mutalo Group sp. z o.o
- 6.4.6 PepsiCo, Inc.
- 6.4.7 Red Bull GmbH
- 6.4.8 S. Spitz GmbH
- 6.4.9 Suntory Holdings Limited
- 6.4.10 The Alternative Power (Pty) Ltd
- 6.4.11 The Coca-Cola Company
- 6.4.12 Tiger Brands Ltd.
- *List Not Exhaustive
7. KEY STRATEGIC QUESTIONS FOR SOFT DRINK CEOS
8. APPENDIX
-
8.1 Global Overview
- 8.1.1 Overview
- 8.1.2 Porter’s Five Forces Framework
- 8.1.3 Market Dynamics (DROs)
- 8.2 Sources & References
- 8.3 List of Tables & Figures
- 8.4 Primary Insights
- 8.5 Data Pack
- 8.6 Glossary of Terms
You Can Purchase Parts Of This Report. Check Out Prices For Specific Sections
Get Price Break-up Now
List of Tables & Figures
- Figure 1:
- CONSUMER BUYING BEHAVIOUR
- Figure 2:
- INNOVATIONS
- Figure 3:
- BRAND SHARE ANALYSIS
- Figure 4:
- VOLUME OF ENERGY DRINKS MARKET, LITRES, AFRICA, 2018 - 2030
- Figure 5:
- VALUE OF ENERGY DRINKS MARKET, USD, AFRICA, 2018 - 2030
- Figure 6:
- VOLUME OF ENERGY DRINKS MARKET BY SOFT DRINK TYPE, LITRES, AFRICA, 2018 - 2030
- Figure 7:
- VALUE OF ENERGY DRINKS MARKET BY SOFT DRINK TYPE, USD, AFRICA, 2018 - 2030
- Figure 8:
- VALUE SHARE OF ENERGY DRINKS MARKET SPLIT BY SOFT DRINK TYPE, %, AFRICA, 2018 VS 2024 VS 2030
- Figure 9:
- VOLUME SHARE OF ENERGY DRINKS MARKET SPLIT BY SOFT DRINK TYPE, %, AFRICA, 2018 VS 2024 VS 2030
- Figure 10:
- VOLUME OF ENERGY SHOTS MARKET, LITRES, AFRICA, 2018 - 2030
- Figure 11:
- VALUE OF ENERGY SHOTS MARKET, USD, AFRICA, 2018 - 2030
- Figure 12:
- VALUE SHARE OF ENERGY SHOTS MARKET SPLIT BY PACKAGING TYPE, %, AFRICA, 2023 VS 2030
- Figure 13:
- VOLUME OF NATURAL/ORGANIC ENERGY DRINKS MARKET, LITRES, AFRICA, 2018 - 2030
- Figure 14:
- VALUE OF NATURAL/ORGANIC ENERGY DRINKS MARKET, USD, AFRICA, 2018 - 2030
- Figure 15:
- VALUE SHARE OF NATURAL/ORGANIC ENERGY DRINKS MARKET SPLIT BY PACKAGING TYPE, %, AFRICA, 2023 VS 2030
- Figure 16:
- VOLUME OF SUGAR-FREE OR LOW-CALORIES ENERGY DRINKS MARKET, LITRES, AFRICA, 2018 - 2030
- Figure 17:
- VALUE OF SUGAR-FREE OR LOW-CALORIES ENERGY DRINKS MARKET, USD, AFRICA, 2018 - 2030
- Figure 18:
- VALUE SHARE OF SUGAR-FREE OR LOW-CALORIES ENERGY DRINKS MARKET SPLIT BY PACKAGING TYPE, %, AFRICA, 2023 VS 2030
- Figure 19:
- VOLUME OF TRADITIONAL ENERGY DRINKS MARKET, LITRES, AFRICA, 2018 - 2030
- Figure 20:
- VALUE OF TRADITIONAL ENERGY DRINKS MARKET, USD, AFRICA, 2018 - 2030
- Figure 21:
- VALUE SHARE OF TRADITIONAL ENERGY DRINKS MARKET SPLIT BY PACKAGING TYPE, %, AFRICA, 2023 VS 2030
- Figure 22:
- VOLUME OF OTHER ENERGY DRINKS MARKET, LITRES, AFRICA, 2018 - 2030
- Figure 23:
- VALUE OF OTHER ENERGY DRINKS MARKET, USD, AFRICA, 2018 - 2030
- Figure 24:
- VALUE SHARE OF OTHER ENERGY DRINKS MARKET SPLIT BY PACKAGING TYPE, %, AFRICA, 2023 VS 2030
- Figure 25:
- VOLUME OF ENERGY DRINKS MARKET BY PACKAGING TYPE, LITRES, AFRICA, 2018 - 2030
- Figure 26:
- VALUE OF ENERGY DRINKS MARKET BY PACKAGING TYPE, USD, AFRICA, 2018 - 2030
- Figure 27:
- VALUE SHARE OF ENERGY DRINKS MARKET SPLIT BY PACKAGING TYPE, %, AFRICA, 2018 VS 2024 VS 2030
- Figure 28:
- VOLUME SHARE OF ENERGY DRINKS MARKET SPLIT BY PACKAGING TYPE, %, AFRICA, 2018 VS 2024 VS 2030
- Figure 29:
- VOLUME OF ENERGY DRINKS MARKET SOLD VIA GLASS BOTTLES, LITRES, AFRICA, 2018 - 2030
- Figure 30:
- VALUE OF ENERGY DRINKS MARKET SOLD VIA GLASS BOTTLES, USD, AFRICA, 2018 - 2030
- Figure 31:
- VALUE SHARE OF ENERGY DRINKS MARKET SOLD VIA GLASS BOTTLES, SPLIT BY SOFT DRINK TYPE %, AFRICA, 2023 VS 2030
- Figure 32:
- VOLUME OF ENERGY DRINKS MARKET SOLD VIA METAL CAN, LITRES, AFRICA, 2018 - 2030
- Figure 33:
- VALUE OF ENERGY DRINKS MARKET SOLD VIA METAL CAN, USD, AFRICA, 2018 - 2030
- Figure 34:
- VALUE SHARE OF ENERGY DRINKS MARKET SOLD VIA METAL CAN, SPLIT BY SOFT DRINK TYPE %, AFRICA, 2023 VS 2030
- Figure 35:
- VOLUME OF ENERGY DRINKS MARKET SOLD VIA PET BOTTLES, LITRES, AFRICA, 2018 - 2030
- Figure 36:
- VALUE OF ENERGY DRINKS MARKET SOLD VIA PET BOTTLES, USD, AFRICA, 2018 - 2030
- Figure 37:
- VALUE SHARE OF ENERGY DRINKS MARKET SOLD VIA PET BOTTLES, SPLIT BY SOFT DRINK TYPE %, AFRICA, 2023 VS 2030
- Figure 38:
- VOLUME OF ENERGY DRINKS MARKET BY DISTRIBUTION CHANNEL, LITRES, AFRICA, 2018 - 2030
- Figure 39:
- VALUE OF ENERGY DRINKS MARKET BY DISTRIBUTION CHANNEL, USD, AFRICA, 2018 - 2030
- Figure 40:
- VALUE SHARE OF ENERGY DRINKS MARKET SPLIT BY DISTRIBUTION CHANNEL, %, AFRICA, 2018 VS 2024 VS 2030
- Figure 41:
- VOLUME SHARE OF ENERGY DRINKS MARKET SPLIT BY DISTRIBUTION CHANNEL, %, AFRICA, 2018 VS 2024 VS 2030
- Figure 42:
- VOLUME OF ENERGY DRINKS MARKET SOLD VIA OFF-TRADE CHANNELS, LITRES, AFRICA, 2018 - 2030
- Figure 43:
- VALUE OF ENERGY DRINKS MARKET SOLD VIA OFF-TRADE CHANNELS, USD, AFRICA, 2018 - 2030
- Figure 44:
- VALUE SHARE OF ENERGY DRINKS MARKET SOLD VIA OFF-TRADE CHANNELS, %, AFRICA, 2018 VS 2024 VS 2030
- Figure 45:
- VOLUME SHARE OF ENERGY DRINKS MARKET SOLD VIA OFF-TRADE CHANNELS, %, AFRICA, 2018 VS 2024 VS 2030
- Figure 46:
- VOLUME OF ENERGY DRINKS MARKET SOLD VIA CONVENIENCE STORES, LITRES, AFRICA, 2018 - 2030
- Figure 47:
- VALUE OF ENERGY DRINKS MARKET SOLD VIA CONVENIENCE STORES, USD, AFRICA, 2018 - 2030
- Figure 48:
- VALUE SHARE OF ENERGY DRINKS MARKET SOLD VIA CONVENIENCE STORES SPLIT BY SOFT DRINK TYPE, %, AFRICA, 2023 VS 2030
- Figure 49:
- VOLUME OF ENERGY DRINKS MARKET SOLD VIA ONLINE RETAIL, LITRES, AFRICA, 2018 - 2030
- Figure 50:
- VALUE OF ENERGY DRINKS MARKET SOLD VIA ONLINE RETAIL, USD, AFRICA, 2018 - 2030
- Figure 51:
- VALUE SHARE OF ENERGY DRINKS MARKET SOLD VIA ONLINE RETAIL SPLIT BY SOFT DRINK TYPE, %, AFRICA, 2023 VS 2030
- Figure 52:
- VOLUME OF ENERGY DRINKS MARKET SOLD VIA SUPERMARKET/HYPERMARKET, LITRES, AFRICA, 2018 - 2030
- Figure 53:
- VALUE OF ENERGY DRINKS MARKET SOLD VIA SUPERMARKET/HYPERMARKET, USD, AFRICA, 2018 - 2030
- Figure 54:
- VALUE SHARE OF ENERGY DRINKS MARKET SOLD VIA SUPERMARKET/HYPERMARKET SPLIT BY SOFT DRINK TYPE, %, AFRICA, 2023 VS 2030
- Figure 55:
- VOLUME OF ENERGY DRINKS MARKET SOLD VIA OTHER DISTRIBUTION CHANNEL, LITRES, AFRICA, 2018 - 2030
- Figure 56:
- VALUE OF ENERGY DRINKS MARKET SOLD VIA OTHER DISTRIBUTION CHANNEL, USD, AFRICA, 2018 - 2030
- Figure 57:
- VALUE SHARE OF ENERGY DRINKS MARKET SOLD VIA OTHERS SPLIT BY SOFT DRINK TYPE, %, AFRICA, 2023 VS 2030
- Figure 58:
- VOLUME OF ENERGY DRINKS MARKET SOLD VIA ON-TRADE CHANNEL, LITRES, AFRICA, 2018 - 2030
- Figure 59:
- VALUE OF ENERGY DRINKS MARKET SOLD VIA ON-TRADE CHANNEL, USD, AFRICA, 2018 - 2030
- Figure 60:
- VALUE SHARE OF ENERGY DRINKS MARKET SOLD VIA ON-TRADE CHANNEL, SPLIT BY SOFT DRINK TYPE, %, AFRICA, 2023 VS 2030
- Figure 61:
- VOLUME OF ENERGY DRINKS MARKET BY COUNTRY, LITRES, AFRICA, 2018 - 2030
- Figure 62:
- VALUE OF ENERGY DRINKS MARKET BY COUNTRY, USD, AFRICA, 2018 - 2030
- Figure 63:
- VALUE SHARE OF ENERGY DRINKS MARKET SPLIT BY COUNTRY, %, AFRICA, 2018 VS 2024 VS 2030
- Figure 64:
- VOLUME SHARE OF ENERGY DRINKS MARKET SPLIT BY COUNTRY, %, AFRICA, 2018 VS 2024 VS 2030
- Figure 65:
- VOLUME OF ENERGY DRINKS MARKET, LITRES, EGYPT, 2018 - 2030
- Figure 66:
- VALUE OF ENERGY DRINKS MARKET, USD, EGYPT, 2018 - 2030
- Figure 67:
- VALUE SHARE OF ENERGY DRINKS MARKET SPLIT BY SUB DISTRIBUTION CHANNEL, %, EGYPT, 2023 VS 2030
- Figure 68:
- VOLUME OF ENERGY DRINKS MARKET, LITRES, NIGERIA, 2018 - 2030
- Figure 69:
- VALUE OF ENERGY DRINKS MARKET, USD, NIGERIA, 2018 - 2030
- Figure 70:
- VALUE SHARE OF ENERGY DRINKS MARKET SPLIT BY SUB DISTRIBUTION CHANNEL, %, NIGERIA, 2023 VS 2030
- Figure 71:
- VOLUME OF ENERGY DRINKS MARKET, LITRES, SOUTH AFRICA, 2018 - 2030
- Figure 72:
- VALUE OF ENERGY DRINKS MARKET, USD, SOUTH AFRICA, 2018 - 2030
- Figure 73:
- VALUE SHARE OF ENERGY DRINKS MARKET SPLIT BY SUB DISTRIBUTION CHANNEL, %, SOUTH AFRICA, 2023 VS 2030
- Figure 74:
- VOLUME OF ENERGY DRINKS MARKET, LITRES, REST OF AFRICA, 2018 - 2030
- Figure 75:
- VALUE OF ENERGY DRINKS MARKET, USD, REST OF AFRICA, 2018 - 2030
- Figure 76:
- VALUE SHARE OF ENERGY DRINKS MARKET SPLIT BY SUB DISTRIBUTION CHANNEL, %, REST OF AFRICA, 2023 VS 2030
- Figure 77:
- MOST ACTIVE COMPANIES BY NUMBER OF STRATEGIC MOVES, COUNT, AFRICA, 2020 - 2023
- Figure 78:
- MOST ADOPTED STRATEGIES, COUNT, AFRICA, 2020 - 2023
- Figure 79:
- VALUE SHARE OF MAJOR PLAYERS, %, AFRICA
Africa Energy Drinks Industry Segmentation
Energy Shots, Natural/Organic Energy Drinks, Sugar-free or Low-calories Energy Drinks, Traditional Energy Drinks are covered as segments by Soft Drink Type. Glass Bottles, Metal Can, PET Bottles are covered as segments by Packaging Type. Off-trade, On-trade are covered as segments by Distribution Channel. Egypt, Nigeria, South Africa are covered as segments by Country.| Soft Drink Type | Energy Shots | ||
| Natural/Organic Energy Drinks | |||
| Sugar-free or Low-calories Energy Drinks | |||
| Traditional Energy Drinks | |||
| Other Energy Drinks | |||
| Packaging Type | Glass Bottles | ||
| Metal Can | |||
| PET Bottles | |||
| Distribution Channel | Off-trade | Convenience Stores | |
| Online Retail | |||
| Supermarket/Hypermarket | |||
| Others | |||
| On-trade | |||
| Country | Egypt | ||
| Nigeria | |||
| South Africa | |||
| Rest of Africa | |||
Need A Different Region or Segment?
Customize Now
Market Definition
- Carbonated Soft Drinks (CSDs) - Carbonated soft drinks (CSDs) refer to non-alcoholic beverages that are carbonated and typically flavored, containing dissolved carbon dioxide to create effervescence. These beverages commonly include cola, lemon-lime, orange, and various fruit-flavored sodas. Marketed in cans, bottles, or fountain dispense.
- Juices - We have considered packaged juices which encompass non-alcoholic beverages derived from fruits, vegetables, or a combination thereof, processed and sealed in various packaging formats such as bottles, cartons, or pouches. Excluding fresh juices, this market segment involves commercially prepared and preserved juices, often with added preservatives and flavors.
- Ready-to-Drink (RTD) Tea and RTD Coffee - Ready-to-Drink (RTD) tea and RTD coffee are pre-packaged, non-alcoholic beverages that are brewed and prepared for consumption without further dilution. RTD tea typically includes various tea varieties, infused with flavors and sweeteners, and comes in bottles, cans, or cartons. Similarly, RTD coffee involves pre-brewed coffee formulations, often mixed with milk, sugar, or flavorings, and is conveniently packaged for on-the-go consumption.
- Energy Drinks - Energy drinks are non-alcoholic beverages formulated to provide a quick boost of energy and alertness. Whereas, sports drinks are beverages designed to hydrate and replenish electrolytes, particularly after physical exertion, exercise, or intense activity
| Keyword | Definition |
|---|---|
| Carbonated Soft Drinks | Carbonated soft drinks (CSDs) are a combination of carbonated water and flavouring, sweetened by sugar or a non-sugar sweeteners. |
| Standard Cola | Standard Cola is defined as the original flavor of cola soda. |
| Diet Cola | A cola-based soft drink containing no or low amounts of sugar |
| Fruit Flavored Carbonates | A carbonated beverage prepared from fruit juice/fruit flavor with carbonated water and containing sugar, dextrose, invert sugar or liquid glucose either singly or in combination. It may contain peel oil and fruit essences. |
| Juice | Juice is a drink made from the extraction or pressing of the natural liquid contained in fruit and vegetables. |
| 100% Juice | Fruit/vegetable juice made from fruit in the form of its juice with no water added to make up the volume. It is not permitted to add sugars, sweeteners, preservatives, flavourings or colourings to fruit juice. |
| Juice Drinks (up to 24% Juice) | Fruit/vegetable juice drinks with up to 24% fruits/vegetable extract. |
| Nectars (25-99% Juice) | Juices that can have between 25 and 99% of fruit, with the minimum legal limits defined depending on the type of fruit |
| Juice concentrates | Juice Concentrates are those form of juices when most of this liquid is removed resulting in a thick, syrupy product known as juice concentrate. |
| RTD Coffee | Packaged coffee beverages that are sold in a prepared form and are ready for consumption at the time of purchase. |
| Iced Coffee | An iced coffee is a cold version of coffee, usually a combination of hot espresso and milk with ice added to it. |
| Cold Brew Coffee | Cold brew also called cold water extraction or cold pressing is made by steeping ground coffee in room-temperature water for several hours. |
| RTD Tea | Ready-to-drink (RTD) tea is a packaged tea product ready for immediate consumption without brewing or preparation |
| Iced Tea | Ice tea or iced tea is a drink made from tea without milk but with sugar and sometimes fruit flavourings, drunk cold. |
| Green Tea | Green tea is a tea beverage which promotes mental alertness, relieving digestive symptoms and promoting weight loss. |
| Herbal Tea | Herbal tea beverages are made from the infusion or decoction of herbs, spices, or other plant material in hot water. |
| Energy Drink | A type of drink containing stimulant compounds, usually caffeine, which is marketed as providing mental and physical stimulation. They may or may not be carbonated and may also contain sugar, other sweeteners, or herbal extracts, among numerous possible ingredients. |
| Sugar-free or Low-calories Energy Drinks | Sugar-free or Low-calories Energy Drinks are sugar-free, artificially sweetened energy drinks with few or no calories. |
| Traditional Energy Drink | Traditional Energy Drinks are functional soft drinks containing ingredients designed to boost the consumer's energy. |
| Natural/Oraganic Energy Drinks | Natural/Organic energy drinks are energy drinks free of artificial sweeteners and synthetic colorings. Instead, they contain naturally derived ingredients such as green tea, yerba mate, and botanical extracts. |
| Energy Shots | A small but highly concentrated energy drink that contains large amounts of caffeine and/or other stimulants. The quantity is comparatively smaller compared to energy drinks. |
| Sports Drink | Sports drinks are beverages designed specifically for the rapid supply of fluid, carbohydrates, and electrolytes before, during or after exercise. |
| Isotonic | Isotonic drinks contain similar concentrations of salt and sugar as in the human body, and are designed to quickly replace fluids lost during exercise but with an increase of carbohydrate. |
| Hypertonic | Hypertonic drinks have a higher concentration of salt and sugar than the human body. They are best drunk after exercise as it is important to replace glycogen levels quickly after exercise. |
| Hypotonic | Hypotonic drinks are designed to quickly replace fluids lost during exercise. They have very low carbohydrate content and a lower concentration of salt and sugar than the human body. |
| Electrolyte-Enhanced Water | Electrolyte water is water infused with electrically-charged minerals, such as sodium, potassium, calcium, and magnesium. |
| Protein-based Sport Drinks | Protein-based sports drinks are those sports drinks which has added protein in it that will improve performance and reduce muscle protein breakdown. |
| On-Trade | The on-trade refers to places that sell beverages for immediate consumption on the premises like bars, restaurants, and pubs |
| Off-Trade | Off-trade usually means places like liquor stores, supermarkets and other places where you don't consume the beverage right away. |
| Convenience Store | A retail business that provides the public with a convenient location to quickly purchase a wide variety of consumable products and services, generally food and gasoline. |
| Specialty store | A specialty store is a shop/store that carries a deep assortment of brands, styles, or models within a relatively narrow category of goods |
| Online Retail | Online retail is a type of eCommerce whereby a business sells goods or services directly to consumers from a website. |
| Aseptic Packaging | Aseptic packaging refers to the filling of a cold, commercially sterile product under sterile conditions into a presterilized container and closure under sterile conditions to form a seal that effectively excludes microorganisms. These includes tetra packs, cartons, pouches etc. |
| PET Bottle | PET bottle means a bottle made of polyethylene terephthalate. |
| Metal Cans | Metal containers made of aluminum or tin- plated or zinc-plated steel, which are commonly used for packaging food, beverages or other products. |
| Disposable Cups | Disposable Cup means a cup or other container designed for single use to serve beverages, such as water, cold drinks, hot drinks and alcoholic beverages. |
| Gen Z | A way of referring to the group of people who were born in the late 1990s and early 2000s. |
| Millenial | Anyone born between 1981 and 1996 (ages 23 to 38 in 2019) is considered a Millennial |
| Taurine | Taurine is an amino acid that supports immune health and nervous system function. |
| Bars & Pubs | It is a drinking establishment licensed to serve alcoholic drinks for consumption on the premises. |
| Café | It is a foodservice establishment serving refreshments (mainly coffee) and light meals. |
| On the go | It means doing / dealing with while busily engaged with something and not diverting plans in order to accommodate. |
| Internet Penetration | The Internet Penetration Rate corresponds to the percentage of the total population of a given country or region that uses the Internet. |
| Vending Machine | A machine that dispenses small articles such as food, drinks, or cigarettes when a coin or token is inserted |
| Discount store | A discount store or discounter offers a retail format in which products are sold at prices that are in principle lower than an actual or supposed "full retail price". Discounters rely on bulk purchasing and efficient distribution to keep down costs. |
| Clean Label | Clean label on the beverage market are drinks that are made from few ingredients of natural origin and are not or only slightly processed. |
| Caffeine | An alkaloid compound which is a stimulant of the central nervous system. It is mainly used recreationally, as a mild cognitive enhancer to increase alertness and attentional performance. |
| Extreme sport | Action sports, adventure sports or extreme sports are activities perceived as involving a high degree of risk. |
| High-intensity interval training | It incorporates several rounds that alternate between several minutes of high intensity movements to significantly increase the heart rate to at least 80% of one's maximum heart rate, followed by short periods of lower intensity movements. |
| Shelf life | The length of time for which an item remains usable, fit for consumption, or saleable. |
| Cream Soda | Cream soda is a sweet soft drink. Generally flavored with vanilla and based on the taste of an ice cream float |
| Root Beer | Root beer is a sweet North American soft drink traditionally made using the root bark of the sassafras tree Sassafras albidum or the vine of Smilax ornata as the primary flavor. Root beer is typically, but not exclusively, non-alcoholic, caffeine-free, sweet, and carbonated. |
| Vanilla Soda | A carbonated soft drink flavoured with vanilla. |
| Dairy-Free | A product that does not contain any milk or milk products from cows, sheep or goats. |
| Caffeine-Free Energy Drinks | Caffeine-free energy drinks rely on other ingredients to boost the energy. Popular choices include amino acids, B vitamins, and electrolytes. |
Need More Details on Market Definition?
Ask a Question
Research Methodology
Mordor Intelligence follows a four-step methodology in all our reports.
- Step-1: IDENTIFY KEY VARIABLES: In order to build a robust forecasting methodology, the variables and factors identified in Step 1 are tested against available historical market numbers. Through an iterative process, the variables required for market forecast are set, and the model is built on the basis of these variables.
- Step-2: Build a Market Model: Market-size estimations for the forecast years are in nominal terms. Inflation is not a part of the pricing, and the average selling price (ASP) is kept constant throughout the forecast period for each country.
- Step-3: Validate and Finalize: In this important step, all market numbers, variables, and analyst calls are validated through an extensive network of primary research experts from the market studied. The respondents are selected across levels and functions to generate a holistic picture of the market studied.
- Step-4: Research Outputs: Syndicated reports, custom consulting assignments, databases & subscription platforms

Get More Details On Research Methodology
Download PDF


