
Market Overview
| Study Period | 2020 - 2031 |
|---|---|
| Forecast Data Period | 2026 - 2031 |
| Base Year Market Size (2025) | USD 99.41 Million |
| Market Size (2026) | USD 116.74 Million |
| Market Size (2031) | USD 260.69 Million |
| Growth Rate (2026 - 2031) | 17.45 % |
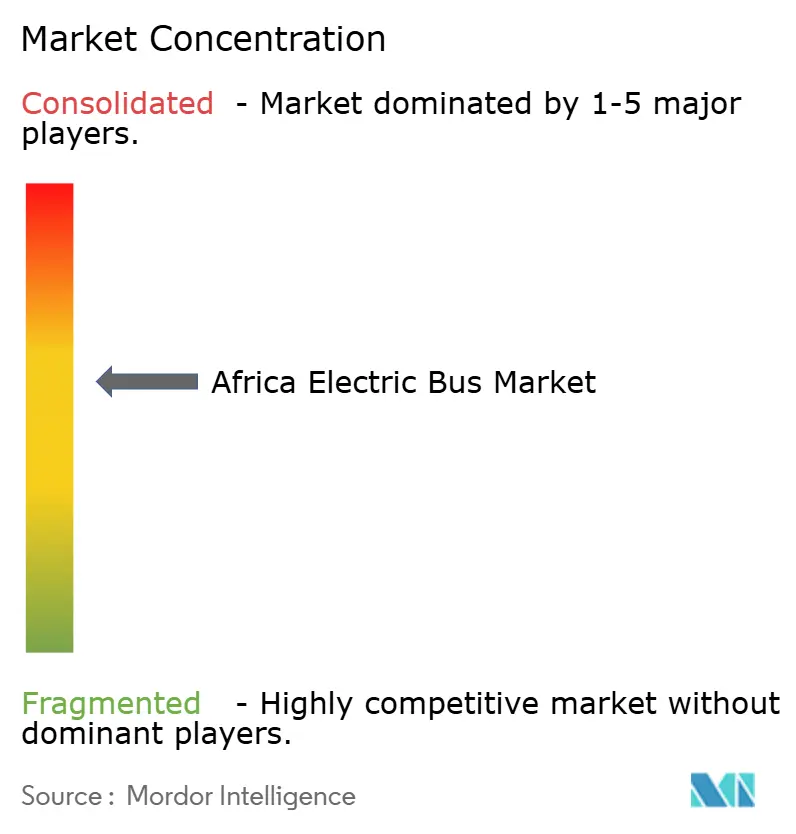
| Market Concentration | Medium |
Major Players *Disclaimer: Major Players sorted in no particular order Image © Mordor Intelligence. Reuse requires attribution under CC BY 4.0. | |
Africa Electric Bus Market Analysis by Mordor Intelligence
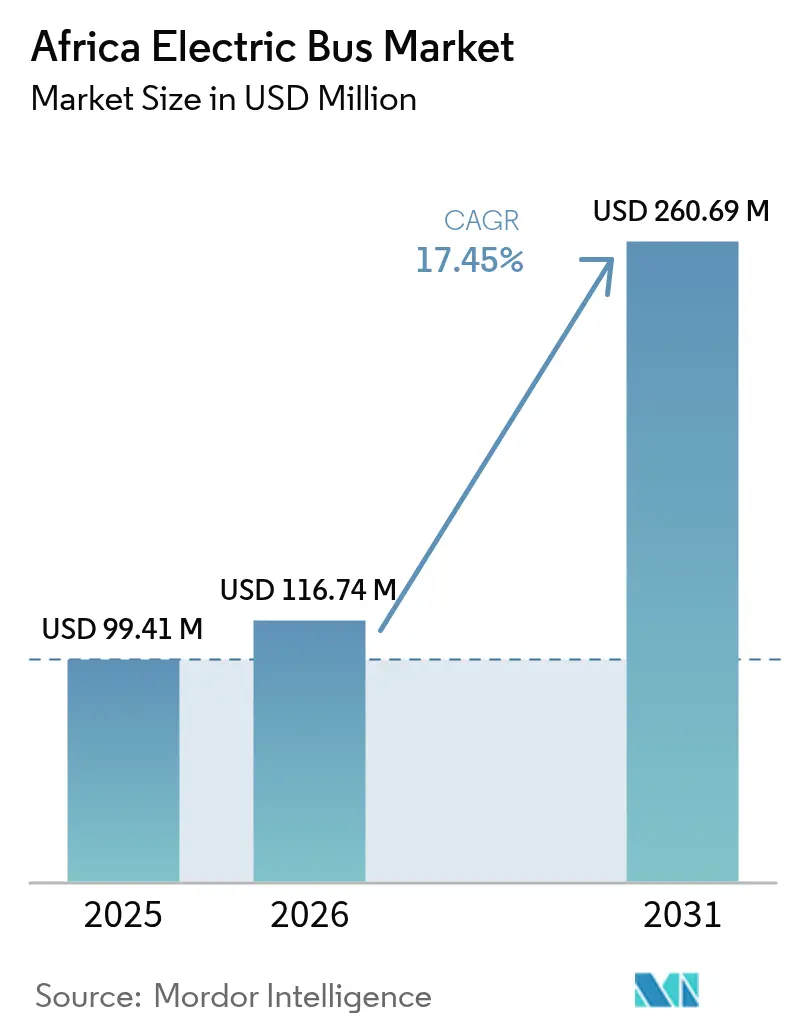
The Africa electric bus market size is expected to grow from USD 99.41 million in 2025 to USD 116.74 million in 2026 and is forecast to reach USD 260.69 million by 2031 at 17.45% CAGR over 2026-2031. Fleet operators are accelerating purchases as lithium-ion battery pack prices reduce, total cost of ownership (TCO) parity is expected by 2027, and carbon-credit revenues begin to close remaining funding gaps. Declining battery costs, government procurement targets, and localized Chinese OEM assembly plants are the three strongest growth catalysts. Solar-powered depot charging is mitigating grid-reliability risks across South Africa, Kenya, and Rwanda, while Article 6 carbon markets are improving project bankability for private operators. Competitive intensity remains moderate as BYD, Yutong, and King Long scale knock-down assembly, and local innovators such as Roam and IZI tailor chassis, suspension, and cooling systems to African road and climate conditions.
Key Report Takeaways
- By propulsion type, battery electric buses held 82.48% of the Africa electric bus market share in 2025, and will grow with the fastest CAGR of 20.98% by 2031.
- By consumer type, government procurement captured 61.55% of the Africa electric bus market size in 2025, while fleet operators are advancing at an 17.84% CAGR to 2031.
- By bus length, the standard (9–14 m) segment accounted for 56.32% share of the Africa electric bus market size in 2025, whereas mini buses (below 9 m) are expanding at a 19.18% CAGR through 2031.
- By charging mode, depot/overnight charging led with 68.62% of the Africa electric bus market share in 2025; opportunity/in-route charging is projected to register an 18.39% CAGR between 2026-2031.
- By battery capacity, 201-400 kWh led with 52.88% of the Africa electric bus market share in 2025; while buses with less than or equal to 200 kWh battery will expand at a 18.79% CAGR by 2031.
- By country, South Africa dominated with 41.98% revenue share in 2025; the Rest of Africa segment is forecast to grow at an 18.11% CAGR through 2031.
Note: Market size and forecast figures in this report are generated using Mordor Intelligence’s proprietary estimation framework, updated with the latest available data and insights as of 2026.
Africa Electric Bus Market Trends and Insights
Drivers Impact Analysis*
| Driver | (~) % Impact on CAGR Forecast | Geographic Relevance | Impact Timeline |
|---|---|---|---|
| Falling Battery Prices, TCO Parity | +4.2% | South Africa, Kenya | Medium term (2-4 years) |
| Government E-Bus Procurement Programs | +3.8% | Kenya, Nigeria, Rwanda, South Africa, Morocco | Short term (≤ 2 years) |
| Chinese OEM CKD Expansion | +3.1% | South Africa, Morocco, Egypt | Medium term (2-4 years) |
| Solar-Powered Depot Charging Microgrids | +2.4% | Rural and semi-urban Sub-Saharan Africa | Long term (≥ 4 years) |
| Urban Demand for Clean Transport | +2.2% | Lagos, Cairo, Johannesburg, Casablanca | Short term (≤ 2 years) |
| Carbon-Credit Monetization Under Article 6 | +1.8% | Ghana, Kenya, Rwanda | Long term (≥ 4 years) |
| Source: Mordor Intelligence | |||
Falling Battery Prices and TCO Parity By 2027
Global average Li-ion battery pack prices fell to USD 139/kWh in 2023 and further to ~USD 115/kWh in 2024 and are forecast to reduce further by 2026, pushing the Africa electric bus market toward operating-cost parity with diesel buses [1]. Roam’s Nairobi pilots show maintenance costs falling and fuel savings rising versus diesel fleets. Morocco’s Renault- and Stellantis-anchored supply chain positions the country to localize battery module assembly, while Egypt’s 1 GW Obelisk solar park with 200 MWh of storage signals continent-wide familiarity with stationary battery systems.
Government E-Bus Procurement Programs and Subsidies
Kenya’s 2024 Electric Mobility Draft Policy introduces green number plates, duty exemptions, and estimates that dormant renewable capacity could power 7,000 buses daily [2]. Nigeria’s October 2024 roadmap prefers Gross-Cost-Contract structures that shift capex risk to private consortia. Rwanda waived VAT on locally built buses, enabling IZI’s Impala E30 roll-out, while Ghana grants eight-year import-duty holidays for assembled EVs.
Rapid Expansion of Chinese OEM CKD Assembly Plants in Africa
BYD’s 120-unit Cape Town program is the anchor project for a potential knock-down plant serving all of SADC. Yutong is shipping 723 electric buses to Morocco in 2025 and is scouting CKD sites alongside Tractafric Motors [3]. Egypt’s MCV-Volvo complex offers a ready supply base for further Chinese localization moves. CKD kits cut landed cost 15-25% and accelerate technician up-skilling via on-site assembly training.
Emergence of Solar-Powered Depot Charging Using Off-Grid Microgrids
South Africa’s first off-grid bus depot combines 2.5 MWp of solar PV with 4 MWh of batteries, ensuring uninterrupted service during load-shedding. Kenya’s renewable grid allows smaller city depots to run entirely on behind-the-meter solar plus lithium storage. The World Bank is supporting hybrid solar-grid microgrids in Gambia and Senegal to enable similar schemes. Operators report significant electricity-cost reduction versus grid-only charging.
Restraints Impact Analysis*
| Restraint | (~) % Impact on CAGR Forecast | Geographic Relevance | Impact Timeline |
|---|---|---|---|
| Limited Grid Capacity | -2.8% | Nigeria, South Africa, Ghana | Short term (≤ 2 years) |
| High Upfront Cost and Constrained Budgets | -2.1% | All regions, acute in West and Central Africa | Medium term (2-4 years) |
| Lack of Battery-Recycling Infrastructure | -1.4% | Central and West Africa | Long term (≥ 4 years) |
| Scarcity of Skilled EV-Maintenance Workforce | -1.2% | Rural and secondary cities | Medium term (2-4 years) |
| Source: Mordor Intelligence | |||
Limited Grid Capacity and Unreliable Power Supply
Load-shedding in South Africa and frequent blackouts in Nigeria force operators to install backup diesel gensets or delay expansion, raising opex. The World Bank’s USD 1.6 billion West Africa Regional Electricity Market Program will add cross-border transmission by 2028, yet most depots still require islanded microgrids to guarantee service.
High Upfront Cost and Constrained Municipal Budgets Post-COVID
Electric buses cost 40-60% more than diesel units upfront, stretching city budgets already weakened by pandemic-era revenue losses. Abuja, Accra, and Dakar have all deferred BRT upgrades since 2023. Gross-Cost-Contract tenders and multilateral guarantees are helping, but procurement skills remain thin at municipal level.
*Our forecasts treat driver/restraint impacts as directional, not additive. The impact forecasts reflect baseline growth, mix effects, and variable interactions.
Segment Analysis
By Propulsion Type: Battery Electric Dominance Drives Market Evolution
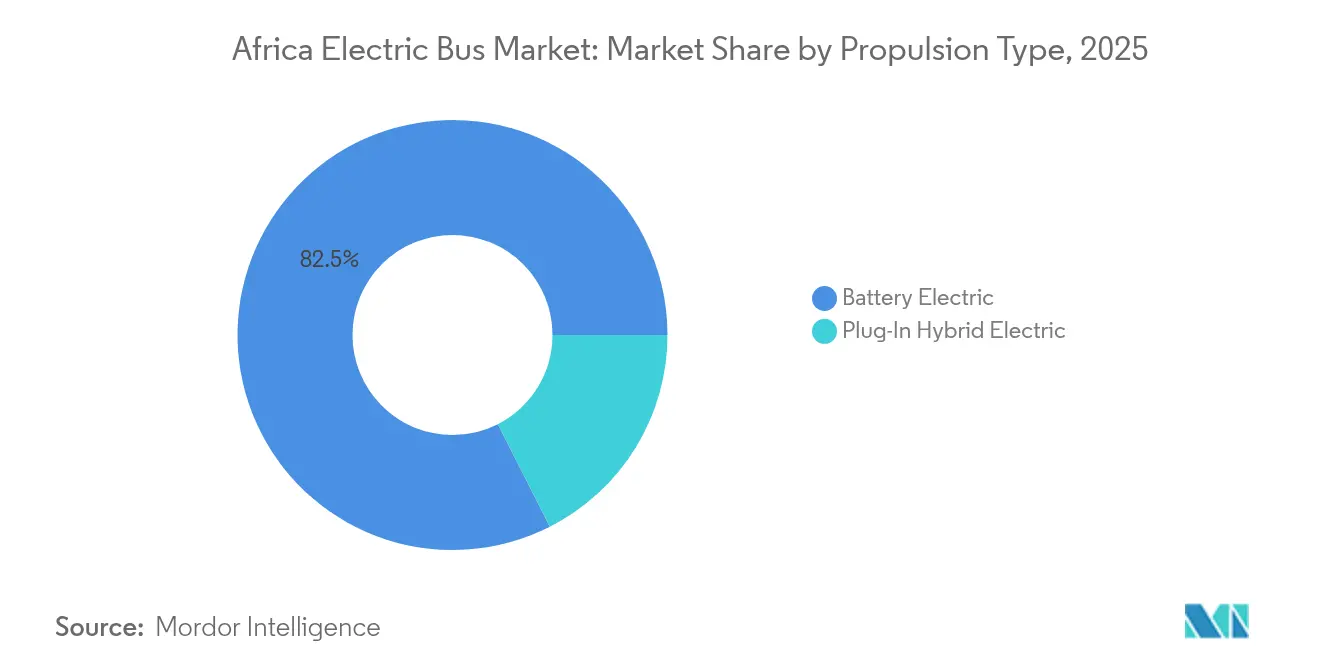
Battery electric buses held 82.48% market share in 2025, and the segment is forecast to grow at a 20.98% CAGR. This dominance is rooted in lower drivetrain complexity and the accelerating decline in lithium-ion pack prices. BYD’s Cape Town fleet has already cut operating costs significantly compared with equivalent diesel routes, underscoring the economic pull.
Plug-in hybrids account for the residual share, mainly in long-distance or grid-constrained corridors, yet their relevance is expected to wane as energy-density improves and solar-charged depots proliferate. Municipalities gravitate toward pure battery platforms to maximize air-quality gains and simplify maintenance. Policy support—such as Kenya’s excise duty exemptions—further tilts new tenders toward zero-emission fleets.

By Consumer Type: Government Leadership Enables Private-Sector Growth
Government agencies commanded 61.55% of 2025 demand as public procurement frameworks kickstarted network electrification. Abuja’s 100-unit pilot and Addis Ababa’s 4,800-bus import plan showcase scale benefits. Private fleet operators are quickly closing the gap; the segment is projected to grow 17.84% annually through 2031 as asset financiers bundle vehicles, chargers, and carbon-credit revenues into pay-per-kilometer contracts.
Early adopters such as Roam demonstrate that optimized duty cycles, dynamic pricing, and outsourcing of depot energy management can yield positive cash flow from year one. As a result, the Africa electric bus market share attributable to private operators is expected to climb significantly by 2030.
By Bus Length: Standard Buses Lead While Mini Segment Accelerates
Standard 9–14 m models delivered 56.32% of 2025 revenues, underpinning BRT trunk corridors in Cairo, Johannesburg, and Lagos. High passenger throughput and predictable depot returns keep this format central to government tenders. Yet mini buses (below 9 m) are growing fastest at 19.18% CAGR, favored for feeder services and narrow peri-urban roads where turning radius and axle weight limits are critical.
IZI’s Impala E30 and Roam’s 33-seat City Shuttle illustrate how localized chassis and composite bodies can slash curb weight, enabling less than/equal to 200 kWh battery packs without sacrificing range. Consequently, the Africa electric bus market size for mini buses could grow between 2026 and 2031 as ride-sharing cooperatives electrify informal routes.
By Charging Mode: Depot Charging Dominance with Opportunity Upside
Depot-based overnight charging covered 68.62% of delivered units in 2025 thanks to simpler infrastructure and the ability to tap surplus off-peak generation. Solar-plus-battery systems in Cape Town and Nairobi have driven energy costs down 30-40%. Opportunity charging, while still niche, will scale at an 18.39% CAGR as pantograph-equipped stops in Casablanca and Dakar extend daily range and cut battery-size requirements.
Grid reinforcements under the West Africa Power Pool, paired with Section 14 feed-in-tariff reforms, allow operators to monetize midday solar overproduction by feeding back excess, further enhancing the Africa electric bus market economics.

By Battery Capacity: Mid-Range Packs Balance Performance and Cost
The 201-400 kWh class held 52.88% share in 2025, delivering 200-250 km real-world range and optimal TCO for urban duty cycles. Less than/Equals to 200 kWh packs will expand at 18.79% CAGR as energy-density climbs above 330 Wh/kg and route-based charging gains traction.
Above-400 kWh batteries remain tailored to intercity services such as Johannesburg-Pretoria shuttles but face diminishing cost advantage as opportunity charging networks densify. With pack prices falling by 2026, the Africa electric bus market size for less than/equals to 200 kWh pack configurations is expected to eclipse by 2030.
Geography Analysis
South Africa’s 41.98% share in 2025 reflects early mover advantage: Golden Arrow’s 120-bus BYD fleet, Autel’s 240 kW fast chargers, and the nation’s first solar-microgrid depot keep Cape Town services running during Stage-5 load shedding. Morocco’s share is anchored by its Tangier and Kenitra auto zones producing 60% of Renault and Stellantis African output. Yutong’s 723-bus export contract, combined with ONCF’s e-bus pilot in Rabat, positions the kingdom for significant annual growth.
Egypt blends large-scale demand with manufacturing potential. MCV already builds Volvo-branded city buses, and government subsidies covering local EV production costs shorten payback periods. The 1 GW Obelisk solar park guarantees low-carbon electricity, critical for opportunity charging economics.
Rest-of-Africa demand is burgeoning and is projected to underpin an 18.11% CAGR by 2031. Nigeria finalizes its Gross-Cost-Contract template, Ghana’s eight-year duty waiver is live, and Ethiopia received 100 Golden Dragon units in 2025, inaugurating East Africa’s largest e-bus operation. Cross-border power-pooling and standardized CKD incentives under AfCFTA are expected to knit these pockets of demand into a cohesive continental growth engine.
Regulatory Landscape
Africa electric bus deployment is increasingly shaped by national electric mobility policies, fiscal incentives, and emerging technical rules for charging infrastructure. Kenya rolled out its National Electric Mobility Policy in February 2026, building on earlier duty and tax incentives for e-mobility and introducing clearer frameworks for public transport electrification. Rwanda strengthened operational requirements for EV charging and battery swapping when the Rwanda Utilities Regulatory Authority (RURA) issued Regulation N 011/ENERGY/RURA/2026 in June 2026, moving beyond pilots toward formal compliance on safety, licensing, and technical standards.
At the continental level, policy coordination progressed in April 2026 when African Union transport and energy ministers endorsed a Continental Framework on Electric Mobility, aimed at greater alignment on charging interoperability and cross-border standards. Standardization bodies and national regulators also support compliance for vehicle and infrastructure approvals, including ARSO (via ARS 1595-2021 vehicle homologation requirements aligned with UN ECE regulations) and the Ghana Energy Commission electro-technical standards for EV charging systems based on IEC benchmarks. Together, these measures shape procurement specifications, import eligibility criteria, and the design choices for depot and opportunity charging in South Africa, Kenya, and Rwanda.
Value Chain Analysis
The Africa electric bus value chain is dominated by imported platforms and components alongside growing local assembly and body integration. Upstream, batteries, e-axles, power electronics, and high-voltage auxiliaries are largely sourced from global suppliers, often through Chinese OEM supply chains. Midstream activity increasingly centers on CKD/SKD assembly, localization of bodies and thermal systems, and depot-energy integration tailored to African operating conditions. OEMs and local integrators including BYD, Yutong, King Long, Roam, IZI, BasiGo (in partnership with Kenya Vehicle Manufacturers), and Belayneh Kindie Group in Ethiopia connect vehicle supply with chargers, spares, and training to reduce downtime and accelerate technician upskilling.
Downstream, government agencies and large fleet operators anchor demand through tenders and corridor programs, while project developers, financiers, and energy partners close the infrastructure and funding loop. Charging hardware and EPC services, including high-power depot chargers and solar-plus-storage microgrids, form a parallel value chain that influences route planning and bus specifications. Recent deals show cross-border industrialization and service-network buildout, including Golden Arrow Bus Services signing a USD 150 million contract with Uganda-based Kiira Motors for 450 electric buses manufactured in Uganda. Operator-led and bank-backed charging initiatives such as the KCB Bank, ePureMotion, and the Matatu Owners Association PSV charging station in Nairobi also indicate that distribution and aftersales are increasingly driven by multi-stakeholder arrangements rather than standalone vehicle sales.
Competitive Landscape
Chinese OEMs dominate volume but face rising competition from localized African ventures. BYD, Yutong, King Long, and Golden Dragon collectively supplied a notable share of 2024 deliveries, leveraging cost-efficient supply chains and integrated drivetrain platforms. BYD’s Autel-backed charging hub in Cape Town evidences its solution-provider strategy.
Local startups are differentiating via market-specific engineering. Roam’s Nairobi factory welds lighter bus frames using locally sourced steel and integrates battery packs optimized for high-ambient temperatures. Rwanda’s IZI employs modular composite bodies to reduce weight and simplify repairs.
Strategic partnerships define the competitive narrative: BYD-Golden Arrow, Yutong-Tractafric Motors, Golden Dragon-Belayneh Kinde Group, and Autel-City of Cape Town exemplify turnkey ecosystems bundling vehicles, chargers, maintenance, and financing. Carbon-credit origination is an emerging moat. Operators able to verify emission reductions under Article 6 can offer 5-10 cents/km lower effective pricing, giving them an edge in competitive tenders.
Africa Electric Bus Industry Leaders
-
BYD Auto Co., Ltd.
-
Zhengzhou Yutong Bus Co., Ltd.
-
King Long United Automotive Industry Co., Ltd
-
Zhongtong Bus Holding Co., Ltd
-
Kiira Motors Corporation
- *Disclaimer: Major Players sorted in no particular order
Market Opportunities and Future Outlook
A primary opportunity is expanding charging from closed depots into public, corridor-ready networks that support intercity and higher-utilization operations. In July 2026, BasiGo and Rubis Energy Kenya launched a public DC fast-charging site at the Rubis Sabaki station, with additional locations cited in Meru, Nanyuki, and Nyeri. The rollout creates visible whitespace for standardized, interoperable charging services that can be contracted by multiple operators and aligns with a broader shift toward bundled solutions where vehicle supply, energy delivery, and fleet management are offered in pay-per-kilometer or service-backed models.
Manufacturing and assembly localization also offers high-impact upside as governments and operators look for lower landed costs and more reliable aftersales. Uganda is emerging as a regional supply node, with Kiira Motors reporting three international certifications for its Jinja facility in May 2026 and linking it to large supply commitments into Southern Africa. Kenya is also strengthening assembly pathways through partnerships such as BasiGo with Kenya Vehicle Manufacturers. In West Africa, localization is becoming more specific, including Coscharis Motors and Asia Star deepening their partnership in April 2026 toward FKD assembly at the Awoyaya plant in Nigeria, which supports parts distribution, technician training, and locally anchored service networks.
Recent Industry Developments
- July 2026: BasiGo and Rubis Energy Kenya launched a public DC fast-charging network starting at the Rubis Sabaki station, with additional sites identified in Meru, Nanyuki, and Nyeri. The move extends charging beyond depot-only models and supports higher daily utilization for buses and other commercial EVs. It also strengthens infrastructure availability on key routes, reducing operational constraints tied to limited grid capacity and depot access.
- January 2026: Yutong completed deployment of 723 buses in Morocco, supporting AFCON 2025 mobility from December 2025 to January 2026 and then transitioning into ongoing urban public transport service. The scale of deployment reinforces OEM capability to execute large batches with coordinated service support. It also deepens Morocco's position as a major receiving market for electrified and modernized bus fleets tied to public transport programs.
- July 2024: BYD signed a purchase agreement with Golden Arrow Bus Services for 120 electric buses in Cape Town, marking a landmark step toward South Africa's first electric bus fleet. The agreement followed multi-year testing and set the basis for broader fleet electrification packages that include charging and operational support. It also became a reference project for other African cities evaluating large-scale procurement and depot charging investments.
Research Methodology Framework and Report Scope
Market Definition and Coverage
For this study, the market covers revenue generated from electric buses supplied and used across African countries, with buses counted only when they have a fully electric drivetrain and are intended for public or fleet operations.
Scope exclusions: We exclude electric minibuses and vans, passenger cars, charging infrastructure and depot equipment, and parts-only sales that are not tied to a complete electric bus.
Segmentation Overview
- By Propulsion Type
- Battery Electric
- Plug-In Hybrid Electric
- By Consumer Type
- Government
- Fleet Operators
- By Bus Length
- Mini (Below 9 m)
- Standard (9-14 m)
- Articulated (Above 14 m)
- By Charging Mode
- Depot / Overnight Charging
- Opportunity / In-Route Charging
- By Battery Capacity
- ≤200 kWh
- 201-400 kWh
- Above 400 kWh
- By Country
- South Africa
- Morocco
- Egypt
- Rest of Africa
Data Sources, Market Sizing, and Validation
Desk Research
To set the starting point, we built a fact base around bus procurement cycles, where deployments are happening, and how transit fleets are being funded. Public sources helped anchor country-level activity and adoption signals, including government transport and energy publications, customs and trade statistics for vehicle imports, development bank releases on mass transit projects, and national statistics offices for macro indicators.
We also reviewed policy and standards signals that affect vehicle eligibility and public tenders, using sources such as UNEP and other UN transport and climate material, International Energy Agency electrification commentary, and peer reviewed papers on battery cost and total cost of ownership. Company annual reports, investor decks, and reputable press were used to confirm announced orders, assembly plans, and delivery timing. Where needed, we referenced paid subscriptions for company financials and intelligence, news and financials, patent databases, and shipment-level import or export databases to cross-check claims. These examples are not exhaustive, and we used additional public and paid sources for data collection, validation, and clarification.
Primary Interviews and Surveys
Primary work focused on validating what is actually being bought and deployed, not just what is announced. We spoke with transit authorities and fleet operators, bus assemblers and key component suppliers, and project financiers and engineering consultants across Africa so gaps in delivery schedules, price points, and operating assumptions could be closed.
Because procurement is uneven across the continent, we balanced coverage across larger transit markets and emerging pilots, and then rechecked outliers with follow-up questions until we reached a consistent view of volumes and pricing.
Distribution of primary research fieldwork respondents
| Company type | Respondent position |
|---|---|
| Top tier: 39% | CXOs: 16% |
| Mid tier: 43% | Functional/Unit leaders: 34% |
| Smaller Players: 18% | Managers: 50% |
Market-Sizing & Forecasting
Sizing started from a top-down build that reconstructs annual electric bus demand from public procurement cycles, import and delivery signals, and country-level deployment pipelines, and then translates demand into revenue using observed price bands. We corroborated results with selective bottom-up approximations, including sampled unit prices by bus length and battery capacity, and a reasonableness roll-up from known supplier and assembler activity where data was available.
Key inputs in the model included announced and awarded tender volumes, delivery lead times, the share of battery electric versus plug-in hybrid units, typical bus length mix in city fleets, battery capacity ranges linked to route duty cycles, and the spread between imported fully built buses and locally assembled units. When a bottom-up point was missing, such as undisclosed contract pricing, we used interview-led price ranges and applied conservative mid-points, then checked against budgeted capex disclosures and comparable recent awards.
For forecasting, we used scenario analysis because deployments can change quickly with financing approvals and grid or depot readiness. Scenarios were guided by expert views on battery price direction, charging readiness at depots, availability of concessional funding, and the pace of policy enforcement in major transit cities, then blended into a central case for the final forecast.
Data Validation & Update Cycle
Outputs were checked against independent signals, including tender calendars, shipment timing, and public fleet conversion targets, and then differences were investigated before figures were finalized. When variances were large, we revisited assumptions like unit pricing, delivery timing, and the counted fleet boundary, and we made follow-up calls when the explanation was not clear.
Reports are refreshed annually, with interim updates when material events occur, such as a large multi-city award, a major financing close, or a policy change that shifts procurement eligibility. Before delivery, an analyst runs a fresh pass on key variables and currency conversions so clients receive the latest updated view.
Mordor Intelligence's Africa Electric Bus Market Sizing Compared With Other Published Estimates
Published market sizes for Africa electric buses often appear far apart because the counted boundary is not consistent, and the pricing logic is rarely stated clearly. The spread can also come from the year used for currency conversion, the speed at which average selling prices are adjusted as batteries get cheaper, and whether announced projects are treated the same as delivered units.
In our checks, the biggest gap drivers were whether adjacent geographies were bundled in, whether trolley and charging systems were included as revenue, and whether the estimate was built from unit deployments versus broader mobility spend. By refreshing currency timing and price bands during the annual update and revalidating tender and delivery signals close to release, the model stays tied to what is being procured and delivered, which is the practice applied in Mordor Intelligence.
Benchmark comparison
| Source | Market Size | Gaps in Research Methodology |
|---|---|---|
| Mordor Intelligence | USD 99.41 M (2025) | |
| Trade Journal A | USD 1.60 B (2024) | This figure appears to reflect a broader revenue pool, where announced pipeline and wider electrified bus programs can be counted, and pricing is not clearly tied to delivered units in specific African markets. |
| Regional Consultancy A | USD 4.40 B (2025) | The scope includes Middle East plus Africa and may also capture trolley buses and a wider set of applications, which lifts totals versus an Africa-only electric bus revenue view with tighter inclusion rules. |
The table shows that scope and timing choices explain most of the spread. When geography is widened to include the Middle East, or when pipeline and adjacent electric bus types are counted with limited validation, the market total rises quickly. Our approach keeps the estimate traceable to procurement, delivery, and realistic price bands, which makes the steps repeatable when assumptions are revisited.
Key Questions Answered in the Report
How fast will electric bus revenues grow across Africa?
Revenues are forecast to climb from USD 99.41 million in 2025 to USD 116.74 million in 2026 and USD 260.69 million by 2031, reflecting a 17.45% CAGR over 2026-2031.
Which countries are leading adoption?
South Africa holds 41.98% of 2025 sales, followed by Morocco and Egypt, while Kenya, Rwanda, and Ethiopia are scaling fastest.
What battery size is most common?
Packs rated 201–400 kWh account for 52.88% of units because they balance range and upfront cost for typical city routes.
Why are mini electric buses gaining popularity?
Mini buses below 9 m are expanding at a 19.18% CAGR due to their suitability for feeder routes and their lower infrastructure demands.