
Market Overview
| Study Period | 2020 - 2031 |
|---|---|
| Forecast Data Period | 2026 - 2031 |
| Base Year Market Size (2025) | USD 9.81 Billion |
| Market Size (2026) | USD 10.2 Billion |
| Market Size (2031) | USD 12.38 Billion |
| Growth Rate (2026 - 2031) | 3.95 % |
| Market Concentration | Low |
Major Players *Disclaimer: Major Players sorted in no particular order Image © Mordor Intelligence. Reuse requires attribution under CC BY 4.0. | |
Africa Cross Border Road Freight Transport Market Analysis by Mordor Intelligence
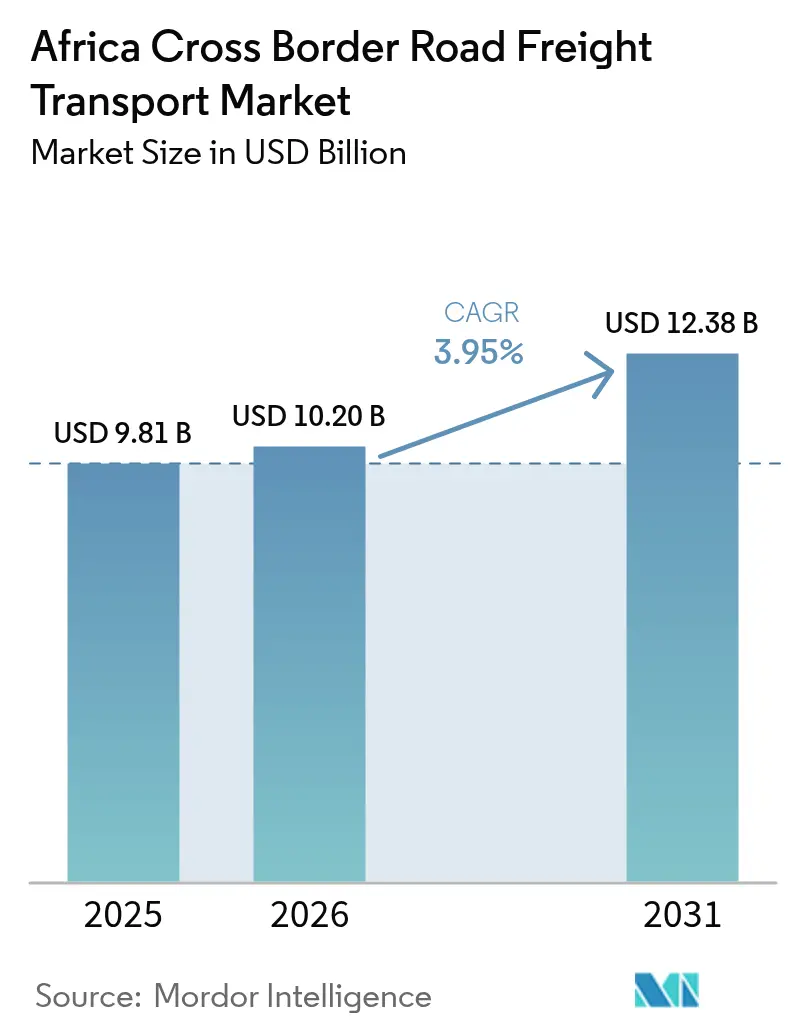
The Africa Cross Border Road Freight Transport market size is expected to grow from USD 9.81 billion in 2025 to USD 10.2 billion in 2026 and is forecast to reach USD 12.38 billion by 2031 at 3.95% CAGR over 2026-2031.
Rising intra-African trade under the African Continental Free Trade Area (AfCFTA), rapid e-commerce adoption, and corridor-focused infrastructure investment jointly underpin this expansion. Full-scale tariff phase-downs are already rerouting freight flows toward integrated corridors such as the USD 3 billion Lobito project that links Angola’s Atlantic port to Zambia and the Democratic Republic of Congo (DRC) mineral hubs. Digital trade facilitation gains Kenya’s National Single Window processes 80% of customs payments electronically shrink border dwell times and lower compliance costs. Accelerating integration deepens demand for end-to-end visibility, prompting logistics providers to embed electronic tracking and blockchain documentation in their service mix. Simultaneously, consolidation among global integrators and specialized regional operators upgrades network breadth, service reliability, and compliance capability across the continent.
Key Report Takeaways
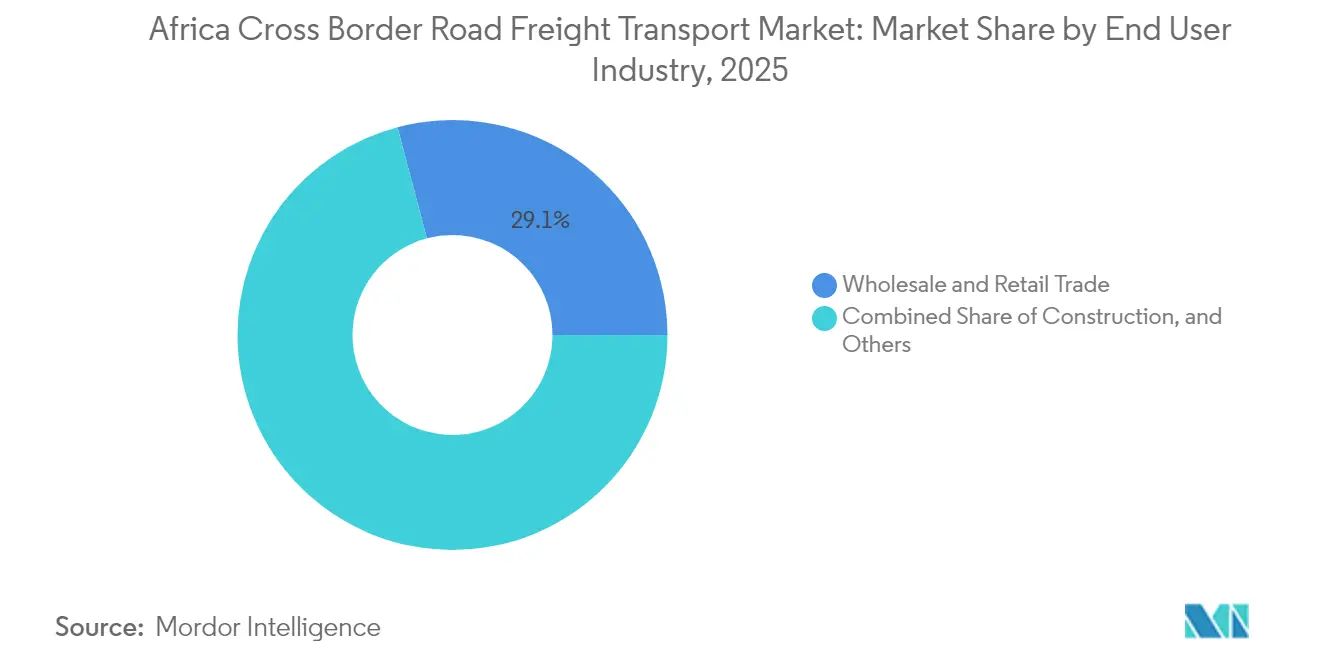
- Wholesale and Retail Trade led with 29.12% revenue share of the Africa Cross-Border Road Freight Transport market in 2025 and is projected to expand at a 4.62% CAGR through 2031.
- Full-Truck-Load captured 52.78% of the Africa Cross-Border Road Freight Transport market share in 2025, while Less-than-Truck-Load records the highest projected 4.05% CAGR to 2031.
- Non-Containerized cargo commanded 56.48% share of the Africa Cross-Border Road Freight Transport market size in 2025; Containerized transport is advancing at a 4.21% CAGR through 2031.
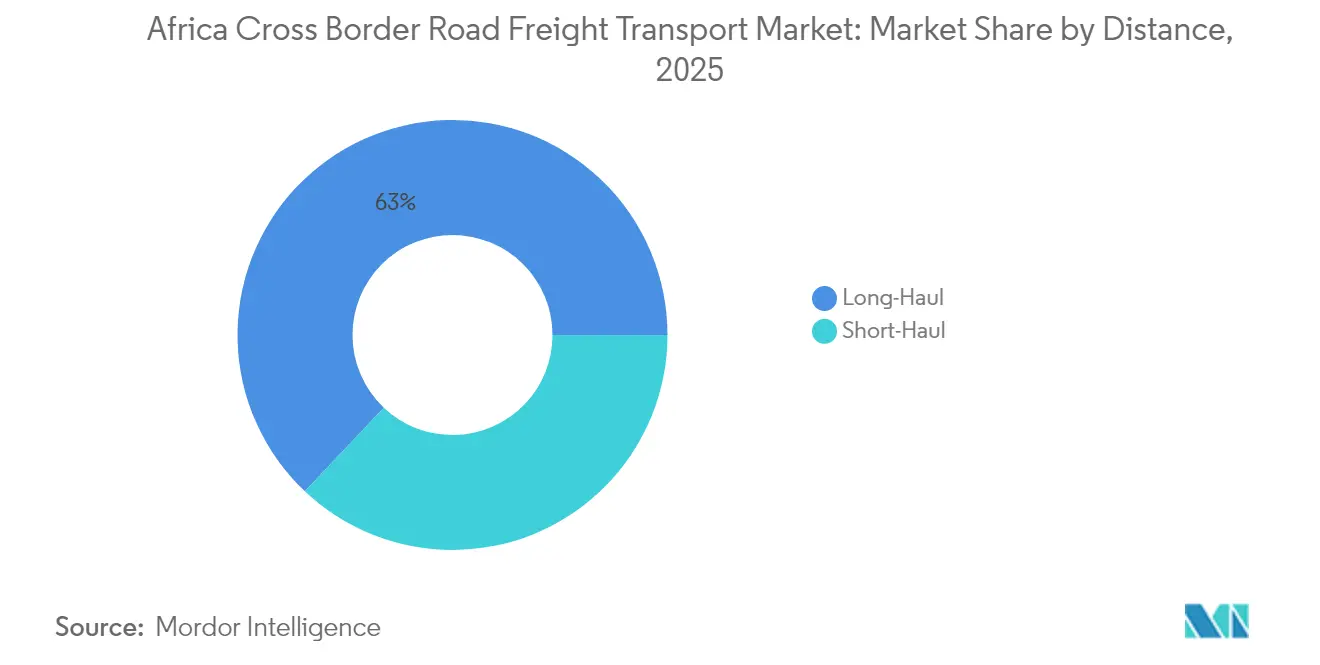
- Long-Haul movements accounted for 62.95% of the Africa Cross-Border Road Freight Transport market size in 2025 and are forecast to rise at a 4.31% CAGR through 2031.
- Solid Goods dominated with 80.62% share of the Africa Cross-Border Road Freight Transport market size in 2025, growing at a 4.15% CAGR to 2031.
- Non-Temperature-Controlled freight held 87.12% share of the Africa Cross-Border Road Freight Transport market in 2025, while Temperature-Controlled services post the fastest 4.08% CAGR through 2031.
Note: Market size and forecast figures in this report are generated using Mordor Intelligence’s proprietary estimation framework, updated with the latest available data and insights as of 2026.
Market Trends and Insights
Drivers Impact Analysis of Africa Cross Border Road Freight Transport Market*
| Driver | ( ~ ) % Impact on CAGR Forecast | Geographic Relevance | Impact Timeline |
|---|---|---|---|
| AfCFTA tariff phase-down | +0.8% | ECOWAS, EAC, SADC | Medium term (2-4 years) |
| E-commerce last-mile demand | +0.6% | Major urban corridors | Short term (≤ 2 years) |
| Regional value chains in automotive & FMCG | +0.5% | Morocco-West Africa; South Africa-SADC; Ethiopia-EAC | Long term (≥ 4 years) |
| Multilateral corridor programs | +0.4% | Lobito, Northern & Abidjan-Lagos corridors | Long term (≥ 4 years) |
| Digital freight-matching platforms | +0.3% | Nigeria, Kenya, South Africa | Short term (≤ 2 years) |
| Mining-led critical-minerals corridors | +0.4% | DRC-Zambia, West Africa, Southern Africa | Medium term (2-4 years) |
| Source: Mordor Intelligence | |||
AfCFTA Tariff Phase-Down Accelerates Intra-African Over-the-Road Trade
Tariff liberalization across 54 signatory states is lowering landed costs and stimulating corridor traffic. UNCTAD’s 2024 benchmarking shows countries that pair tariff cuts with digital single-window systems record 22% higher trade growth than those applying tariff relief alone. East African Community (EAC) members with harmonized axle-load limits capture outsized benefits, while Nigeria’s SIGMAT rollout positions West Africa’s largest economy for similar gains. Rules-of-origin compliance drives up demand for consolidation hubs, catalyzing investment in documentation-ready warehouses near border posts. The final tariff dismantling round scheduled for 2027 sustains freight demand, embedding a positive trajectory for the Africa Cross-Border Road Freight Transport market[1].
E-commerce Fulfilment Demand for Fast Cross-Border Last-Mile
Online retail is forecast to reach USD 56 billion by 2029, and platforms require truck operators capable of clearing multiple customs jurisdictions without sacrificing delivery speed. Amazon’s 2024 South Africa entry exemplifies how global brands re-shape freight expectations toward two- to three-day cross-border delivery windows. Start-ups such as CloudFret secured fresh capital to digitize load matching and paperwork, evidence of investor appetite for technology that improves reliability. National payment switches like Somalia’s 2024 launch reduce cash-on-delivery dependencies and shrink reversal risk. Cold chain capability gains prominence as pharmaceutical and grocery e-commerce expand, with Quick International Courier investing in temperature-controlled assets to meet stringent handling requirements[2].
Emerging Regional Value Chains in Automotive & FMCG Manufacturing
Automakers and fast-moving consumer goods firms reorder their sourcing footprints to exploit AfCFTA preferences. Morocco exported USD 13.8 billion in vehicles and components in 2024, then started regional assembly lines to serve West African demand, trimming logistics costs by an estimated 20%. Zambia-DRC’s battery minerals economic zone boosts bilateral freight flows of cathode materials and processed copper. Manufacturers require synchronized pick-ups and component sequencing, prompting freight operators to install track-and-trace systems that guarantee just-in-time delivery. As continental supply networks mature, logistics providers that offer bonded warehousing and customs brokerage gain a competitive edge in the Africa Cross-Border Road Freight Transport market.
Multilateral Corridor Programs Unlock Infrastructure Finance
Development finance institutions now favor integrated corridor portfolios—physical, digital, and regulatory—instead of single projects. The Lobito Corridor secured USD 3 billion in multi-lender commitments, cutting DRC copper transit times toward the Atlantic by an expected 10–12 days. Similar bundles on the Northern Corridor produced a 40% transit time drop since 2020. Private actors respond: DP World pledged USD 3 billion for African ports and inland depots, anchoring intermodal adoption. Embedded digital cargo tracking within these programs further magnifies efficiency gains.
Restraints Impact Analysis of Africa Cross Border Road Freight Transport Market*
| Restraint | ( ~ ) % Impact on CAGR Forecast | Geographic Relevance | Impact Timeline |
|---|---|---|---|
| Border-post corruption and informal fees | -0.7% | Central & West Africa | Short term (≤ 2 years) |
| Cabotage and axle-load fragmentation | -0.4% | Continental | Medium term (2-4 years) |
| Diesel price volatility | -0.3% | Import-dependent economies | Short term (≤ 2 years) |
| Climate-driven road failures | -0.2% | Sahel, Southern Africa | Long term (≥ 4 years) |
| Source: Mordor Intelligence | |||
Persistent Border-Post Corruption and Informal Fees
Average border dwell times can still exceed 48 hours on high-traffic corridors. The World Bank’s 2024 corridor audit names informal fees as the chief impediment to AfCFTA facilitation targets. ASYCUDA installations help; Gambia’s full rollout drove a 23% customs revenue jump and curbed cash-based collections. Yet electricity and internet gaps keep several posts manual, perpetuating rent-seeking. One-Stop Border Posts show promise—Mwami/Mchinji cut processing times 60% in 2024but regional peer-review mechanisms must scale to neutralize entrenched practices.
Cabotage and Axle-Load Policy Fragmentation by Country
Non-aligned laws compel costly transshipment or empty return legs. Gross vehicle weight ceilings differ by as much as 18 tons across neighboring states, and cabotage bans limit foreign trucks to border-in, border-out hauls, inflating backhaul costs. While the EAC standardizes axle loads, wider continental harmonization advances slowly because each government must enact domestic legislation. Until alignment accelerates, capacity utilization and rate stability remain vulnerable in the Africa Cross-Border Road Freight Transport market[3].
*Our forecasts treat driver/restraint impacts as directional, not additive. The impact forecasts reflect baseline growth, mix effects, and variable interactions.
Africa Cross Border Road Freight Transport Market Segment Analysis
By End User Industry:
Retail Trade Dominance Drives Digital IntegrationWholesale and Retail Trade makes up 29.12% of 2025 revenue and is the fastest-growing slice at 4.62% CAGR, signaling the segment’s dual influence over volume and innovation. High-frequency e-commerce shipments accelerate demand for precise, temperature-controlled urban deliveries, prompting carriers to integrate real-time tracking and flexible routing. Manufacturing follows as regional value chains mature, especially in automotive clusters across Morocco, South Africa, and Ethiopia. Mineral exports rally on critical-minerals demand, pushing dedicated FTL lanes between the DRC-Zambia copper belt and coastal ports. Agriculture tallies sizeable tons as digital phytosanitary certification trims rejection rates, while construction freight mirrors corridor-linked infrastructure booms. Pharmaceutical and electronics flows sit in the “Others” bucket, bringing stringent compliance and secure-handling service premiums.

By Truckload Specification:
LTL Growth Reflects Digital Platform SuccessFull-Truck-Load holds 52.78% share, favored for security and bulk minerals. Yet Less-than-Truck-Load posts a 4.05% CAGR to 2031 as tech platforms simplify load aggregation and documentation. Kobo360’s model, which bundles fuel financing and predictive maintenance, makes LTL viable for SMEs whose freight once moved informally. The Africa Cross-Border Road Freight Transport market is, therefore, drawing nearer to network-based models common in more mature geographies.
By Containerization:
Intermodal Integration Drives Container AdoptionNon-Containerized cargo retains a 56.48% majority, mainly minerals and bulk agriculture. Containerized freight climbs at 4.21% CAGR on the back of DP World’s port investments and shippers’ risk-mitigation preferences. Manufacturers prize sealed boxes for component integrity, and cold-chain boxes unlock pharmaceutical and produce routes. Port call volume jumped 20% in 2024, underscoring the modal shift under way.
By Distance:
Long-Haul Networks Benefit from Corridor DevelopmentLong-Haul accounts for 62.95% of revenue and outpaces Short-Haul at 4.31% CAGR as integrated corridors shorten door-to-door times. GPS-linked electronic seals reassure shippers moving goods across 800 km-plus journeys. Short-Haul complements these trunk routes via urban consolidation centers that manage last-mile complexity for retail and fast-moving consumer goods.
By Good Configuration:
Solid Goods Dominance Reflects Mining and ManufacturingSolid Goods command 80.62% share and rise at 4.15% CAGR because mining, automotive parts, and packaged FMCG underpin volumes. Critical-minerals corridors from Kolwezi to Lobito drive investment in secure, high-capacity trucks. Fluid Goods remain niche but strategic, covering petroleum, chemicals, and edible oils that require ADR-compliant tankers and strict documentation.
By Temperature Control:
Cold Chain Investment Accelerates Pharmaceutical GrowthNon-Temperature-Controlled freight still makes up 87.12% of tonnage, yet Temperature-Controlled lanes grow 4.08% CAGR as vaccine roll-outs and fresh produce exports demand 2°–8 °C compliance. DP World poured USD 29 million into Egyptian cold stores and IAG Cargo added SkyCell containers in 2025, expanding cold-chain capacity. IoT sensors and blockchain logs now provide lane-level temperature records, a prerequisite for pharmaceutical import approvals.
Geography Analysis
East Africa Cross Border Road Freight Transport Market
East Africa showcases the continent’s most advanced digital trade facilitation ecosystem. Kenya’s National Single Window connects 41 agencies and processed 80% of customs payments electronically by 2022, slashing border queues and boosting predictability. The Northern Corridor links Mombasa to Uganda, Rwanda, and the DRC through synchronized road, rail, and electronic tracking, carving out a high-efficiency freight spine. Harmonized axle-load standards and electronic cargo tracking via RECTS give fleet operators uniform compliance procedures across multiple jurisdictions, further enhancing East Africa’s pull on transit traffic within the Africa Cross-Border Road Freight Transport market.
West Africa Cross Border Road Freight Transport Market
West Africa follows with brisk digital strides. SIGMAT platform integration cut paperwork 88% and transit times 45% across member states. Nigeria’s single-window completion channels ECOWAS trade toward its borders, while the Abidjan-Lagos Corridor strings together five coastal economies under a shared road-upgrade and soft-infrastructure plan. Ghana’s conformance with WTO Article 10.4 single-window provisions stands out as a replicable model. The corridor’s dense consumer clusters amplify freight frequency, reinforcing the Africa Cross-Border Road Freight Transport market’s long-term demand outlook.
Southern Africa Cross Border Road Freight Transport Market
Southern Africa, anchored by South Africa’s industrial base, offers the most developed road infrastructure but wrestles with weather-driven disruptions and fragmented regulations. The USD 3 billion Lobito Corridor will divert DRC and Zambian copper away from congested southern routes, catalyzing new trucking lanes across Angola. SADC’s incremental regulatory harmonization, notably on weights and dimensions, eases cross-border compliance but gaps persist. Construction of the Trans-Kalahari Railway in 2025 will integrate Botswana’s mineral belt into Namibian ports, opening multimodal opportunities that should temper over-reliance on road transport.
Regulatory Landscape
Africa cross-border road freight is shaped by overlapping continental and regional regimes, with the African Continental Free Trade Area (AfCFTA) sitting alongside REC-specific customs and transit rules. The AfCFTA Protocol on Trade in Services identifies transport as a priority sector. The AfCFTA Online Mechanism for Reporting, Monitoring, and Elimination of Non-Tariff Barriers (NTBs), together with the 2024-2026 NTB Work Programme, also provides a defined channel to raise and resolve border frictions that feed directly into trucking lead times.
Regulatory convergence is most visible in East Africa, where customs modernization is being codified into bloc-wide tools. In September 2025, the East African Community Customs Management (Amendment) Act, 2025 commenced to streamline customs administration. In March 2026, the EAC Heads of State launched the EAC Customs Bond (EACBond) to allow transit cargo to move under a single, region-recognized bond. The EAC Assembling and Manufacturing of Products Regulations 2025 coming into force in July 2026 further tightened duty and tariff-line governance around assembly activity, increasing the compliance value of documentation-ready cross-border logistics services for manufacturers operating across EAC corridors.
Value Chain Analysis
The value chain for Africa cross-border road freight transport connects shippers (retailers, manufacturers, miners, and agro-exporters), freight forwarders and 3PL/4PL integrators, trucking fleets (asset-heavy and asset-light), and border interface actors (customs, inspection agencies, bond/guarantee providers, and corridor authorities). Digital layers are increasingly part of the operating model, including electronic declarations, electronic certificates of origin, and cargo visibility tools, alongside physical nodes such as consolidation hubs, bonded warehouses, and inland depots near border posts and ports.
Key friction points sit at border processing and within fragmented operating rules, including inconsistent customs procedures, limited pre-clearance, unofficial fees at checkpoints, and gaps in weighbridges and storage infrastructure at border posts. AfCFTA implementation is moving from negotiation to execution signals that affect the chain, including issuance of 5,800 certificates of origin as of mid-2026, which increases demand for compliant documentation workflows and audit-ready transport records. Alongside road-led corridor operations, ministerial efforts to align transport corridors with AfCFTA value chains were reinforced in June 2026 through the adoption of the Lome Ministerial Declaration and an implementation matrix, supporting more integrated corridor planning that links trucking with air cargo and other modes for time-critical shipments and modal blending.
Competitive Landscape
Acquisitions redefine scale economics in the Africa Cross-Border Road Freight Transport market. DSV’s USD 15.95 billion buyout of DB Schenker vaults the Danish giant into global pole position, with announced EUR 1 billion (USD 1.10 billion) domestic German investment earmarked for digitization and warehouse automation. CMA CGM’s EUR 4.85 billion (USD 5.35 billion) purchase of Bolloré Logistics folds Africa’s deepest overland network into a maritime-backed ecosystem, enhancing door-to-door container and trucking services. DP World’s USD 3 billion port and logistics pledge adds inland depots and cross-dock sites, creating competitive pressure on incumbents.
Digital natives gain traction. Kobo360, Logitrak, and Leta collectively raised multi-million-dollar rounds in 2024, differentiating through dynamic pricing, predictive asset scheduling, and embedded fintech offerings. Quick International Courier entered Africa’s niche cold-chain segment via its Unitrans buyout, bundling validated temperature-controlled capacity with pharmaceutical compliance expertise. Compliance capability becomes a commercial imperative; multinational clients increasingly stipulate ISO 14001, TAPA, and ASYCUDA API integration in tender documents.
Hybrid models emerge as integrators partner with platforms to expand reach. CMA CGM leverages CEVA’s CargoWise backbone to synchronize road and ocean milestones, while regional fleets plug into platform APIs for load visibility. The converging trajectories of asset-heavy and asset-light players moderate overall industry fragmentation, yet room remains for specialized operators serving challenging corridors or temperature-sensitive verticals.
Africa Cross Border Road Freight Transport Industry Leaders
-
DSV
-
DHL Group
-
Unitrans Supply Chain Solutions
-
CEVA Logistics
-
Cargo Carriers
- *Disclaimer: Major Players sorted in no particular order

Africa Cross Border Road Freight Transport Market Companies Covered in this Report
- DSV
- DHL Group
- Unitrans Supply Chain Solutions
- CEVA Logistics
- Cargo Carriers
- Value Logistics
- Rhenus Logistics
- Super Group
- Bidvest Freight
- Grindrod Logistics
- Kuehne + Nagel
- OML Africa Logistics
- Megafreight Services Pty (Ltd)
- BAC Logistics
- Rangel Logistics Solutions
- Unidel Carriers
- OneLogix Cargo Solutions
- Atrax Logistics
- RDM Logistics
- Aeromarine Capital
Read Analysis of Africa Cross Border Road Freight Transport Companies
Market Opportunities and Future Outlook
A major opportunity area is corridor-led capacity build-out paired with trade facilitation, where operators can productize predictable transit through network design, bonded movements, and digitally supported documentation. The Abidjan-Lagos Corridor Highway entered its operational phase in February 2026, following the December 2025 board swearing-in and the launch of its Governing Board, which adds governance clarity for soft infrastructure and corridor performance initiatives. This directly supports scheduled linehaul, cross-dock operations, and LTL aggregation. PIDA PAP 2 also provides a structured pipeline of 69 priority projects, creating whitespace for fleets and integrators to set up inland depots, consolidation hubs, and compliant cross-border service bundles around these corridors.
Digitized customs and simplified trader processes offer another near-term monetization path, since they turn border compliance into a service layer that can be packaged for SMEs and high-frequency retail flows. In March 2026, the AfCFTA Secretariat selected Nigeria as the pilot for implementing the Simplified Trade Regime (STR) in West Africa, anchored by a draft standard operating procedure for customs simplification. This supports new offerings in brokerage, document automation, and pre-advice or pre-clearance services on ECOWAS-facing lanes. AfCFTA programs such as electronic certificates of origin, an e-tariff book, and the Pan-African Payment and Settlement System (PAPSS) further expand room for platform-enabled cross-border trucking, particularly where shippers want fewer cash frictions and more traceable compliance across multiple jurisdictions.
Recent Industry Developments in Africa Cross Border Road Freight Transport Market
- March 2026: East African Community (EAC) Heads of State launched the EAC Customs Bond (EACBond) in Arusha to enable transit cargo to move under a single, region-wide recognized customs bond. This reduces reliance on multiple national bonds and cash deposits across EAC corridors, supporting smoother multi-country road movements. For carriers and forwarders, a single-bond construct strengthens the commercial case for scheduled cross-border linehaul and consolidation networks.
- October 2025: DHL Group announced a planned investment of more than EUR 300 million in Sub-Saharan Africa across its Express, Global Forwarding, and Supply Chain divisions to expand infrastructure and enhance service capabilities. The program increases competitive intensity for time-definite and integrated road-forwarding offerings that connect inland markets to ports and airports. It also elevates service benchmarks on visibility, compliance, and network density for cross-border road freight providers.
- June 2024: DP World committed USD 3 billion to African ports and logistics through 2029 to support mineral exports and intra-continental trade. The investment underpins inland depot and intermodal development that changes how cross-border road freight is staged, consolidated, and handed off to maritime gateways. For trucking, stronger port-linked logistics nodes can lift containerized corridor movements and create more structured backhaul opportunities.
Africa Cross Border Road Freight Transport Market Report Scope and Research Methodology
Market Definition and Coverage
This market covers paid road freight services that move goods across international borders within Africa, including line-haul transport and the supporting cross-border trucking activity needed to complete those moves.
Scope exclusions: We exclude pure domestic-only road freight moves that do not cross a national border, and we also exclude rail, air, and ocean freight services.
Segments Covered in This Report
- By End User Industry
- Agriculture, Fishing, and Forestry
- Construction
- Manufacturing
- Oil and Gas, Mining and Quarrying
- Wholesale and Retail Trade
- Others
- By Truckload Specification
- Full-Truck-Load (FTL)
- Less-than-Truck-Load (LTL)
- By Containerization
- Containerized
- Non-Containerized
- By Distance
- Long-Haul
- Short-Haul
- By Good Configuration
- Fluid Goods
- Solid Goods
- By Temperature Control
- Non-Temperature Controlled
- Temperature Controlled
Data Sources, Market Sizing, and Validation
Desk Research
For desk research, we first map trade-linked demand for trucking by looking at public trade and corridor indicators, and then we translate those signals into serviceable road-freight activity. Sources used include official trade and border-flow context from UN Comtrade, the African Development Bank, and UNCTAD, alongside corridor and facilitation references from the World Bank and UNECA.
We also reviewed country transport and customs publications, port and border authority updates, and freight and logistics association releases to understand delays, permit rules, and typical lane behavior that changes volumes. Company annual reports, investor presentations, and reliable press were used to cross-check service footprints, fleet additions, and corridor expansion statements. Where needed, we used paid subscriptions for company financial intelligence and shipment-level import and export records to validate directionality and rough volume intensity on key lanes. These examples are not exhaustive, and many other public and proprietary sources were also used for data collection, validation, and clarification.
Primary Interviews and Surveys
Primary work focused on validating how much of broader road freight demand is truly cross-border, and what pricing and utilization looks like on active corridors. We spoke with carrier and forwarder executives, corridor and border-adjacent operations leaders, and shipper-side logistics managers, and we also checked perspectives across the main trading sub-regions so assumptions did not lean on one corridor only.
Distribution of primary research fieldwork respondents
| Company type | Respondent position |
|---|---|
| Top tier: 39% | CXOs: 20% |
| Mid tier: 41% | Functional/Unit leaders: 22% |
| Smaller Players: 20% | Managers: 58% |
Market-Sizing & Forecasting
Our sizing starts with a top-down build that reconstructs cross-border trucking demand from trade-linked freight movement and corridor activity, which is then converted into service revenue using lane-level price behavior. To keep the model grounded, results are corroborated with selective bottom-up approximations such as sampled shipment values translated into likely tonnage moves, corridor channel checks on utilization, and supplier roll-ups where public revenue disclosure is available.
Inputs that materially shape totals include the value and mix of intra-African trade, the share of goods that practically move by road on specific corridors, border crossing time patterns that cap trip frequency, fuel cost trends that influence rate pass-through, and changes in permit and customs processes that affect routing and empty backhauls. Forecasts were built using scenario analysis supported by variable-level expectations from primary respondents, especially on how trade growth, corridor upgrades, and compliance costs may shift prices and effective capacity. When data is thin for a corridor, we fill gaps using comparable lane proxies and then re-check the implied revenue per truck against what operators describe as achievable in normal conditions.
Data Validation & Update Cycle
Totals are checked through triangulation across independent signals, including trade movement direction, corridor constraints, and realistic trip economics, before assumptions are locked. Outliers are reviewed in a second pass where we re-test inputs like price per trip, utilization, and border-delay assumptions until the variance looks explainable.
The report is refreshed annually, and interim updates are made when material events occur, such as major policy shifts, corridor disruptions, or sharp fuel movements. Before delivery, we do a final refresh pass so the published view reflects the latest data points and interview learnings available at that time.
Mordor Intelligence's Africa Cross Border Road Freight Transport Market Sizing Compared With Other Published Estimates
Published market sizes for Africa cross-border road freight transport often differ because each publisher makes different choices on what counts as cross-border activity, how they treat freight intermediaries, and which year and currency timing they lock for pricing. Differences also come from whether corridor constraints are modeled as a capacity limiter or treated as a short-term issue that does not affect revenue totals.
Some published numbers expand the scope to include a wider logistics bundle, and they may also carry longer-horizon assumptions that lift growth even when border friction remains. In our estimate, the table spread is explained by how cross-border moves are counted only when an international border is crossed by road and the revenue is attributed to the transport service provided, a scope choice applied by Mordor Intelligence.
Benchmark comparison
| Source | Market Size | Gaps in Research Methodology |
|---|---|---|
| Mordor Intelligence | USD 9.81 B (2025) | |
| Regional Consultancy A | USD 10.71 B (2026) | Uses a later starting year and a broader service lens that appears to include more specialized freight and corridor coverage, which can lift the total relative to a strict cross-border road-transport revenue view. |
| Trade Journal B | USD 11.10 B (2025) | Likely blends cross-border road freight with adjacent logistics services and applies higher corridor utilization and faster price progression assumptions without showing consistent checks against border-delay limits. |
Across the three figures, the main takeaway is that scope and pricing assumptions drive most of the spread, not a disagreement that cross-border trucking is growing. By tying demand to trade-linked lanes and then pressure-testing prices and utilization through field inputs, our number stays traceable to clear variables and repeatable steps for future updates.
Key Questions Answered in the Report
What is the current value of the Africa Cross-Border Road Freight Transport market?
The market is valued at USD 10.2 billion in 2026 and is projected to grow to USD 12.38 billion by 2031.
Which segment holds the largest market share?
Full-Truck-Load operations dominate with 52.78% share in 2025.
What is driving the fastest growth among end-user industries?
Wholesale and Retail Trade expands at 4.62% CAGR due to e-commerce and regional value-chain integration.
How are infrastructure corridors influencing market growth?
Projects such as the Lobito and Northern Corridors cut transit times and unlock new long-haul routes, bolstering demand.
Which region leads in digital trade facilitation?
East Africa, where Kenya’s National Single Window handles 80% of customs payments electronically.