Africa Confectionery Market Size and Share
Market Overview
| Study Period | 2017 - 2030 |
|---|---|
| Base Year For Estimation | 2024 |
| Forecast Data Period | 2025 - 2030 |
| Market Size (2025) | USD 5.31 Billion |
| Market Size (2030) | USD 7.69 Billion |
| Growth Rate (2025 - 2030) | 7.72% CAGR |
| Market Concentration | Medium |
Major Players*Disclaimer: Major Players sorted in no particular order Image © Mordor Intelligence. Reuse requires attribution under CC BY 4.0. | |

Africa Confectionery Market Analysis by Mordor Intelligence
The Africa Confectionery Market size is estimated at 5.31 billion USD in 2025, and is expected to reach 7.69 billion USD by 2030, growing at a CAGR of 7.72% during the forecast period (2025-2030).
The African confectionery industry is experiencing significant transformation driven by evolving retail landscapes and distribution channels. Supermarkets and hypermarkets continue to dominate the retail space, with major players like Shoprite Holdings, Carrefour, and Massmart Holdings expanding their presence across the region. As of 2023, Massmart operates 287 stores across South Africa's nine provinces, while Carrefour maintains a strong presence through franchises in seven African countries with over 200 stores. The extensive retail network ensures widespread availability of both local and international confectionery industry brands, contributing to market growth through improved accessibility and product variety.
Consumer preferences are increasingly influenced by rising disposable incomes and changing lifestyle patterns across the region. In South Africa, the median monthly salary of USD 1,394 in 2022 significantly exceeded the regional average of USD 758, enabling greater consumption of premium confectionery and luxury chocolate products. This economic disparity has prompted manufacturers to develop diverse product portfolios catering to different income segments, while also driving innovation in premium confectionery offerings. The market has witnessed several premium product launches, including Lindt's introduction of crafted vegan chocolate confectionery bars in South Africa in 2023.
The tourism sector is emerging as a significant driver of confectionery sales, particularly in countries with strong historical and cultural appeal. Egypt's tourism industry, which welcomed 11.7 million visitors in 2023, has created substantial opportunities for confectionery manufacturers, especially in travel retail locations. The growing number of international travelers has influenced product positioning and packaging strategies, with manufacturers developing convenient, travel-friendly formats and gift presentations that appeal to tourists seeking authentic local flavors and international brands.
Health and wellness trends are reshaping product development and marketing strategies in the African confectionery market. The fitness industry's growth, evidenced by over 1,120 gyms and 2.60 million health club memberships in South Africa as of 2022, has spurred demand for healthier functional confectionery options. Manufacturers are responding by incorporating functional ingredients and developing products with reduced sugar content, while also leveraging the region's abundant natural resources, such as its position as a major producer of raw cashew nuts, with over 1.8 million tons produced in 2023, to create healthier, nut-based organic confectionery products that align with contemporary wellness preferences.
Africa Confectionery Market Trends and Insights
Sugar confectioneries and chocolates are widely accepted confectioneries among Africans, thereby resulting in a higher per capita consumption of these products
- Consumption of confectionery products is highly valued by individuals of different ages in Africa, with confectionery consumption being particularly prevalent among those aged 20 to 30. Chocolate confectionery is consumed by consumers of all ages, socio-economic groups, and both genders.
- Under the confectionery section, consumers are mainly affected by brand loyalty. In Africa, Gen Z and Millennial consumers professed the highest brand loyalty among other age groups. 73% of African consumers consider themselves “loyal” to certain retailers, brands, and stores.
- In 2023, confectionery products witnessed a hike in their sales. The sales growth is linked to the changing eating habits of consumers.; In 2023, under the confectionery segment, the snack bar has been gaining a significant volume of popularity as people prefer them over fried snacks.
- In Africa, under the confectionery segment, chocolate is a popular treat enjoyed by individuals; there are considerations regarding its health benefits and potential drawbacks. Chocolates will be consumed by 92% of the population in 2023.
OTHER KEY INDUSTRY TRENDS COVERED IN THE REPORT
- The use of naturally produced color with unique color emulsion technology is expected to propel the market
Segment Analysis: Confections
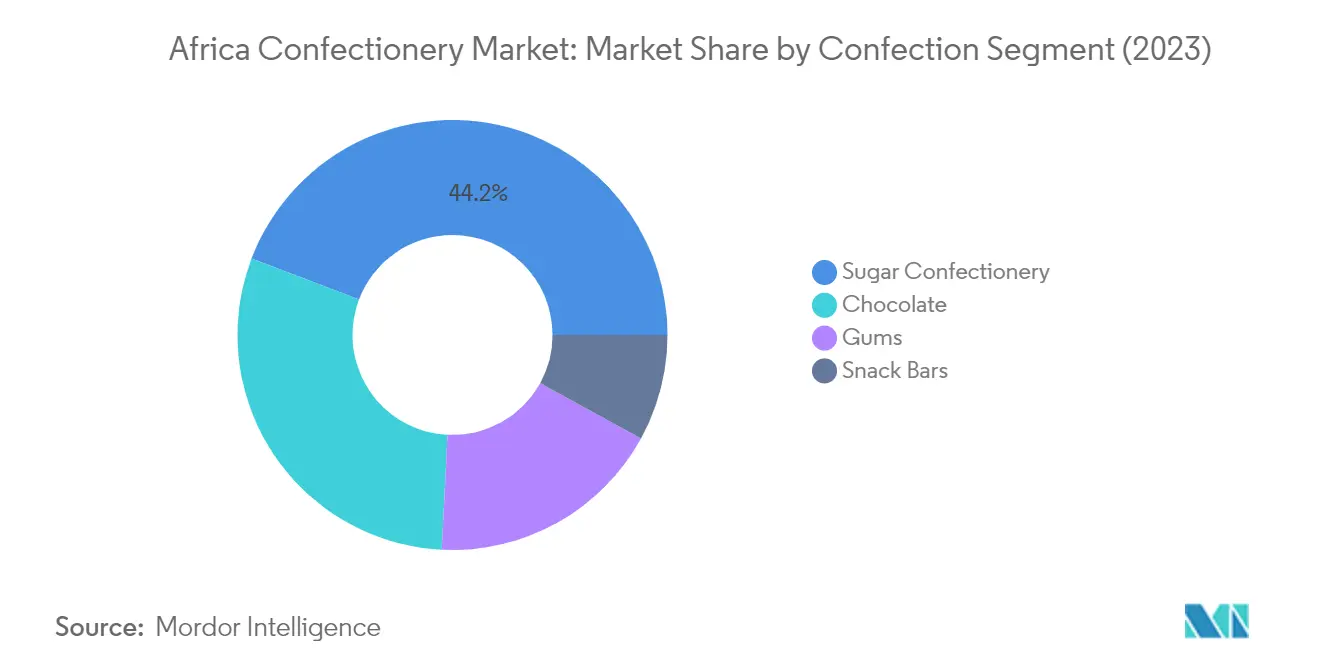
Sugar Confectionery Segment in African Confectionery Market
Sugar confectionery maintains its dominant position in the African confectionery market, commanding approximately 44% market share in 2024. The segment's strong performance is driven by innovative packaging concepts and increasing demand for on-the-go snack options, particularly among children and young consumers across the region. The availability of sugar confections in unique flavors such as nurungji and honey-filled candy continues to attract African consumers. Within sugar confectionery, hard candy accounts for a prominent share of around 28% by volume, while pastilles, gummy candy, and jellies are also significant contributors. The segment's growth is further supported by the expanding profile of both international and local manufacturers who are introducing new product variants with improved ingredients and exotic tastes. Strategic positioning in retail outlets and competitive pricing strategies have also helped sugar confectionery maintain its market leadership.
Remaining Segments in Confectionery Market
The African confectionery market features several other important segments, including chocolate, gums, and snack bars, each serving distinct consumer preferences and needs. The chocolate segment, particularly dark chocolate variants, has gained prominence due to growing health consciousness and premium product preferences among consumers. The gums segment maintains steady growth through product innovations in sugar-free variants and diverse flavor offerings targeting younger consumers, including chewing gum. Snack bars have emerged as a significant category driven by the rising health and wellness trends, with protein bars and candy bar gaining popularity among fitness enthusiasts and health-conscious consumers. These segments collectively contribute to the market's diversification and cater to evolving consumer preferences for healthier, convenient, and premium confectionery options.
Segment Analysis: Distribution Channel
Convenience Store Segment in Africa Confectionery Market
Convenience stores have emerged as the dominant distribution channel in Africa's confectionery market, commanding approximately 45% market share in 2024. The broader reach and easy access to private label brands drive consumer preference for convenience stores over other retail channels. These stores strategically position themselves in high-traffic areas across countries, making confectionery products easily accessible to consumers. Major supermarkets and hypermarkets also operate local convenience stores with their brands, such as Carrefour City, Carrefour Express, Coccimarket, and Casino Shop. Chocolates and sugar confectionery are largely sold product categories through African convenience stores, with chocolate sales particularly strong through this channel. The convenience store format has proven especially successful due to its ability to cater to impulse purchases and provide a wide range of both local and international confectionery brands.
Online Retail Store Segment in Africa Confectionery Market
The online retail channel is demonstrating remarkable growth potential, with an anticipated CAGR of approximately 10% during 2024-2029. This growth is primarily driven by the increasing penetration of internet users and smartphones across the region, coupled with changing consumer preferences toward digital shopping platforms. Online retailers are attracting consumers through various services such as store-to-door delivery, on-demand ordering, and click-and-collect in-store pickup options. The channel's ability to offer a wide product assortment, competitive pricing, and convenient shopping experience is particularly appealing to urban consumers. E-commerce platforms are also leveraging digital marketing tools to target new customers and utilizing website analytics to gain valuable consumer insights, further driving the segment's growth.
Remaining Segments in Distribution Channel
The supermarket/hypermarket and other distribution channels continue to play vital roles in Africa's confectionery market. Supermarkets and hypermarkets maintain a strong presence through their extensive product ranges, competitive pricing, and ability to offer both premium and value segments of confectionery products. These stores design specific foot traffic patterns and dedicated shelves for confectionery products to maximize sales. The 'Others' category, which includes specialty stores, warehouse clubs, drug stores/pharmacies, vending machines, and forecourt retailers, serves specific consumer needs and preferences. Specialty stores, in particular, focus on premium and artisanal confectionery products, while vending machines provide 24/7 accessibility to confectionery items in high-traffic locations.
Africa Confectionery Market Geography Segment Analysis
Confectionery Market in South Africa
South Africa dominates the African confectionery landscape, commanding approximately 37% of the total market value in 2024. The country's confectionery market is characterized by a strong presence of both international and local brands, with a particular emphasis on premium confectionery and luxury offerings. Consumer demand is primarily driven by the higher average income levels compared to other regional markets, enabling greater spending on premium confectionery products. The market's robustness is further supported by well-established retail infrastructure, including modern trade channels and specialty stores. South African consumers show a marked preference for chocolate confectionery, particularly dark chocolate variants, influenced by growing health consciousness and dietary preferences. The market also benefits from sophisticated distribution networks, advanced cold chain facilities, and strategic partnerships between manufacturers and retailers, ensuring wide product availability and freshness.
Confectionery Market in Egypt
Egypt's confectionery market is poised for remarkable expansion, with projections indicating a growth rate of approximately 7% during 2024-2029. The market's dynamic growth is underpinned by the country's large youth population and increasing urbanization trends. Egyptian consumers are increasingly embracing international confectionery brands while maintaining strong loyalty to traditional local sweets and candies. The market is witnessing significant innovation in product formulations, particularly in sugar-free and functional confectionery segments. Local manufacturers are investing in modern production facilities and expanding their distribution networks to meet growing demand. The country's strategic location and well-developed port infrastructure facilitate both import and export activities, making it a key hub for confectionery trade in the region. Rising disposable incomes and changing consumer preferences towards packaged and branded confectionery products are further driving market expansion.
Confectionery Market in Nigeria
Nigeria's confectionery market showcases significant potential, supported by its position as one of Africa's largest cocoa-producing nations. The market benefits from abundant local raw material availability, particularly cocoa, with Ondo State alone producing approximately 80,000 tons annually. Consumer preferences in Nigeria are evolving, with increasing demand for both traditional and modern confectionery products. The market is characterized by a strong presence of international brands alongside growing local manufacturers. Nigerian consumers show particular interest in sugar confectionery products, including candies, toffees, and chews, which remain popular across various demographic segments. The country's retail landscape is evolving, with modern trade formats gaining prominence alongside traditional retail channels, enhancing product accessibility and visibility. The confectionery industry in Nigeria continues to grow, driven by these evolving consumer preferences and market dynamics.
Confectionery Market in Other Countries
The confectionery market in other African countries, including Algeria, Ghana, Kenya, Cameroon, Angola, Ethiopia, Morocco, and Uganda, presents diverse opportunities and challenges. These markets are characterized by varying levels of development and consumer preferences, influenced by local cultural traditions and economic conditions. Ghana, as the world's second-largest cocoa producer, plays a crucial role in the regional confectionery supply chain. Markets like Kenya and Morocco show increasing sophistication in consumer preferences, particularly in urban areas. The confectionery landscape in these countries is evolving with growing investment in modern retail infrastructure and increasing presence of international brands. Local manufacturers in these markets are focusing on product innovation and improving distribution networks to capture growing consumer demand. The governments in several of these countries are implementing supportive policies to develop their domestic confectionery industries, particularly in cocoa-producing nations.
Competitive Landscape
Top Companies in Africa Confectionery Market
The African confectionery market features prominent global players like Mondel-z International, Mars Incorporated, Nestlé SA, Tiger Brands, and Chocoladefabriken Lindt & Sprüngli AG leading the competitive landscape. Companies are actively engaging in product innovations, particularly focusing on clean-label ingredients, sustainable sourcing practices, and healthier alternatives to traditional confectionery products. Operational agility is demonstrated through investments in manufacturing facilities and distribution networks across key African markets. Strategic moves include collaborations with local partners, direct sourcing relationships with cocoa farmers, and digital transformation initiatives to enhance consumer reach. Market expansion strategies emphasize developing region-specific product variants, establishing new production facilities, and strengthening presence through both traditional and modern retail channels.
Global Leaders Dominate Regional Confectionery Market
The African confectionery industry exhibits a moderately consolidated structure dominated by multinational corporations with established global supply chains and strong brand portfolios. These major players leverage their extensive research and development capabilities, advanced manufacturing facilities, and widespread distribution networks to maintain market leadership. Local players, though fewer in number, maintain a significant presence in specific regional markets through their understanding of local taste preferences and established distribution relationships with traditional retail channels.
The market demonstrates active merger and acquisition activity, with global players acquiring local manufacturers to expand their regional footprint and access established distribution networks. Vertical integration strategies are evident as companies seek to control their supply chains, particularly in cocoa-producing regions. The competitive landscape is further shaped by partnerships between international brands and local distributors, enabling better market penetration and consumer reach across diverse African markets.
Innovation and Distribution Drive Market Success
For incumbent companies to maintain and expand their market share, focusing on product innovation aligned with local consumer preferences and health trends remains crucial. Developing sustainable sourcing practices, particularly for cocoa and other key ingredients, while maintaining cost competitiveness is essential. Companies must also invest in modernizing distribution networks, embracing digital commerce channels, and strengthening relationships with traditional retail partners to ensure comprehensive market coverage. Building strong local manufacturing capabilities and developing region-specific marketing strategies are becoming increasingly important for sustained success.
New entrants and challenger brands can gain ground by focusing on niche market segments, particularly in premium confectionery and health-conscious categories. Success factors include developing innovative product formulations, establishing efficient supply chain networks, and building strong relationships with local distributors. Companies must also consider potential regulatory changes regarding sugar content and packaging sustainability, while addressing the growing consumer demand for transparency in ingredient sourcing and manufacturing processes. The ability to adapt to changing consumer preferences while maintaining product quality and affordability will be crucial for long-term success in this dynamic market. Additionally, the rise of artisanal confectionery and luxury chocolate offerings presents opportunities for differentiation and capturing the attention of discerning consumers.
Africa Confectionery Industry Leaders
Chocoladefabriken Lindt & Sprüngli AG
Mars Incorporated
Mondelēz International Inc.
Nestlé SA
Tiger Brands
- *Disclaimer: Major Players sorted in no particular order

Recent Industry Developments
- July 2023: Chocoladefabriken Lindt & Sprüngli AG launched a vegan chocolate range in South Africa. The products are available in two vegan flavors – Lindt Vegan Smooth Chocolate (made with oats and almonds to deliver a smooth, creamy texture) and Lindt Vegan Hazelnut Chocolate (made with roasted hazelnuts and premium vegan chocolate for a nutty flavor).
- May 2023: Under its brand, Mondelēz International Inc. launched three new special edition flavors that deliver indulgence with much-loved flavor combinations. The 150 g slabs include Dairy Milk Fudge Cookie Crumble, Fudge Mint Crisp, and Dream Coconut & Hazelnut Bliss.
- April 2023: Under the ONE brand, The Hershey Company launched the Peanut Butter & Jelly Flavored Protein Bar. The ONE Limited Edition Peanut Butter & Jelly flavored bars are packed with 20 g of protein, 1 g of sugar, and the familiar taste of peanut butter and strawberry jelly flavors.
Africa Confectionery Market Report Scope
Chocolate, Gums, Snack Bar, Sugar Confectionery are covered as segments by Confections. Convenience Store, Online Retail Store, Supermarket/Hypermarket, Others are covered as segments by Distribution Channel. Egypt, Nigeria, South Africa are covered as segments by Country.| Chocolate | By Confectionery Variant | Dark Chocolate | ||
| Milk and White Chocolate | ||||
| Gums | By Confectionery Variant | Bubble Gum | ||
| Chewing Gum | By Sugar Content | Sugar Chewing Gum | ||
| Sugar-free Chewing Gum | ||||
| Snack Bar | By Confectionery Variant | Cereal Bar | ||
| Fruit & Nut Bar | ||||
| Protein Bar | ||||
| Sugar Confectionery | By Confectionery Variant | Hard Candy | ||
| Lollipops | ||||
| Mints | ||||
| Pastilles, Gummies, and Jellies | ||||
| Toffees and Nougats | ||||
| Others | ||||
| Convenience Store |
| Online Retail Store |
| Supermarket/Hypermarket |
| Others |
| Egypt |
| Nigeria |
| South Africa |
| Rest of Africa |
| Confections | Chocolate | By Confectionery Variant | Dark Chocolate | ||
| Milk and White Chocolate | |||||
| Gums | By Confectionery Variant | Bubble Gum | |||
| Chewing Gum | By Sugar Content | Sugar Chewing Gum | |||
| Sugar-free Chewing Gum | |||||
| Snack Bar | By Confectionery Variant | Cereal Bar | |||
| Fruit & Nut Bar | |||||
| Protein Bar | |||||
| Sugar Confectionery | By Confectionery Variant | Hard Candy | |||
| Lollipops | |||||
| Mints | |||||
| Pastilles, Gummies, and Jellies | |||||
| Toffees and Nougats | |||||
| Others | |||||
| Distribution Channel | Convenience Store | ||||
| Online Retail Store | |||||
| Supermarket/Hypermarket | |||||
| Others | |||||
| Country | Egypt | ||||
| Nigeria | |||||
| South Africa | |||||
| Rest of Africa | |||||
Market Definition
- Milk and White Chocolate - Milk chocolates is a solid chocolate made with milk (in the form of either milk powder, liquid milk, or condensed milk) and cocoa solids. White chocolate is made from cocoa butter and milk and contains no cocoa solids whatsoever. The scope includes regular chocolates, low-sugar, and sugar-free variants
- Toffees & Nougats - Toffees include hard, chewy, and small or one-bite candies marketed with labels as toffee or toffee-like confectionery. Nougat is a chewy confection with almond, sugar, and egg white as a basic ingredient; and it originated in Europe and Middle East countries.
- Cereals Bars - A snack composed of breakfast cereal that has been compressed into a bar shape and is held together with a form of edible adhesive. The scope includes snack bars made with cereals such as rice, oats, corn, etc. mixed with a binding syrup. These also include products labeled as cereal bars, cereal treat bars, or grain bars.
- Chewing Gum - This is a preparation for chewing, usually made of flavored and sweetened chicle or such substitutes as polyvinyl acetate. The types of chewing gums included in the scope are sugar-chewing gums and sugar-free chewing gums
| Keyword | Definition |
|---|---|
| Dark Chocolate | Dark chocolate is a form of chocolate containing cocoa solids and cocoa butter without the milk. |
| White Chocolate | White chocolate is the type of chocolate containing the highest percentage of milk solids, typically around or over 30 percent. |
| Milk Chocolate | Milk chocolate is made from dark chocolate that has a low cocoa solid content and higher sugar content, plus a milk product. |
| Hard Candy | A candy made of sugar and corn syrup boiled without crystallizing. |
| Toffees | A hard, chewy, often brown sweet that is made from sugar boiled with butter. |
| Nougats | A chewy or brittle candy containing almonds or other nuts and sometimes fruit. |
| Cereal bar | A cereal bar is a bar-shaped food product, made by pressing cereals and usually dried fruit or berries, which are in most cases held together by glucose syrup. |
| Protein bar | Protein bars are nutrition bars that contain a high proportion of protein to carbohydrates/fats. |
| Fruit & Nut bar | These are often based on dates with other dried fruit and nut additions and, in some cases, flavorings. |
| NCA | The National Confectioners Association is an American trade organization that promotes chocolate, candy, gum and mints, and the companies that make these treats. |
| CGMP | Current good manufacturing practices are those conforming to the guidelines recommended by relevant agencies. |
| Unstandardized foods | Unstandardized foods are those that do not have a standard of identity or that deviate from a prescribed standard in any manner. |
| GI | The glycemic index (GI) is a way of ranking carbohydrate-containing foods based on how slowly or quickly they are digested and increase blood glucose levels over a period of time |
| Skimmed milk powder | Skimmed milk powder is obtained by removing water from pasteurized skim milk by spray-drying. |
| Flavanols | Flavanols are a group of compounds found in cocoa, tea, apples, and many other plant-based foods and beverages. |
| WPC | Whey protein concentrate- the substance obtained by the removal of sufficient nonprotein constituents from pasteurized whey so that the finished dry product contains greater than 25% protein. |
| LDL | Low density Lipoprotein- the bad cholesterol |
| HDL | High density Lipoprotein- the good cholesterol |
| BHT | butylated Hydroxytoluene is a lab-made chemical that is added to foods as a preservative. |
| Carrageenan | Carrageenan is an additive used to thicken, emulsify, and preserve foods and drinks. |
| Free form | Not containing certain ingredients, such as gluten, dairy, or sugar. |
| Cocoa butter | It is a fatty substance obtained from cocoa beans, used in the manufacture of confectionery. |
| Pastellies | A type of of Brazilian candy made from sugar, eggs, and milk. |
| Draggees | Small, round candies that are coated with a hard sugar shell |
| CHOPRABISCO | Royal Belgian Association of the chocolate, pralines, biscuit, and confectionery industry- A trade association that represents the Belgian chocolate industry. |
| European Directive 2000/13 | A European Union directive that regulates the labeling of food products |
| Kakao-Verordnung | The German chocolate ordinance, a set of regulations that define what can be labeled as "chocolate" in Germany. |
| FASFC | Federal Agency for the Safety of the Food Chain |
| Pectin | A natural substance that is derived from fruits and vegetables. It is used in confectionery to create a gel-like texture. |
| Invert sugars | A type of sugar that is made up of glucose and fructose. |
| Emulsifier | A substance that helps to mix to liquids that does not mix together. |
| Anthocyanins | A type of flavonoid that is responsible for the red, purple, and blue colors of confectionery. |
| Functional Foods | Foods that have been modified to provide additional health benefits beyond basic nutrition. |
| Kosher certificate | This certification verifies that the ingredients, production process including all machinery, and/or food-service process complies with the standards of Jewish dietary law |
| Chicory root extract | A natural extract from the chicory root that is a good source of fiber, calcium, phosphorous, and folate |
| RDD | Recommended daily dose |
| Gummies | A chewy gelatin-based candy that is often flavored with fruit. |
| Nutraceuticals | Food or dietary supplements that are claimed to have health benefits. |
| Energy bars | Snack bars that are high in carbohydrates and calories are designed to provide energy on the go. |
| BFSO | Belgian Food Safety Organization for the food chain. |
Research Methodology
Mordor Intelligence follows a four-step methodology in all our reports.
- Step-1: Identify Key Variables: In order to build a robust forecasting methodology, the variables and factors identified in Step 1 are tested against available historical market numbers. Through an iterative process, the variables required for market forecast are set, and the model is built on the basis of these variables.
- Step-2: Build a Market Model: Market-size estimations for the forecast years are in nominal terms. Inflation is not a part of the pricing, and the average selling price (ASP) is kept constant throughout the forecast period for each country.
- Step-3: Validate and Finalize: In this important step, all market numbers, variables, and analyst calls are validated through an extensive network of primary research experts from the market studied. The respondents are selected across levels and functions to generate a holistic picture of the market studied.
- Step-4: Research Outputs: Syndicated Reports, Custom Consulting Assignments, Databases & Subscription Platforms


