
Market Overview
| Study Period | 2021 - 2031 |
|---|---|
| Forecast Data Period | 2026 - 2031 |
| Base Year Market Size (2025) | USD 11.7 Billion |
| Market Size (2026) | USD 12.21 Billion |
| Market Size (2031) | USD 15.08 Billion |
| Growth Rate (2026 - 2031) | 4.32 % |
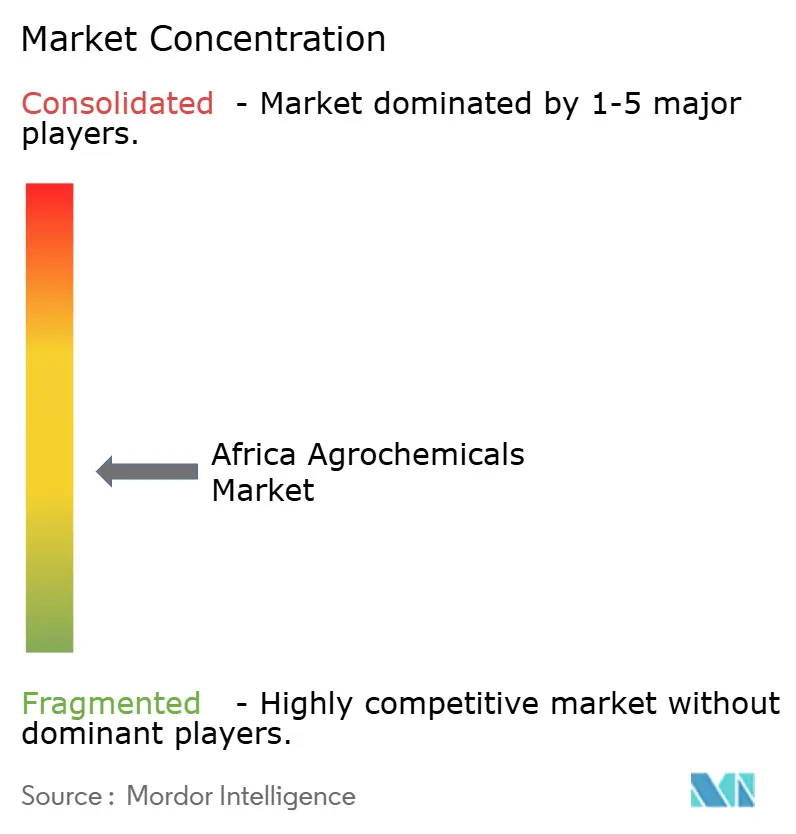
| Market Concentration | Medium |
Major Players *Disclaimer: Major Players sorted in no particular order Image © Mordor Intelligence. Reuse requires attribution under CC BY 4.0. | |
Africa Agrochemicals Market Analysis by Mordor Intelligence
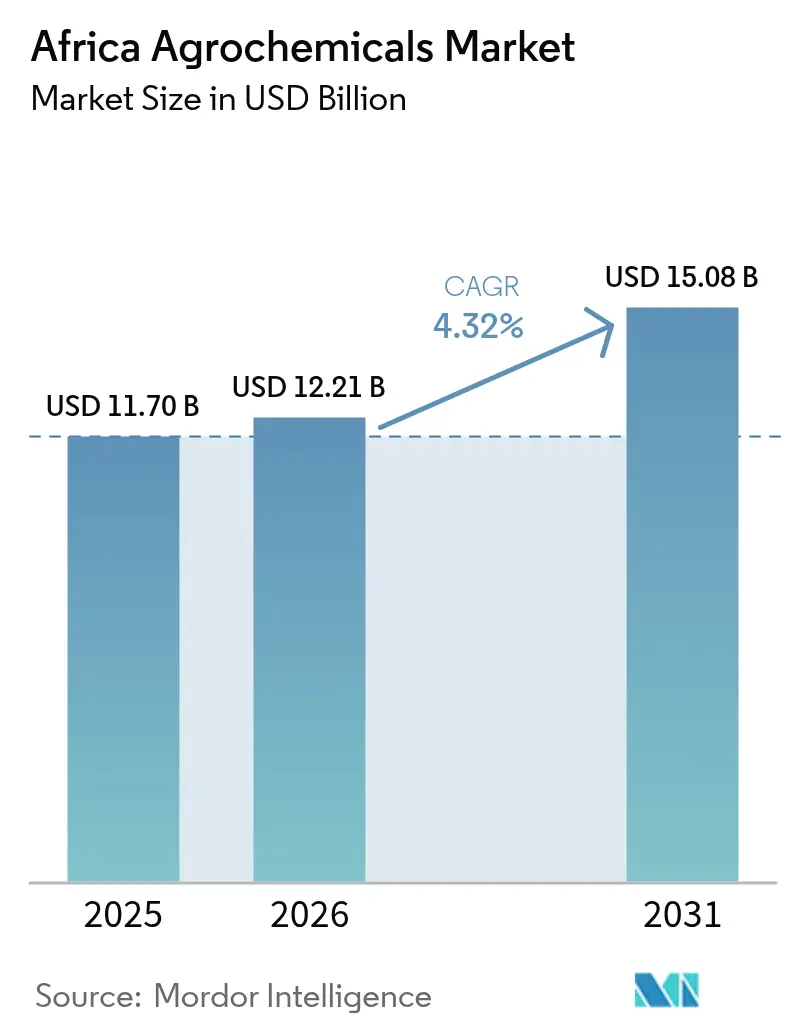
The Africa agrochemicals market size is expected to grow from USD 11.7 billion in 2025 to USD 12.21 billion in 2026 and is forecast to reach USD 15.08 billion by 2031 at 4.32% CAGR over 2026-2031. Fertilizers held the largest share of the market in 2024, supported by widespread soil nutrient depletion across Africa. Plant growth regulators have emerged as the fastest-growing segment, as farmers increasingly adopt precision application methods[1]. The market growth is supported by increasing pest challenges, growing food demand from population expansion, and government subsidy programs that improve access for smallholder farmers. High input costs and inconsistent regulations across regions limit efforts to close the agricultural yield gap. Market participants are establishing local manufacturing facilities, developing innovative distribution networks, and creating sustainable product lines with precision chemical solutions. Additionally, governments are expanding warehouse-receipt financing systems and mechanization support programs, which drive increased demand in the agrochemicals market.
Key Report Takeaways
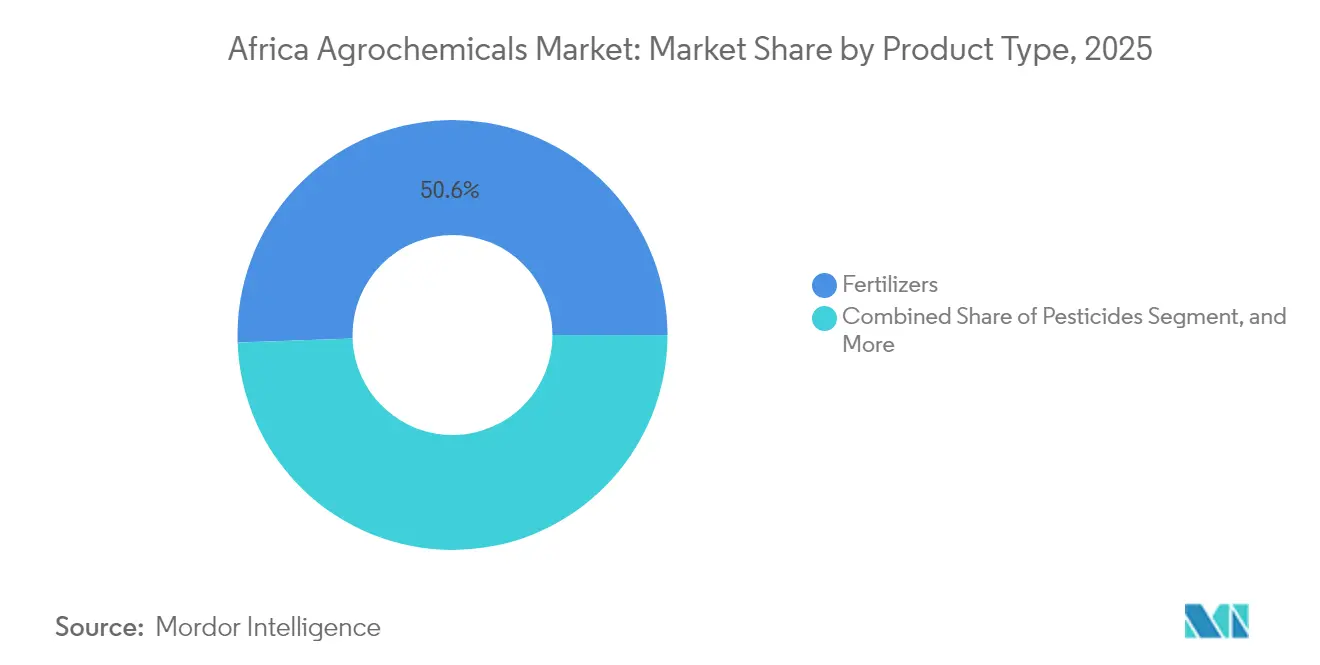
- By product type, fertilizers commanded 50.55% of the Africa agrochemicals market share in 2025, and plant growth regulators posted the highest 6.8% CAGR for 2026-2031.
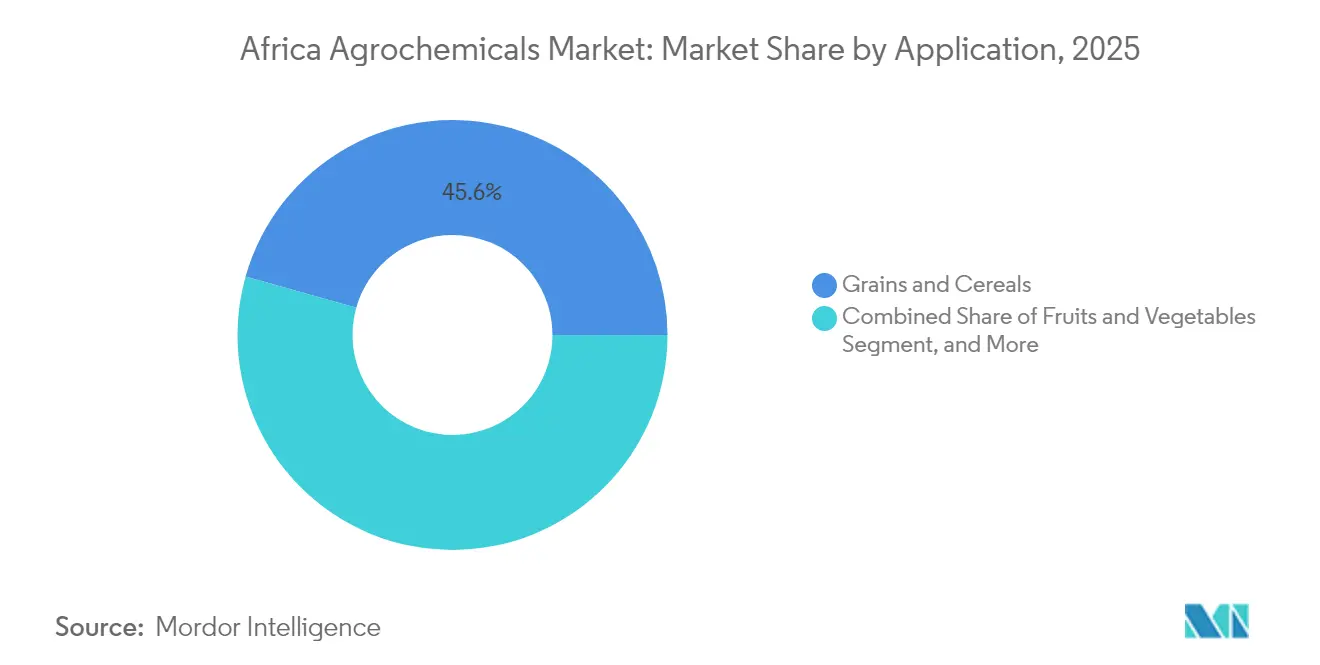
- By application, grains and cereals accounted for a 45.62% share of the Africa agrochemicals market size in 2025, and fruits and vegetables are advancing at a 5.69% CAGR for 2026-2031.
- By geography, South Africa led with an 17.72% revenue share in 2025, while Ethiopia is growing at a 6.49% CAGR to 2031.
- Major Players Bayer AG, BASF SE, Corteva Agriscience, UPL Limited, and Syngenta Group together held 44.2% of the market share in 2024.
Note: Market size and forecast figures in this report are generated using Mordor Intelligence’s proprietary estimation framework, updated with the latest available data and insights as of 2026.
Market Trends and Insights
Drivers Impact Analysis of Africa Agrochemicals Market*
| Driver | (~) % Impact on CAGR Forecast | Geographic Relevance | Impact Timeline |
|---|---|---|---|
| Climate‐driven Rise in Pest and Disease Pressure | +1.2% | East and West Africa | Medium term (2-4 years) |
| Population Growth Accelerating Food-demand Gap | +0.9% | Nigeria, Ethiopia, and Tanzania | Long term (≥ 4 years) |
| Government Subsidy Programs for Fertilizer and Pesticide Adoption | +0.8% | Nigeria, Kenya, Ghana, and Morocco | Short term (≤ 2 years) |
| Mechanization and Precision-ag Adoption Boosting Agrochemical Efficiency | +0.6% | South Africa, Kenya, and Morocco | Medium term (2-4 years) |
| Expansion of Warehouse-receipt Financing Unlocking Working-capital for Inputs | +0.5% | Ghana, Kenya, and Tanzania | Medium term (2-4 years) |
| Emergence of Private-label Agro-retail Chains Improving Last-mile Distribution | +0.4% | Urban-adjacent zones | Short term (≤ 2 years) |
| Source: Mordor Intelligence | |||
Climate‐driven Rise in Pest and Disease Pressure
Variable weather patterns have increased the spread of invasive pests like fall armyworm across multiple African nations, significantly impacting maize yields. Striga weed infestations in cereal-growing regions continue to affect harvests, leading farmers to implement integrated chemical control programs. Kenya, Ghana, and Ethiopia have established emergency response protocols, while regional organizations coordinate pest surveillance networks. Agricultural companies have accelerated the development of precision insecticides targeting pest larvae, and digital monitoring platforms provide real-time alerts to farmers. These factors drive sustained growth in the Africa agrochemicals market. The market gains additional momentum through investments in seed treatment chemicals and farmer education programs. Public-private partnerships are improving farmer access to new crop protection solutions.
Population Growth Accelerating Food-demand Gap
Agricultural productivity remains limited as smallholder farmers use agrochemicals below recommended levels. Nigeria, Ethiopia, and Tanzania experience significant constraints due to urban migration, reducing the agricultural workforce. Government initiatives include investments in domestic fertilizer production and irrigation infrastructure to improve yields. Ethiopia's irrigation expansion program focuses on increasing lowland productivity and decreasing import dependence. Growing food demand continues to drive the African agrochemicals market for fertilizers, pesticides, and plant growth regulator products. The expansion of agricultural dealer networks and mobile advisory services helps improve farmers' access to inputs and knowledge. Farmers increasingly adopt climate-resilient agrochemical solutions to address changing weather conditions.
Government Subsidy Programs for Fertilizer and Pesticide Adoption
Nigeria's Growth Enhancement Support Scheme provided subsidized fertilizer to farmers, while Kenya's Africa Fertilizer Financing Mechanism increased fertilizer access across its farming population. Tanzania implemented a credit guarantee system that facilitated fertilizer trade and improved supply chain efficiency. The implementation of digital e-voucher systems and mobile wallets reduced distribution inefficiencies and shortened delivery times. The 2024 Africa Fertilizer and Soil Health Summit action plan strengthened these initiatives, driving demand in the Africa agrochemicals market. The improved transparency in distribution networks attracted private investment, while the harmonization of regional input standards facilitated cross-border trade.[2]
Expansion of Warehouse-receipt Financing Unlocking Working-capital for Inputs
Ghana, Kenya, and Tanzania operate warehouse-receipt systems that enable farmers to use stored crops as collateral for loans, helping manage cash flow between harvest and planting seasons. Banks accept graded maize, sorghum, and rice as security, providing farmers with funds to purchase crop protection products. This system reduces rural interest rates, increases sales for agricultural agrochemicals retailers, and minimizes post-harvest losses, contributing to consistent growth in the African agrochemicals market.[3] The warehouse-receipt systems enhance price transparency and promote formal market participation among small-scale farmers. Their growing adoption strengthens the connection between farmers, financial services, and agricultural agrochemicals supply chains.
Restraints Impact Analysis of Africa Agrochemicals Market*
| Restraint | (~) % Impact on CAGR Forecast | Geographic Relevance | Impact Timeline |
|---|---|---|---|
| High Agrochemical Prices Unaffordable to Smallholders | -1.1% | Landlocked nations | Short term (≤ 2 years) |
| Fragmented and Stringent Regulatory Approval Timelines | -0.7% | Nigeria, South Africa, Kenya | Medium term (2-4 years) |
| Proliferation of Counterfeit Agrochemicals Eroding Farmer Trust | -0.6% | West and East Africa | Medium term (2-4 years) |
| Organic and Residue-free Export Crop Programs Curbing Synthetic Usage | -0.3% | Morocco, South Africa, Kenya | Long term (≥ 4 years) |
| Source: Mordor Intelligence | |||
High Agrochemical Prices Unaffordable to Smallholders
Transport costs in landlocked countries account for up to 50% of final retail prices, while Ethiopia experienced significant increases in fertilizer prices in recent years. Kenya's proposed 16% VAT on agrochemicals through the 2025 Finance Bill may substantially increase production costs. Nigeria's record-high food inflation in mid-2024 forced households to spend most of their income on food, reducing funds available for farm investments. Farmers often turn to informal lenders charging high weekly interest rates, creating debt cycles that limit growth in the Africa agrochemicals market. The resulting affordability issues reduce the adoption of effective crop protection products, leading to suboptimal yields and continued food security challenges.
Fragmented and Stringent Regulatory Approval Timelines
Extended registration periods of over two years in South Africa and Nigeria, due to outdated pesticide laws and limited institutional capacity, delay the introduction of new agricultural chemicals. The underutilization of regional mutual-recognition frameworks stems from inconsistent data-review procedures among national authorities. These regulatory challenges increase compliance costs, encourage unauthorized imports, and restrict new product launches in the Africa agrochemicals market. The resulting limited competition delays the adoption of environmentally sustainable formulations. Enhanced regulatory efficiency could facilitate regional coordination and improve access to advanced agrochemical solutions.
*Our forecasts treat driver/restraint impacts as directional, not additive. The impact forecasts reflect baseline growth, mix effects, and variable interactions.
Africa Agrochemicals Market Segment Analysis
By Product Type:
Fertilizers Drive Market FoundationFertilizers held 50.55% of the Africa agrochemicals market share in 2025, addressing widespread soil nutrient deficiencies and supporting agricultural productivity across various agroecological zones. Nitrogen-based formulations remain essential for cereal production, while phosphatic and potassic fertilizers gain adoption through balanced nutrition programs. Digital subsidy e-vouchers and warehouse-receipt credit systems reduce financial barriers and enable timely fertilizer application.
Plant growth regulators demonstrate a 6.8% CAGR, driven by increased adoption of nutrients that improve stress tolerance, root development, and yield potential. Pesticides maintain significant volume across Africa, with herbicides dominating due to labor shortages and resistant weed populations. Insecticide demand increases in response to climate-related pest outbreaks, while fungicide use expands in horticultural regions. Adjuvants, though a smaller segment, grow in importance as precision spraying equipment requires advanced formulations for improved leaf coverage and simplified tank mixing.

By Application:
Grains and Cereals Anchor DemandGrains and cereals represented 45.62% of the Africa agrochemicals market size in 2025, reflecting their importance in food security and rural economies. Fertilizer and herbicide use concentrates in maize and sorghum production areas, supported by government mechanization programs and climate insurance schemes. Pulses and oilseeds integration into crop rotations provides farmers with income diversification while enhancing soil fertility through nitrogen fixation, supporting balanced fertilizer use.
The fruits and vegetables segment, growing at 5.69% CAGR, transforms peri-urban supply chains and increases demand for precision insecticides and specialty foliar nutrients. Export markets require compliance with residue-free standards, driving adoption of environmentally compatible agrochemicals. Premium pricing for quality produce encourages controlled-environment agriculture and drip-fertigation systems. Commercial crops, including sugarcane and cotton, maintain consistent pesticide demand through large-scale farming and organized procurement systems, highlighting agrochemicals' importance across different cultivation methods.
Geography Analysis
South Africa Agrochemicals Market
South Africa contributed 17.72% of Africa's agrochemicals market share in 2025, supported by advanced logistics networks, research extension services, and credit systems. Following drought-related declines in 2024, improved reservoir levels and stable power supply are enhancing horticultural prospects for 2025, driving increased fertilizer and pesticide demand. The potato sector demonstrates successful input optimization, achieving improvements in production and exports. However, outdated pesticide regulations delay new product registrations, though planned regulatory updates may accelerate innovation adoption.
Ethiopia Agrochemicals Market
Ethiopia exhibits the highest growth rate in Africa's agrochemicals market at 6.49% CAGR, supported by government initiatives for fertilizer independence through strategic partnerships and local ammonia production. The Grand Ethiopian Renaissance Dam's irrigation projects are expanding lowland agricultural capabilities. The agricultural sector's significance in Ethiopia's economy and employment drives sustained public investment in agrochemical accessibility. Improvements in infrastructure and multilateral funding support are reducing operational costs and expanding market coverage.
Africa Agrochemicals Market
West and North African markets show varying performance based on natural resources and regulatory frameworks. Nigeria maintains its position as the continent's largest market, supported by private sector growth and industrial fertilizer production. Morocco utilizes its phosphate resources through environmental investment programs, supplying blended fertilizers to West African markets. Kenya, Tanzania, and Ghana are developing digital agricultural credit and warehouse systems to enhance agrochemical accessibility, while Egypt and Algeria are testing green ammonia production for sustainable fertilizers. DR Congo and Zambia show growth potential, dependent on infrastructure improvements and regulatory consistency.
Regulatory Landscape
Agrochemical registration and use in Africa are handled by national authorities, but Regional Economic Communities (RECs) increasingly shape pesticide management through harmonized, risk-based approaches aimed at reducing unsafe trade and improving compliance. One anchor is ECOWAS Regulation C/REG.3/05/2008, which provides a regional framework for pesticide registration and circulation, alongside Sahel-focused regional registration approaches under CILSS and pesticide-management guidance initiatives in SADC and the EAC.
Across RECs, regulators are aligning decision-making with international standards and obligations, including FAO/WHO pesticide management guidance, Codex Alimentarius Maximum Residue Limits (MRLs), and the Rotterdam and Stockholm Conventions. The EAC has also published shared pesticide registration data requirements to support mutual recognition and streamline submissions across partner states, and technical tools such as the FAO Pesticide Registration Toolkit are used to strengthen science-based evaluations. Policy discussions additionally cover the identification and phase-out of Highly Hazardous Pesticides (HHPs), supported by multi-stakeholder capacity-building programs, including regional workstreams under ACP-MEAs 3.
Competitive Landscape
Market concentration is moderate, with the top five companies holding nearly half of the Africa agrochemicals market share, indicating growth for regional specialists and start-ups to innovate and scale. Bayer AG has strengthened its position as a market leader through strategic investments in agrochemical infrastructure, advancing the availability of innovative crop protection solutions across Africa. Syngenta Group applies AI-driven crop trait discovery through its partnership with InstaDeep’s AgroNT1 model, accelerating breeding cycles and aligning with climate resilience goals.
UPL Limited maintains a strong presence through its Natural Plant Protection line and regional partnerships that introduced new insecticide formulations in 2024. Corteva Agriscience and BASF SE continue to tailor growth regulator and herbicide solutions to African climatic conditions, while FMC leverages its proprietary diamide platform to address lepidopteran pest challenges in maize-growing regions. Local innovators like Apollo Agriculture in Kenya integrate fintech and agronomy to reach smallholders directly, capturing last-mile margins often missed by multinational firms.
Strategic investments increasingly emphasize precision and minimal/no-residue pesticides, carbon-efficient fertilizers, and digital advisory platforms. Cross-industry collaborations with telecom and fintech companies are improving farmer onboarding, payment collection, and agrochemical traceability. Insurance tie-ins are helping reduce default risk, making agrochemical financing more viable for lenders and suppliers. While global players continue to consolidate for market depth, antitrust oversight, and localization requirements are preserving competitive dynamics within the Africa agrochemicals market.
Africa Agrochemicals Industry Leaders
-
BASF SE
-
Syngenta Group
-
Bayer AG
-
Corteva Agriscience
-
UPL Limited
- *Disclaimer: Major Players sorted in no particular order
Africa Agrochemicals Market Companies Covered in this Report
- Bayer AG
- Syngenta Group
- Corteva Agriscience
- BASF SE
- FMC Corporation
- UPL Limited
- Yara International ASA
- Sumitomo Chemical Co., Ltd.
- Gowan Company (Isagro S.r.l.)
- Rovensa S.A (Partners Group)
- Sasol Limited
- Twiga Chemical Industries Ltd. (AJ Group)
- OCP Group
- Indorama Corporation
- Albaugh LLC
Market Opportunities and Future Outlook
Fertilizer import substitution and supply security are central investment themes, creating room for local manufacturing, blending, and logistics that can improve input availability and affordability for smallholders. The evidence base includes named capacity and financing programs: Dangote Group has disclosed a planned fertilizer complex in Gode, Ethiopia, with total planned investment exceeding USD 4 billion, and Dangote Group and Africa Finance Corporation (AFC) signed a USD 600 million financing agreement tied to expanding Nigerian fertilizer capacity while also supporting the Ethiopian project. Separately, NEXTCHEM (Maire) secured a EUR 485 million contract (March 2026) to provide licensing and proprietary technologies for three nitrogen fertilizer complexes in West Africa, reinforcing a pipeline of new industrial assets that can shift regional sourcing and distribution for nitrogen and downstream blends.
On crop protection, harmonized plant-health systems and digital phytosanitary tools are widening the addressable market for compliant products and more traceable distribution. The Plant Health Strategy for Africa 2022-2036 and the Africa Phytosanitary Programme (APP) provide a defined mechanism, with APP phase 3 launched in July 2026 to expand digital phytosanitary tool adoption to 38 countries. This supports pairing compliant product portfolios with advisory, stewardship, and last-mile traceability. Government programs also shape usage guidance, such as Kenya's NAVCDP Integrated Pests Management framework, which supports training and guidance for stockists and farmers. Technology-led precision application remains another route to commercialization, with documented use of AI-enabled diagnostics and drone-based scouting in Ghana, alongside smallholder decision-support platforms that connect pest detection to targeted interventions, provided connectivity and power constraints are addressed.
Recent Industry Developments in Africa Agrochemicals Market
- April 2026: Bayer and the International Institute of Tropical Agriculture (IITA) announced a research partnership that includes USD 1.2 million in in-kind support through 2028 to develop climate-resilient, high-yielding, nutrient-dense crops for smallholders in sub-Saharan Africa. The collaboration links seed and agronomy innovation to on-farm productivity outcomes, strengthening pull-through demand for crop protection and plant nutrition programs tied to improved varieties.
- August 2024: BASF and Syngenta collaborated with Kenya's Pest Control Products Board (PCPB) and the International Center for PPE (ICPPE) to launch the country's first locally manufactured ISO 27065-certified personal protective equipment (PPE) for farmers. Local PPE availability supports stewardship and safer handling practices, which can improve compliance and adoption for regulated crop protection products across organized retail channels.
- February 2024: BASF launched Priaxor EC fungicide in Ethiopia for the control of fungal diseases in wheat and barley. The launch broadens access to branded fungicide solutions in a key cereals market, supporting higher-intensity crop protection programs as farmers respond to disease pressure and seek yield stability.
Africa Agrochemicals Market Report Scope and Research Methodology
Market Definition and Coverage
For this study, the Africa agrochemicals market is defined as the value of crop input chemicals used in farming across Africa, covering fertilizers, pesticides, adjuvants, and plant growth regulators applied to improve yield, quality, and crop protection.
Scope exclusions: It does not count farm equipment, irrigation systems, seeds, or broader agricultural services that sit outside chemical inputs.
Segments Covered in This Report
- By Product Type
- Fertilizers
- Nitrogenous
- Phosphatic
- Potassic
- Pesticides
- Herbicides
- Insecticides
- Fungicides
- Adjuvants
- Plant Growth Regulators
- Fertilizers
- By Application
- Grains and Cereals
- Pulses and Oilseeds
- Fruits and Vegetables
- Commercial Crops (Sugarcane, Cotton, and Others)
- By Geography
- Egypt
- Morocco
- Algeria
- Kenya
- Tanzania
- Ethiopia
- South Africa
- Zambia
- Zimbabwe
- Nigeria
- Ghana
- DR Congo
- Rest of Africa
Data Sources, Market Sizing, and Validation
Desk Research
Desk research was used to build the starting frame for demand and supply, then cross-check year-to-year realism. We relied on public datasets and publications such as FAOSTAT for crop area and production, World Bank indicators for macro drivers, UN Comtrade for trade flows of fertilizers and key pesticide classes, and country agriculture ministry and regulator updates for subsidy programs and registration direction. Where needed, we also used sources such as AfricaFertilizer.org for fertilizer consumption context, along with peer-reviewed agronomy journals to understand usage patterns by crop and climate zone.
To convert these signals into a value view, we stitched together pricing direction from public news, company annual reports, and investor presentations, and we used import or export unit values where they were usable. In addition, we referenced a paid subscription for company financials and a separate paid import and export shipment-level database to sanity-check large jumps in volumes and supplier mix in select corridors. The desk research sources listed here are illustrative only, and many other public documents were also reviewed for data collection, validation, and clarification.
Primary Interviews and Surveys
Primary work focused on interviews and structured surveys with manufacturers, regional distributors, large growers, and agronomists, so desk assumptions on application intensity and channel pricing could be corrected. Because Africa has wide differences in crop mix and import dependency, we balanced coverage across export markets supplying Africa and the main African demand hubs, and then adjusted using in-country feedback on seasonality, subsidy timing, and product substitution.
Distribution of primary research fieldwork respondents
| Company type | Respondent position |
|---|---|
| Top tier: 26% | CXOs: 15% |
| Mid tier: 55% | Functional/Unit leaders: 36% |
| Smaller Players: 19% | Managers: 49% |
Market-Sizing & Forecasting
Sizing starts from a top-down demand pool build based on crop area and crop production by key groups, which is then converted into agrochemical value using indicative application rates and price bands by product class. To keep the math realistic, a few inputs are tracked closely, including planted area shifts across grains, oilseeds, fruits and vegetables, pest and disease pressure seasons, subsidy and credit availability, import dependency for actives and finished products, and USD-linked price pass-through in local currency markets.
The totals are then corroborated with selective bottom-up checks, such as rolling up a sample of supplier and importer revenues, distributor channel checks, and an ASP times volume sense-check for fertilizers and major pesticide categories where the data is clearer. When direct inputs are missing for smaller countries, we fill gaps using proxy crop patterns, trade signals, and expert-set penetration ranges, and then test whether the implied per-hectare spending stays within expected bounds.
For forecasting, we primarily use scenario analysis, because weather variability, FX movement, and subsidy policy can change demand timing even when the long-term trend stays steady. The forward view is anchored to expected crop area and yield improvement direction, with price progression shaped by input cost outlook and validated by primary feedback on purchasing behavior and product mix shifts.
Data Validation & Update Cycle
Validation is done in layers so the final number does not depend on one dataset or one assumption. Model outputs are compared against independent signals such as trade direction, reported fertilizer consumption context, and company commentary on Africa volumes and pricing, and then anomalies are reviewed until the drivers are clear. If a country or product line shows an unusual spike, we re-check unit values, FX conversion timing, and whether a one-off tender or subsidy release created a short-term pull-in.
Each report goes through multi-step analyst review before sign-off, followed by an annual refresh, with interim updates made when material events occur. Before delivery, a last pass is completed to ensure the latest policy changes, commodity direction, and major pricing moves are reflected in the final tables and narrative.
Mordor Intelligence's Africa Agrochemicals Market Size Compared With Other Published Estimates
It is normal to see different market sizes published for Africa agrochemicals, even when the topic sounds identical. The differences usually come from timing choices, what is counted inside agrochemicals, and how value is built when local pricing is volatile.
In this market, refresh cadence and currency handling drive a large part of the spread, because imports, subsidy timing, and in-season pricing resets can move the USD value without a matching shift in physical usage. By re-checking ASP progression using recent trade unit values and channel feedback before locking the base year, then applying the same conversion timing across countries, Mordor Intelligence reduces double counting from mixed retail and import price points.
Benchmark comparison
| Source | Market Size | Gaps in Research Methodology |
|---|---|---|
| Mordor Intelligence | USD 11.70 B (2025) | |
| Industry Data Platform A | USD 8.05 B (2025) | Often reflects a narrower value capture tied closer to reported trade and a conservative pricing layer, which can understate in-country channel markups and non-imported supply in years with subsidy-led distribution. |
| Global Consultancy B | USD 7.68 B (2024) | Uses an earlier base year and a higher-growth forward curve, and differences can also come from how retail pricing versus importer pricing is applied when converting volumes into USD across multiple currencies. |
The table shows that timing and value build choices can change the headline number more than the underlying farm demand trend. When scope is kept consistent and price logic is tied back to observable trade and channel signals, the resulting market size becomes easier to trace, explain, and update year after year.
Key Questions Answered in the Report
What is the 2026 value of the Africa agrochemicals market?
The market is valued at USD 12.21 billion in 2026.
How fast will the market grow through 2031?
It will expand at a 4.32% CAGR, reaching USD 15.08 billion.
Which product type currently dominates the market?
Fertilizers lead with a 50.55% share.
Which country is growing the fastest?
Ethiopia posts the highest 6.49% CAGR to 2031.
What key restraint limits adoption?
High input prices, especially in landlocked states, reduce smallholder uptake.
How concentrated is the competitive landscape?
The top five firms hold 44.2% share, indicating moderate concentration.