
Aesthetic Fillers Market Size and Share
Market Overview
| Study Period | 2021 - 2032 |
|---|---|
| Market Size (2027) | USD 3.96 Billion |
| Market Size (2032) | USD 5.51 Billion |
| Growth Rate (2027 - 2032) | 6.83 % |
| Fastest Growing Market | Asia Pacific |
| Largest Market | North America |
| Market Concentration | Medium |
Major Players *Disclaimer: Major Players sorted in no particular order Image © Mordor Intelligence. Reuse requires attribution under CC BY 4.0. | |
Aesthetic Fillers Market Analysis by Mordor Intelligence
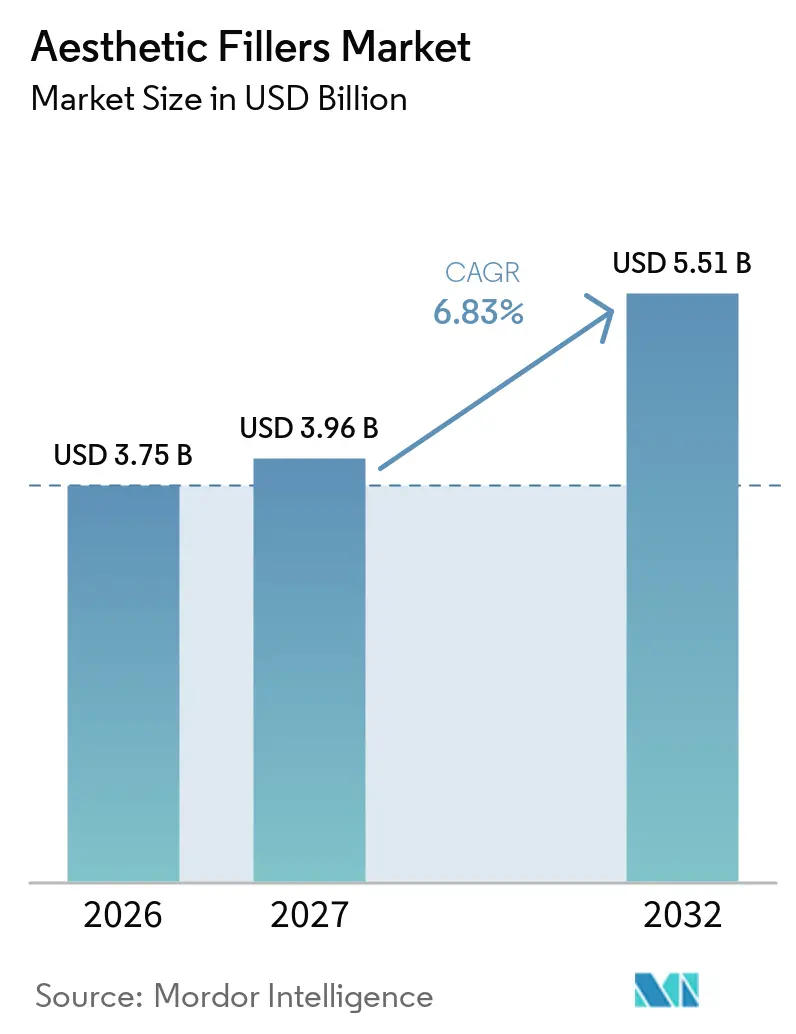
The Aesthetic Fillers Market size is expected to grow from USD 3.75 billion in 2026 to USD 3.96 billion in 2027 and is forecast to reach USD 5.51 billion by 2032 at 6.83% CAGR over 2027-2032.
Accelerated consumer pivot toward minimally invasive rejuvenation, a surge in AI-guided injection planning, and fast-rising male participation are expanding the addressable base and shortening treatment cycles. U.S. physicians now perform 5.3 million hyaluronic-acid filler sessions annually, signaling that injectables have moved from episodic cosmetic events to routine self-care.[1] Regenerative formulations blending stem-cell exosomes with traditional polymers promise longer-lasting volume and higher patient lifetime value, while the FDA’s vigilance on adverse-event clusters is elevating compliance costs for manufacturers.[2] Competitive dynamics are intensifying as Asian entrants deploy low-cost fermentation-derived HA and direct-to-clinic logistics to undercut Western brands, even as gray-market proliferation threatens patient safety and premium pricing.
Key Report Takeaways
- By material, hyaluronic acid led with 62.57% of the aesthetic filler market share in 2026, while poly-L-lactic acid is projected to post a 10.53% CAGR through 2032.
- By application, facial line correction held 44.72% of revenue in 2026; facial contouring and volume restoration is advancing at a 9.25% CAGR to 2032.
- By end user, dermatology and cosmetic surgery clinics captured 44.11% of 2026 sales, whereas medical spas and beauty clinics are expected to expand at an 8.62% CAGR over the forecast period.
- By gender, female patients accounted for 81.46% of injections in 2026, and male demand is rising at an 8.24% CAGR through 2032.
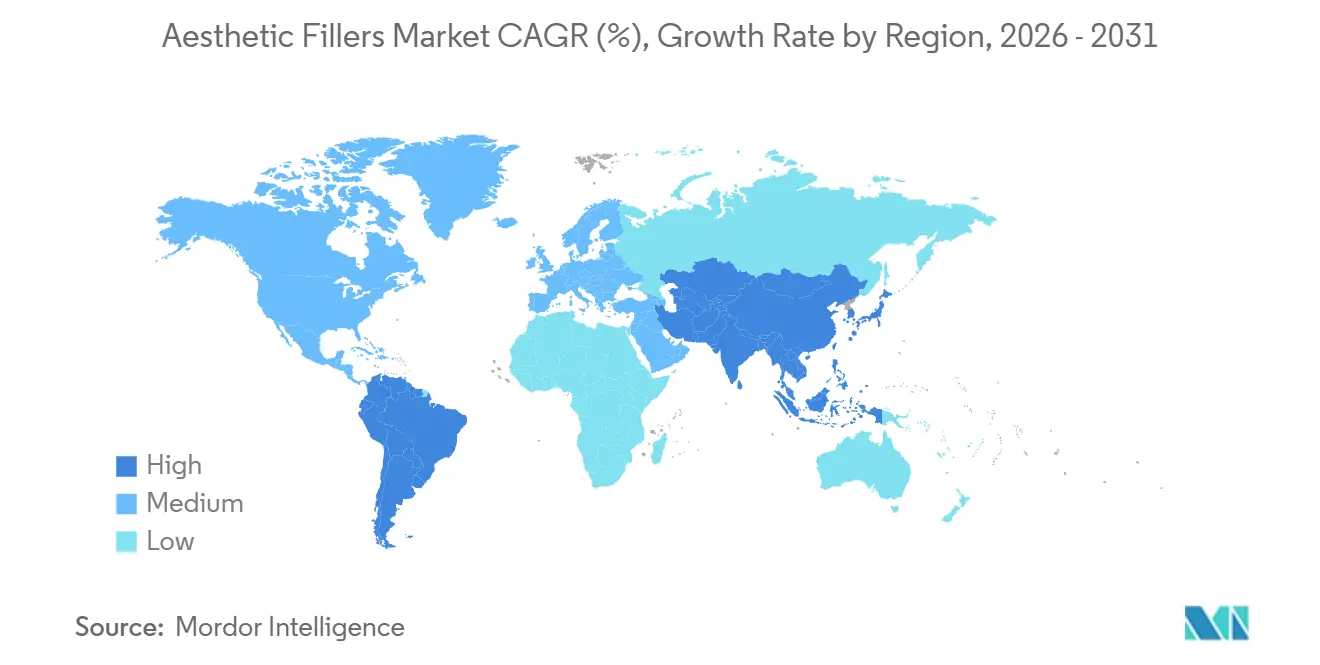
- By geography, North America generated 34.83% of global revenue in 2026; Asia-Pacific is forecast to grow fastest at a 9.04% CAGR to 2032.
Note: Market numbers in this report are based on Mordor Intelligence's proprietary estimation framework, which combines nine months of actuals with Q4 projections for base year 2026.
Market Trends and Insights
Drivers Impact Analysis of Aesthetic Fillers Market*
| Driver | (~) % Impact on CAGR Forecast | Geographic Relevance | Impact Timeline |
|---|---|---|---|
| Rising Demand for Minimally Invasive Cosmetic Procedures | +1.8% | North America, Europe, urban Asia-Pacific | Medium term (2-4 years) |
| Aging Population Seeking Anti-Ageing Solutions | +1.5% | Japan, South Korea, Western Europe, North America | Long term (≥ 4 years) |
| Growing Disposable Incomes in Emerging Economies | +1.2% | China, India, Southeast Asia, GCC, Brazil, Mexico | Medium term (2-4 years) |
| Regenerative-Medicine Fillers with Stem-Cell Matrices | +0.9% | North America, Europe, South Korea, Japan | Long term (≥ 4 years) |
| Male-Focused Aesthetic Marketing | +0.7% | United States, United Kingdom, South Korea, urban China | Medium term (2-4 years) |
| AI-Assisted Injection Planning & 3D Analytics | +0.6% | North America, Europe, South Korea, Japan, Singapore | Short term (≤ 2 years) |
| Source: Mordor Intelligence | |||
Rising Demand for Minimally Invasive Cosmetic Procedures
Practitioners and patients favor fillers over surgical facelifts because downtime drops from weeks to hours, a trade-off that resonates when work and social calendars leave little recovery space. Millennials and Gen Z seek preventive volumization in their late twenties, expanding lifetime treatment cycles and smoothing clinic revenue. FDA pre-market approvals create a quality floor, yet enforcement gaps allow gray-market syringes to persist online. Technology-driven consultation tools reduce chair time and help practices scale volume without proportionate labor increases. Collectively, these forces keep the aesthetic filler market on a double-digit procedure-growth trajectory even when macroeconomics soften discretionary budgets.
Aging Population Seeking Anti-Ageing Solutions
Japan’s health ministry projects that 31% of its residents will be 65 or older by 2030, and similar demographic inversion is unfolding in Western Europe. Older consumers use facial fillers to align appearance with extended careers and active retirement lifestyles. Poly-L-lactic acid attracts this cohort because it triggers collagen synthesis lasting up to 24 months, outpacing HA’s durability.[3] Pension assets cushion out-of-pocket spending, while social acceptance of “aging well” lowers stigma. Clinics exploit this demand with bundled annual maintenance plans that lock in repeat visits and stable cash flow.
Growing Disposable Incomes in Emerging Economies
The Chinese regulator approved multiple domestic HA brands in 2025, cutting syringe prices by roughly 30% and widening access. India and Southeast Asia see similar middle-class expansions, although supply bottlenecks and uneven enforcement slow market maturity. Saudi Arabia and the UAE court medical tourists with luxury filler-and-spa packages, knitting injectables into broader hospitality revenue. Latin America, led by Brazil, benefits from cultural acceptance of cosmetic enhancement and a dense dermatologist network, even as currency swings periodically dent volume. Combined, these regions inject momentum into the global aesthetic filler market.
Regenerative-Medicine Fillers with Stem-Cell Matrices Gaining Traction
A 2024 trial showed that exosome-enriched HA raised dermal thickness by 18% at six months versus HA-only controls, catalyzing Phase II studies at Revance and peer biotechs. By recruiting the body’s repair pathways, regenerative fillers aim to stretch treatment intervals to two years, a consumer value proposition that could reset pricing power. Regulatory hurdles remain steep because the FDA treats cell-derived components as biologics, demanding GMP-grade manufacturing proof. Early adopters in South Korea and Japan bundle these fillers with autologous fat transfer, positioning the service as both aesthetic and anti-ageing therapy. Commercial scale will hinge on consistent cell-processing protocols and payer attitudes toward biologic pricing.
Restraints Impact Analysis of Aesthetic Fillers Market*
| Restraint | (~) % Impact on CAGR Forecast | Geographic Relevance | Impact Timeline |
|---|---|---|---|
| Adverse Events & Stricter Regulatory Scrutiny | -0.9% | North America, Europe, select Asia-Pacific markets | Short term (≤ 2 years) |
| High Procedure Costs in Price-Sensitive Markets | -0.6% | India, Southeast Asia, Latin America (ex-Brazil), Sub-Saharan Africa | Medium term (2-4 years) |
| Supply-Chain Risk for HA Raw Materials | -0.5% | North America, Europe | Medium term (2-4 years) |
| Proliferation of Counterfeit & Gray-Market Fillers | -0.7% | Global e-commerce, tourism hubs | Short term (≤ 2 years) |
| Source: Mordor Intelligence | |||
Adverse Events & Stricter Regulatory Scrutiny
Vascular occlusion remains the gravest filler complication; 58% of affected patients lose vision permanently, prompting FDA safety communications and EU annual safety-report mandates. National seizures of counterfeit vials reached 4,700 in the United Kingdom by August 2025. Compliance costs escalate as manufacturers submit real-world performance data and fund practitioner-training grants. Small brands without regulatory teams face margin compression, nudging market consolidation.
High Procedure Costs in Price-Sensitive Markets
A single HA syringe costs USD 500-1,200 in developed economies, far above average monthly wages in India and parts of Latin America. Financing plans exist but carry double-digit interest, deterring younger clients. Domestic Chinese and Korean brands shave costs but fight perception that low price equals low safety. Economic slowdowns produce immediate volume drops because insurance rarely covers cosmetic injectables.
*Our forecasts treat driver/restraint impacts as directional, not additive. The impact forecasts reflect baseline growth, mix effects, and variable interactions.
Aesthetic Fillers Market Segment Analysis
By Material:
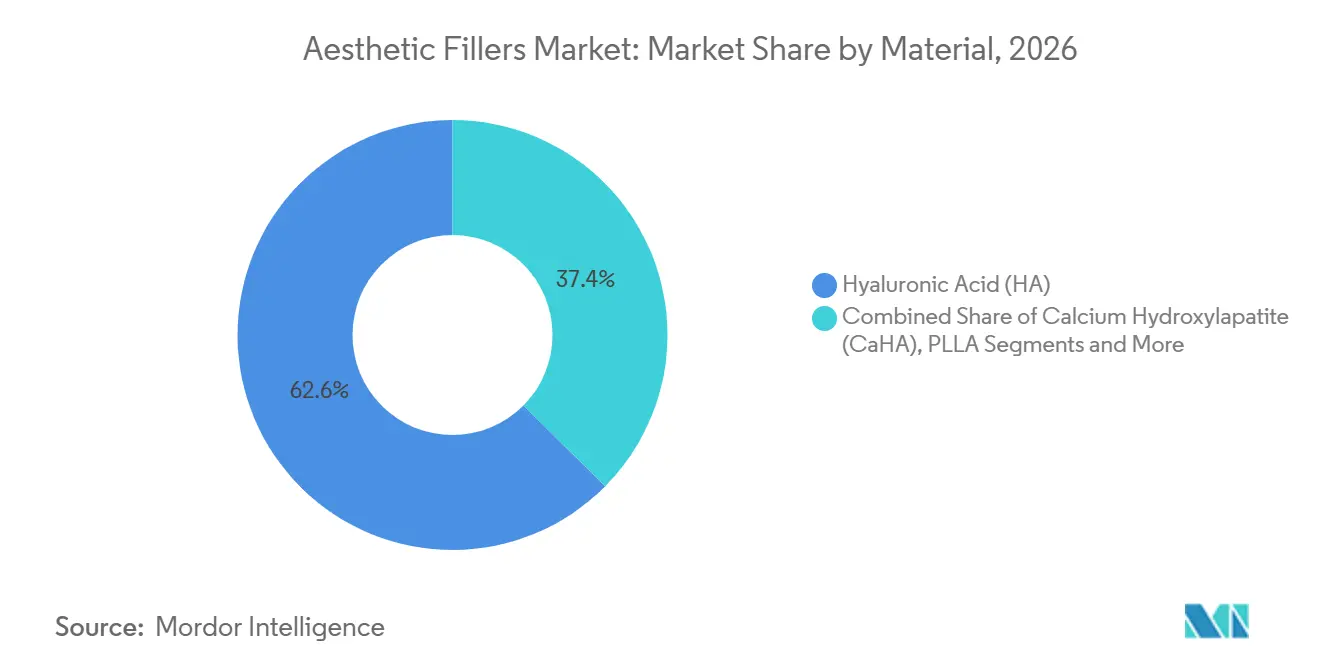
HA Dominance Meets Biostimulatory InnovationHyaluronic acid captured 62.57% of the aesthetic filler market share in 2026 owing to reversibility and broad indications. Poly-L-lactic acid leads growth at a 10.53% CAGR, buoyed by Galderma’s 2024 Sculptra acquisition and clinical proof of 24-month collagen stimulation. Calcium hydroxylapatite enjoys renewed interest in hyper-dilute protocols for skin quality, while PMMA remains niche due to permanence risks.
Regenerative blends that add stem-cell exosomes to HA promise to extend the aesthetic filler market size for premium biostimulatory offerings. FDA biologic classification hikes regulatory hurdles, yet early South Korean adopters report higher patient retention. Self-cross-linked HA removes BDDE but requires rigorous batch control. Material-choice diversity widens practitioner toolkits and cushions market growth against any single polymer’s regulatory shock.

By Application:
Contouring Overtakes Line CorrectionFacial line correction held 44.72% of 2026 revenue, but contouring and volume restoration is growing at 9.25% CAGR as millennials seek preventive structure in the aesthetic filler market. Lip enhancement remains visible, although subtle reshaping replaces earlier dramatic trends.
Liquid facelift protocols that deploy multiple syringes across cheeks, jawline, and temples raise per-visit spend, pushing up the aesthetic filler market size per patient episode. FDA approval of under-eye formulas opened a challenging yet lucrative anatomical niche. Off-label nose and chin sculpting expands use cases but demands advanced anatomy skills to avoid vascular events.
By End User:
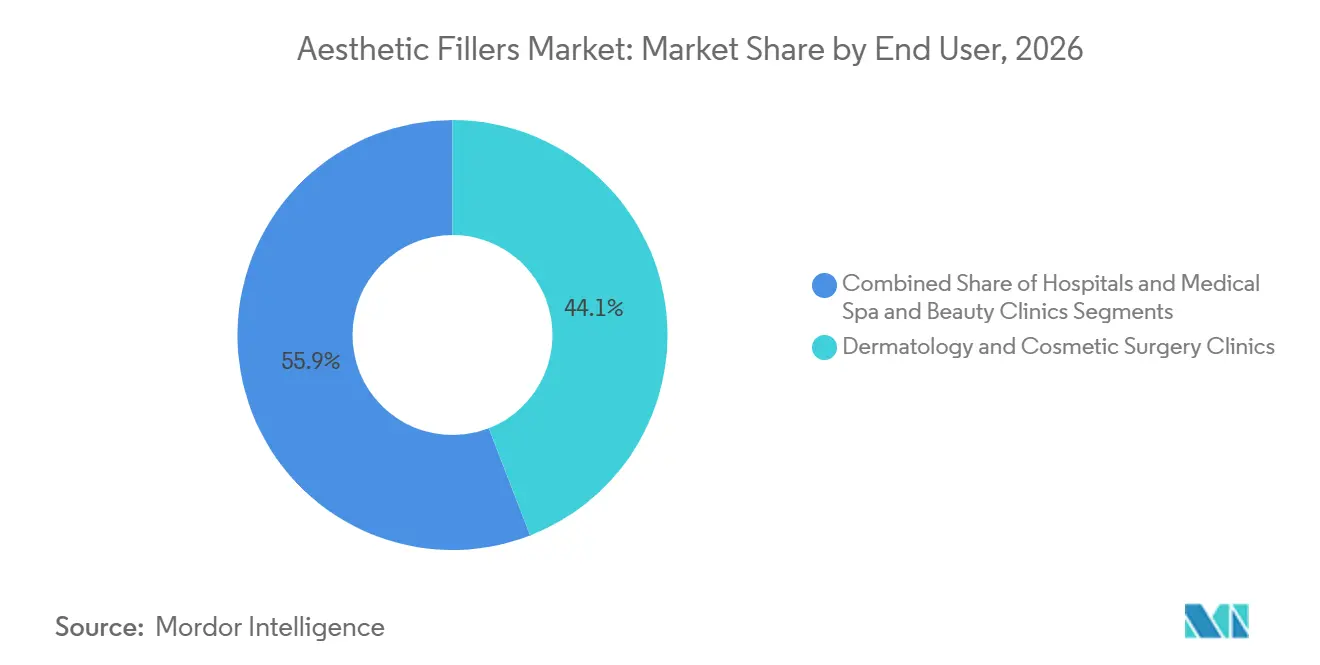
Medical Spas Disrupt Traditional ClinicsDermatology and cosmetic surgery clinics owned 44.11% of 2026 sales, yet medical spas and beauty clinics are advancing at an 8.62% CAGR, leveraging hospitality aesthetics and retail convenience. Variable physician-supervision laws in the United States let some facilities operate with remote oversight, cutting overhead.
Hospitals play a marginal role outside reconstructive indications, so the aesthetic filler market shifts toward boutique, experience-driven settings. Rising adverse events in loosely regulated spas have spurred professional societies to demand standardized injector credentials. Nonetheless, consumer appetite for comfort and flexibility keeps the channel on a steep climb.
By Gender:
Male Segment Closes the GapWomen represented 81.46% of procedures in 2026, but male uptake is climbing at 8.24% CAGR, narrowing the gap. Executive wellness programs, influencer normalization, and performance-oriented marketing reshape perceptions. Men prioritize subtle jaw and tear-trough corrections and prefer lower-viscosity gels.
Cultural resistance persists in conservative regions, yet urban professionals under 40 treat fillers like fitness or tailored suits. Manufacturers tailor viscosity and packaging aesthetics to masculine preferences, reinforcing growth and contributing incremental gains to the aesthetic filler market size.
Geography Analysis
North America Aesthetic Fillers Market
North America generated 34.83% of global revenue in 2025, underpinned by robust per-capita spend, broad FDA approvals, and 5.3 million HA sessions logged in 2024. Canada mirrors U.S. pathways but varies injector scope by province. Mexico draws cost-conscious U.S. tourists, although counterfeit risks temper volumes. Ongoing FDA e-commerce crackdowns highlight enforcement gaps in cross-border sales.
APAC Aesthetic Fillers Market
Asia-Pacific is projected to grow at 9.04% CAGR, led by China’s domestic-brand approvals that slice syringe prices by 30%. South Korea funnels medical tourists into AI-enabled 3D scanning clinics, while Japan’s aging demographics sustain premium collagen-induction demand despite cultural caution. India’s Central Drugs Standard Control Organisation is modernizing trials, yet income disparity limits conversion rates. Australia’s tight post-market surveillance positions it as a regional quality gatekeeper.
Europe, Middle East and LATAM Aesthetic Fillers Market
Europe shows steady but slower growth as the EMA intensifies post-market reporting. Germany, France, and the United Kingdom anchor demand, backed by partial reimbursement for reconstructive uses. The UK regulator seized 4,700 counterfeit vials by August 2025, illustrating the region’s vigilance. In the Middle East, Saudi Arabia and the UAE leverage Vision 2030 tourism strategies to bundle fillers with luxury services. Latin America remains dominated by Brazil’s culturally normalized filler culture, while Argentina and Chile face macro-volatility headwinds.
Regulatory Landscape
In the United States, the FDA regulates dermal fillers as medical devices and requires premarket review for specific indications. For example, in February 2025 the agency approved Symatese's EVOLYSSE SMOOTH and EVOLYSSE FORM (P240022), underscoring how clinical evidence and defined contraindications support commercialization. In Europe, Regulation (EU) 2017/745 (MDR) governs dermal fillers, including certain aesthetic products without a medical purpose listed under Annex XVI, which brings CE marking, Common Specifications compliance, and heightened surveillance expectations into scope (as reflected in the MDR consolidation effective January 2026 and related MDCG guidance).
The United Kingdom is tightening oversight of higher-risk cosmetic procedures. The Medical Devices (Amendment) (Great Britain) Regulations 2025 are in force from May 24, 2025, and the August 2025 government priority targets restricting the highest-risk cosmetic filler uses in sensitive areas. This raises the compliance bar for suppliers and providers operating across channels such as medical spas.
Value Chain Analysis
The aesthetic filler value chain starts with upstream biopolymer inputs (notably fermentation-derived hyaluronic acid), cross-linking chemistries and excipients, then moves into GMP manufacturing, aseptic filling, sterilization, and lot release testing, before reaching dermatology and cosmetic surgery clinics and the fast-growing medical spa channel. Regulatory requirements, including FDA device controls and EU MDR Annex XVI pathways for certain no-medical-purpose aesthetic products, extend quality-system demands into raw material qualification and batch documentation. That, in turn, lengthens planning horizons for validated supply and inventory.
Downstream, suppliers increasingly pair product supply with physician education, injector credentialing, and clinic enablement tools to reduce adverse events and protect brand equity amid counterfeit and gray-market risk. Anti-tamper packaging and traceability features add incremental steps and cost. Channel structure continues to shift as manufacturers and regional players expand direct-to-clinic models in select markets to control pricing, authenticity, and training adherence, while traditional distributors remain important for reach and logistics in fragmented geographies.
Competitive Landscape
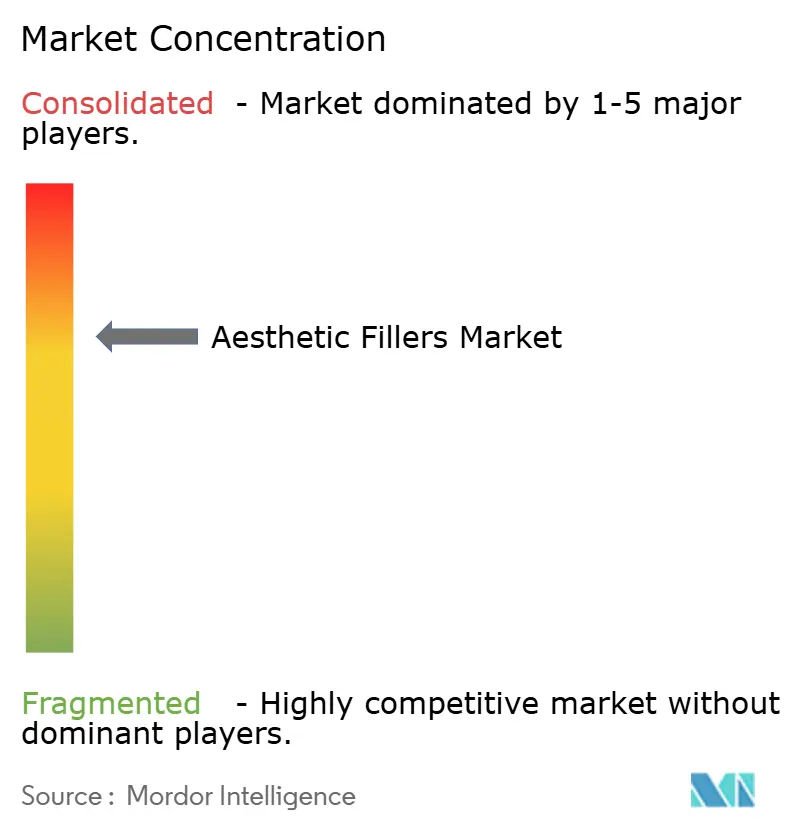
AbbVie’s Allergan Aesthetics, Galderma, and Merz Pharma collectively control major share of revenue, positioning the aesthetic filler market as moderately concentrated. Galderma’s CHF 2.2 billion IPO in 2024 funds geographic expansion and product acquisitions like Sculptra. Allergan’s Juvéderm portfolio spans eight SKUs, fortified by loyalty programs that offer rebates and certified-training modules. Merz differentiates with Radiesse hyper-dilute protocols and a double-purified neurotoxin.
Asian entrants such as Bloomage, Huons, and Croma-Pharma lean on cost advantage and direct-to-clinic distribution, appealing to price-sensitive spas. Revance’s 2024 Opul buyout signals a push toward bundled neuromodulator-and-filler packages. Technology adoption now separates leaders from laggards: AI planning tools and blockchain traceability win clinic mindshare and reduce counterfeit risk, yet uptake varies by capital availability.
Aesthetic Fillers Industry Leaders
-
Galderma
-
AbbVie Inc.
-
Merz Pharma
-
Ipsen
-
Revance Therapeutics
- *Disclaimer: Major Players sorted in no particular order
Aesthetic Fillers Market Companies Covered in this Report
- AbbVie (Allergan Aesthetics)
- Anika Therapeutics
- Bloomage Biotechnology
- Croma-Pharma
- Evolus Inc.
- Filorga
- Galderma
- Huadong Medicine (Bohus)
- Hugel Inc
- Huons Bio
- Ipsen
- LG Chem
- Merz Pharma
- Prollenium Medical
- Revance Therapeutics
- Shanghai Rhong
- Sinclair Pharma
- Suneva Medical
- Teoxane Laboratories
- Zhejiang Jingjia Medical
Market Opportunities and Future Outlook
Indication expansion and geography-specific portfolio launches are a direct pathway to broaden procedure demand and diversify revenue per patient visit, especially when regulators open new treatment areas or product generations. Recent approvals point to this whitespace: in June 2026, the FDA approved SKINVIVE by JUVEDERM for improvement of neck appearance, and Galderma secured U.S. approval for Restylane Contour for temple hollowing. Together, they show continued monetization of anatomically challenging or previously off-label zones through formal labeling and training.
Technology-enabled practice workflows also create monetizable headroom beyond gel chemistry, as clinics scale volume and regulators and professional bodies scrutinize outcomes. AI-assisted facial analytics and injection planning tools are moving from development toward use in aesthetic workflows, supporting standardized assessment and documentation in multi-site clinic networks. On the formulation front, research interest remains concentrated on bio-stimulatory and regenerative approaches, but EU MDR Annex XVI and FDA device requirements keep clinical evidence, manufacturing controls, and post-market surveillance central to which innovations reach broad commercial scale.
Recent Industry Developments in Aesthetic Fillers Market
- June 2026: Allergan Aesthetics (AbbVie) received U.S. FDA approval for SKINVIVE by JUVEDERM for improvement of neck appearance. The decision extends HA injectables into a prominently visible treatment area under an on-label claim. It supports premium portfolio positioning and differentiates clinics and medical spas through training-led adoption.
- February 2026: Galderma announced multi-region regulatory approval (EU, the United States, and Canada) for an ergonomic Restylane NASHA lidocaine syringe design. The enhanced delivery hardware is designed to improve injector experience, consistency, and brand protection across key markets.
- June 2025: Allergan Aesthetics (AbbVie) reported that the U.S. FDA accepted for review its premarket approval application for SKINVIVE by JUVEDERM for the improvement of neck appearance. The filing points to a potential expansion of premium neck-treatment indications, with training-led differentiation and education programs driving adoption in clinics and medical spas.
Aesthetic Fillers Market Report Scope and Research Methodology
Market Definition and Coverage
For this study, the aesthetic filler market includes revenues from injectable dermal filler products used for cosmetic facial volume restoration, contouring, and line correction, across clinic and hospital settings, and measured in USD value.
Scope exclusions: We exclude surgical implants and lifting procedures, skin care topicals, and energy-based aesthetic devices that are not delivered as injectable fillers.
Segments Covered in This Report
- By Material
- Hyaluronic Acid (HA)
- Calcium Hydroxylapatite (CaHA)
- Poly-L-lactic Acid (PLLA)
- Polymethyl-methacrylate (PMMA)
- Collagen & Others
- By Application
- Facial Line Correction
- Lip Enhancement
- Facial Contouring / Volume Restoration
- Scar & Acne Mark Revision
- Others
- By End User
- Dermatology & Cosmetic Surgery Clinics
- Hospitals
- Medical Spa & Beauty Clinics
- By Gender
- Female
- Male
- By Geography
- North America
- United States
- Canada
- Mexico
- Europe
- Germany
- France
- United Kingdom
- Italy
- Spain
- Rest of Europe
- Asia-Pacific
- China
- Japan
- India
- South Korea
- Australia
- Rest of Asia-Pacific
- Middle East and Africa
- GCC
- South Africa
- Rest of Middle East and Africa
- South America
- Brazil
- Argentina
- Rest of South America
- North America
Data Sources, Market Sizing, and Validation
Desk Research
Desk work was used to set the market boundary, map the product landscape, and create realistic input ranges before interviews. We referred to public sources such as the US FDA product databases and safety communications, American Society of Plastic Surgeons procedure statistics, peer-reviewed journal articles on filler durability and retreatment patterns, and OECD and World Bank macro series that help explain affordability and demand cycles.
We also reviewed annual reports, investor decks, and press releases to track product launches and geographic footprints, then checked import and export statistics where injectable medical products are clearly classified. For fill gaps around smaller private companies and to keep time series consistent, paid subscriptions for company financials and intelligence, news and financials, and patent databases were used selectively. These desk sources are illustrative and not exhaustive, and other public references were also used for data collection, validation, and clarification.
Primary Interviews and Surveys
Field research was conducted through structured expert calls and short surveys with a mix of manufacturers, distributors, clinic operators, and practicing injectors who shared how patient demand and realized pricing change in practice. Because this is a global market, we ensured inputs were validated across APAC, EMEA, and the Americas, so regional volume shifts, channel margins, and product mix changes could be reflected in the model.
Distribution of primary research fieldwork respondents
| Company type | Respondent position | Region |
|---|---|---|
| Top tier: 36% | CXOs: 12% | APAC: 46% |
| Mid tier: 47% | Functional/Unit leaders: 34% | EMEA: 34% |
| Smaller Players: 17% | Managers: 54% | Americas: 20% |
Market-Sizing & Forecasting
Sizing started with a top-down build where procedure intensity and treated population signals are used to reconstruct demand by major region, and then translated into value using a realistic price per syringe and channel markups. To keep totals grounded, the outputs were cross-checked with selective bottom-up approximations, such as rolling up a sampled set of supplier revenues and validating implied volumes against clinic throughput discussions.
Key inputs used in the model include the mix of filler materials used in practice, average syringe utilization per treatment, retreatment timing based on typical duration of effect, the share of procedures done in clinics versus hospitals and medical spas, and regional price corridors after currency conversion and inflation adjustments. Forecasts were developed using scenario analysis, where procedure growth, pricing progression, and product mix shifts were varied within ranges that interviewees considered achievable, and then consolidated into a single expected path. Where product revenue disclosure was limited, gaps were handled through conservative share allocation anchored to public footprint indicators and rechecked in follow-up calls.
Data Validation & Update Cycle
Outputs were validated through multiple checks, including reconciling implied procedure volumes with known procedure statistics, testing price assumptions against a spread of respondent quotes, and reviewing material mix against product availability signals. If the model shows sudden jumps that cannot be explained by launches, reimbursement changes, or regional demand shifts, the assumptions are revisited and a re-contact is triggered with relevant respondents.
Before sign-off, the work is reviewed in steps by another analyst to confirm that inputs, conversions, and calculations are consistent across regions and years. Reports are refreshed annually, and interim updates are made when material events occur that can move pricing, access, or demand, followed by a final pre-delivery pass so clients receive the latest view.
Mordor Intelligence's Aesthetic Filler Market Sizing Compared With Other Published Estimates
Published market sizes for aesthetic fillers do not always line up because scope and timing choices differ, even when the same words are used in the market title. The biggest gaps usually come from what is counted as a filler product, which year is treated as the base, and whether values are converted using an average annual rate or a point in time currency rate.
When ASP changes are refreshed with current year pricing checks and the implied procedure volumes are re-tested against public procedure statistics, the final value can shift versus older snapshots, which is a key reason the Mordor Intelligence figure differs from some published totals.
Benchmark comparison
| Source | Market Size | Gaps in Research Methodology |
|---|---|---|
| Mordor Intelligence | USD 3.75 B (2025) | |
| Industry Research Publisher A | USD 5.49 B (2024) | Uses an earlier base year and a broader definition that can capture adjacent dermal filler use cases, and the value can shift depending on whether reported prices reflect list pricing versus realized clinic level pricing. |
| Global Publisher B | USD 5.15 B (2025) | Often reflects a wider dermal fillers scope and applies different currency conversion timing and ASP uplift assumptions, which can raise the headline value even when procedure growth is similar. |
Overall, the comparison shows that the main differences come from scope boundaries and how pricing and currency are treated in the base year. When the demand pool checks, price logic, and conversion timing are kept consistent, the resulting market size becomes easier to trace and repeat across future refreshes.
Key Questions Answered in the Report
How fast is global demand for aesthetic filler growing through 2032?
Global procedure volume is projected to rise at a 6.83% CAGR, lifting the aesthetic filler market size from USD 3.96 billion in 2027 to USD 5.51 billion by 2032.
Which material currently dominates filler usage worldwide?
Hyaluronic acid leads, holding 62.57% of 2026 revenue because clinicians value its reversibility and wide FDA-approved indications.
What geography is expanding fastest?
Asia-Pacific is forecast to log a 9.04% CAGR through 2032, driven by China’s domestic approvals and South Korea’s medical-tourism ecosystem.
Why are regenerative fillers gaining attention?
Early trials show stem-cell exosome–enriched fillers can extend dermal thickness for 18-24 months, potentially halving the frequency of repeat injections.
Are male patients a significant growth vector?
Yes. Male procedures are advancing at an 8.24% CAGR as workplace video calls and performance-oriented marketing normalize subtle contouring.
What is the biggest regulatory challenge right now?
Counterfeit and gray-market injectables are prompting global crackdowns that raise compliance costs and threaten patient safety.