
Aerospace Pressure Gauge Market Size and Share
Market Overview
| Study Period | 2020 - 2031 |
|---|---|
| Market Size (2026) | USD 23.03 Million |
| Market Size (2031) | USD 25.43 Million |
| Growth Rate (2026 - 2031) | 2.02 % |
| Fastest Growing Market | Asia-Pacific |
| Largest Market | North America |
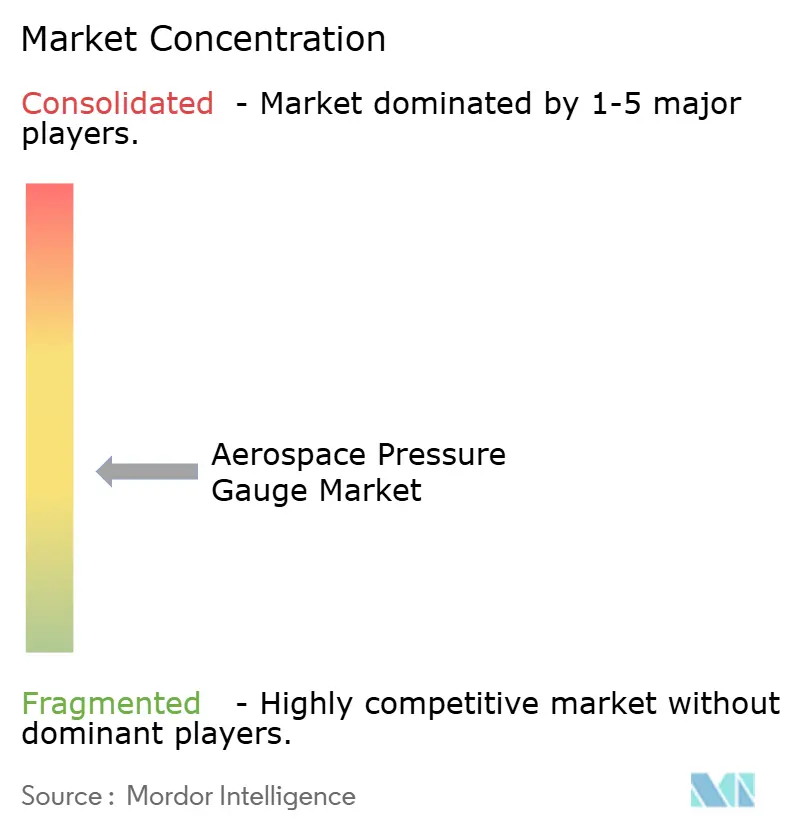
| Market Concentration | Medium |
Major Players *Disclaimer: Major Players sorted in no particular order Image © Mordor Intelligence. Reuse requires attribution under CC BY 4.0. | |
Aerospace Pressure Gauge Market Analysis by Mordor Intelligence
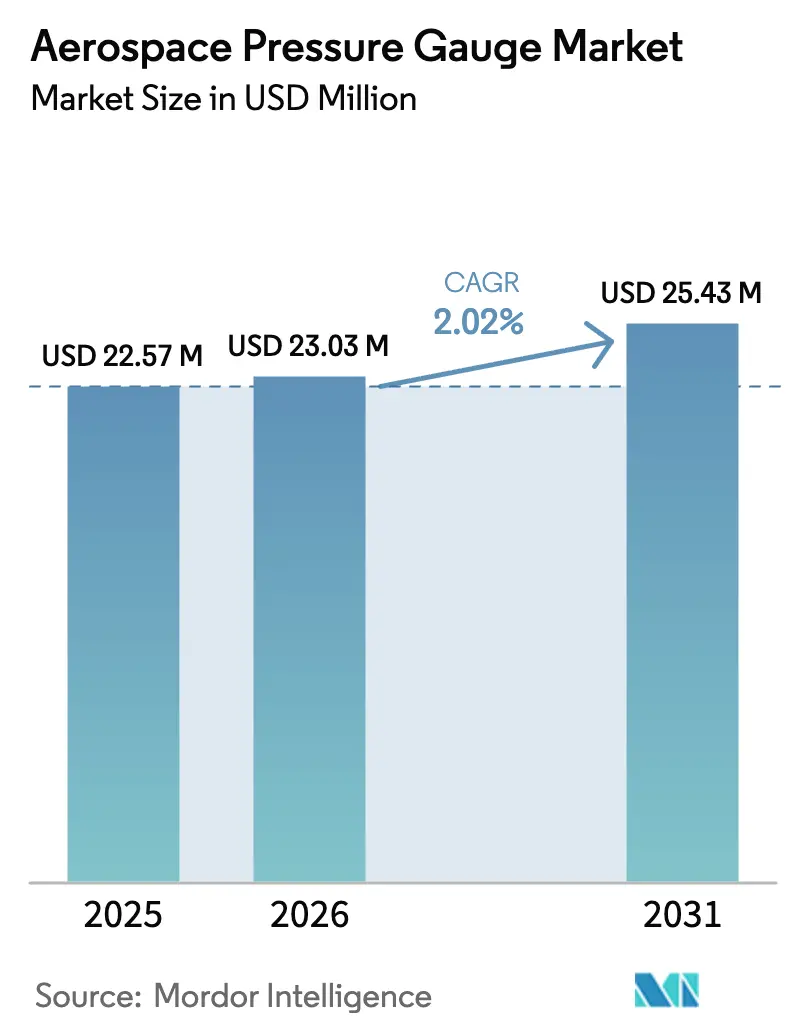
The aerospace pressure gauge market size in 2026 is estimated at USD 23.03 million, growing from 2025 value of USD 22.57 million with 2031 projections showing USD 25.43 million, growing at 2.02% CAGR over 2026-2031. Digital retrofits on legacy cockpits, tighter sensor tolerances in new-build airframes, and expanding fleet renewal programs are moderating the growth profile yet steadily orienting demand toward miniaturized, software-enabled instrumentation. Analog gauges still dominate installed bases, but airframers are specifying digital interfaces for predictive maintenance tie-ins, driving incremental revenue opportunities in connected spares, data services, and calibration equipment. Capacity expansions at The Boeing Company, Airbus, and COMAC are shortening design cycles and compressing delivery schedules, raising the urgency for multi-year sensor supply agreements and localized manufacturing footprints. Meanwhile, regulatory emphasis on wireless monitoring and cybersecurity compliance is increasing certification costs but strengthening aftermarket pull for qualified digital variants. Suppliers that can synchronize MEMS innovation with global production ramp-ups and national content rules are best placed to capture share as the aircraft mix tilts toward newer, more instrumented platforms.
Key Report Takeaways
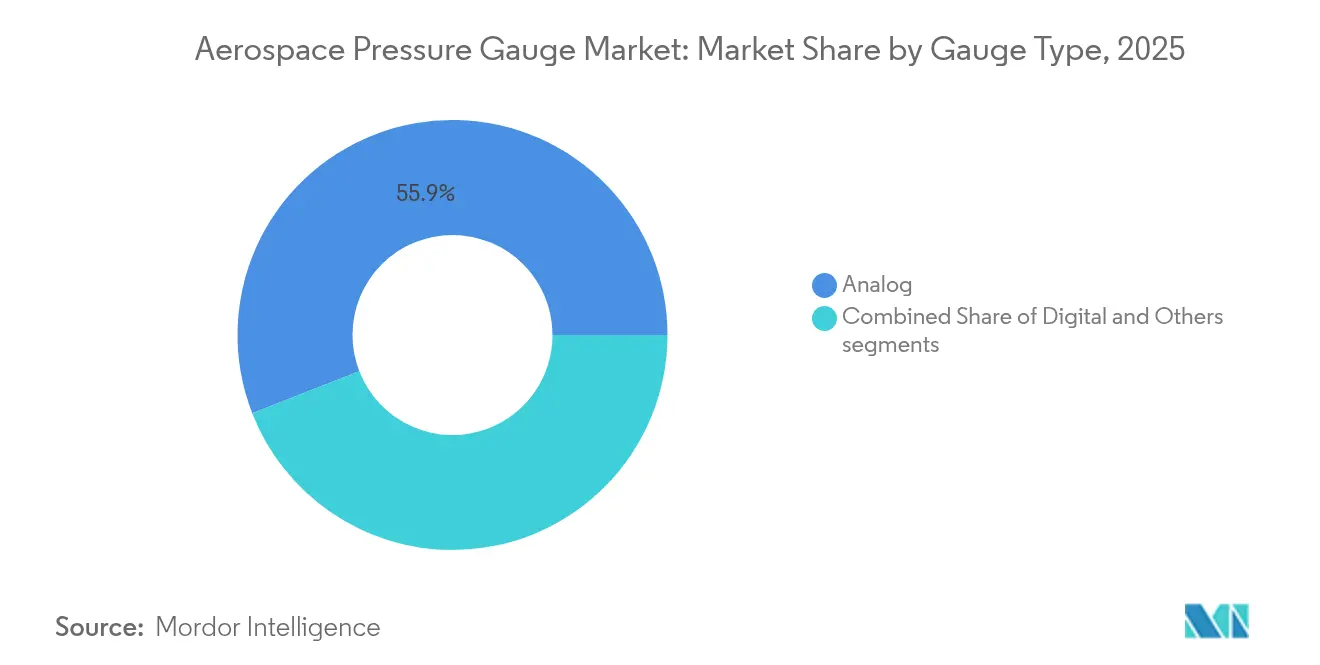
- By gauge type, analog instruments led with a 55.92% share in 2025, while digital variants are projected to expand at a 3.12% CAGR to 2031.
- By pressure sensor technology, piezoresistive devices accounted for 47.25% of the aerospace pressure gauge market share in 2025, while capacitive designs are advancing at a 4.4% CAGR through 2031.
- By application, commercial and military aviation accounted for 92.85% of 2025 revenue; unmanned systems represented the fastest expansion, with a 4.05% CAGR driven by drone fleet growth.
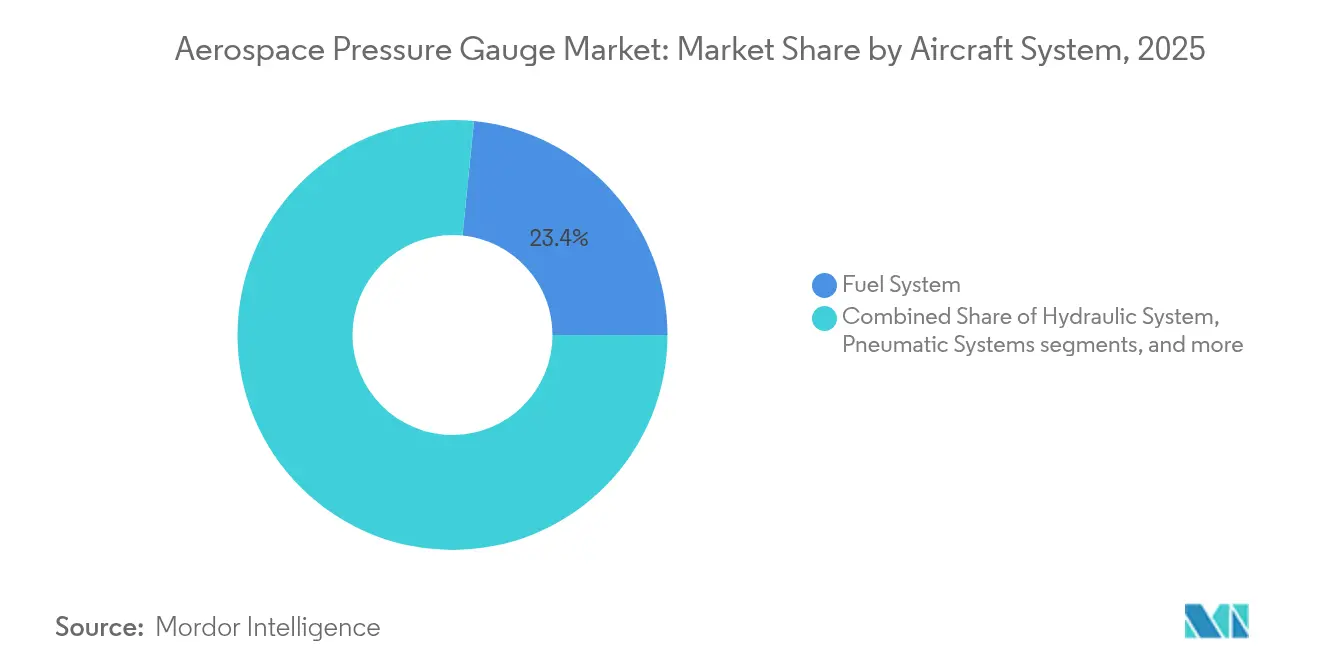
- By aircraft system, fuel monitoring captured 23.41% of the 2025 demand, whereas landing-gear and tire pressure sensing showed the quickest pace at a 2.54% CAGR to 2031.
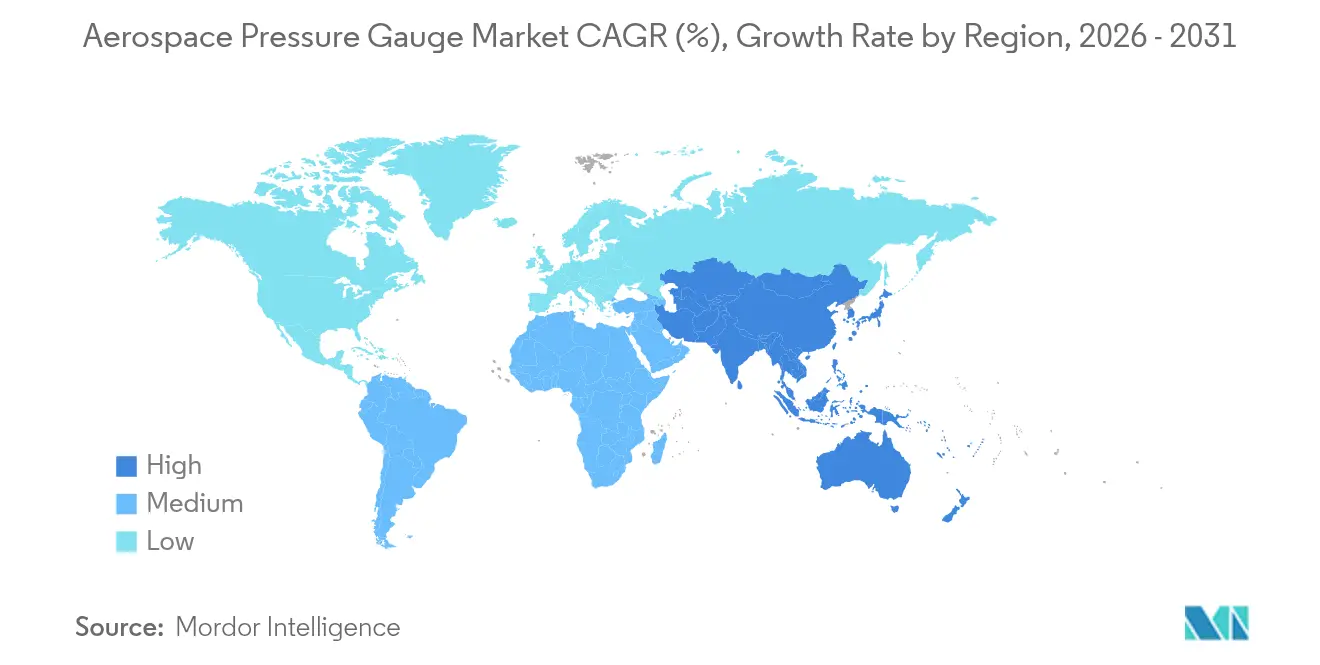
- By geography, North America retained a 37.25% share in 2025; the Asia-Pacific region is set to grow the fastest at a 5.59% CAGR, buoyed by COMAC C919 build rates and Indian defense programs.
Note: Market size and forecast figures in this report are generated using Mordor Intelligence’s proprietary estimation framework, updated with the latest available data and insights as of 2026.
Market Trends and Insights
Drivers Impact Analysis of Aerospace Pressure Gauge Market*
| Driver | (~) % Impact on CAGR Forecast | Geographic Relevance | Impact Timeline |
|---|---|---|---|
| Acceleration in digital cockpit modernization initiatives | +0.4% | Global, led by North America and Europe | Medium term (2–4 years) |
| Increasing integration of wireless pressure monitoring systems in commercial fleets | +0.3% | North America and Asia-Pacific | Medium term (2–4 years) |
| Expansion in global aerospace manufacturing and assembly capacity | +0.3% | Global, concentrated in North America, Europe, Asia-Pacific | Short term (≤2 years) |
| Regulatory compliance mandates enforcing strict calibration and maintenance cycles | +0.2% | Global, strongest in North America and Europe | Long term (≥4 years) |
| Technological advancements in MEMS-based miniaturized pressure sensors | +0.3% | Global, R&D hubs in North America, Europe, Asia-Pacific | Long term (≥4 years) |
| Growth in unmanned aerial systems requiring compact and high-precision instrumentation | +0.2% | Global, early adoption in North America, Asia-Pacific, Middle East | Medium term (2–4 years) |
| Source: Mordor Intelligence | |||
Acceleration In Digital Cockpit Modernization Initiatives
Airframers are migrating from mechanical dials toward integrated flight decks that consolidate pressure data on glass displays. Honeywell’s Avianca A320neo retrofit replaced 14 analog gauges with six digital units, reducing cockpit weight by 8 kg and enabling health monitoring through Skywise analytics.[1] The B787 and B777X require digital sensors across fuel, hydraulic, and environmental systems, pressuring MROs to carry electronic spares. Embraer’s E2 jets demand sub-0.1% full-scale accuracy delivered via CAN bus, which mechanical Bourdon tubes cannot maintain over wide thermal ranges. Lessors are funding mid-life narrowbody upgrades to sustain lease rates, accelerating the retirement of analog aircraft even on those with 10-year service lives. FAA Advisory Circular 25-11B now streamlines approval of digital instrumentation, further reinforcing the adoption cycle.
Increasing Integration Of Wireless Pressure Monitoring Systems In Commercial Fleets
Teledyne’s 2024 Bluetooth Low Energy module eliminated 200 m of wiring per aircraft and cut installation labor by 40 hours. Weight savings of roughly 12 kg per narrowbody translate into fuel burn reductions and lower carbon charges. Airbus Skywise aggregates real-time sensor data from more than 10,000 aircraft, and early anomaly alerts prevented three in-flight shutdowns on an Asian A330 fleet in 2024.[2] EASA requires DO-160G emission compliance and fail-safe modes for wireless links, which can add up to nine months to certification, but ensures reliability. Operators prioritize tire-pressure modules that shorten ground checks by up to 20 minutes and reduce incidents of tread separation.
Expansion In Global Aerospace Manufacturing And Assembly Capacity
Boeing enhanced the B737 MAX output to 38 units per month by late 2024, and South Carolina’s B787 line now produces ten airframes monthly. Airbus added an A320 line in Mobile, Alabama, and raised Tianjin throughput to six per month, lifting the family’s rate to 65. COMAC delivered 39 C919 jets in 2024 and aims to reach 150 per year by 2028, driving domestic demand for localized sensors under the “Made in China 2025” policy. India’s Tata-Airbus venture has begun C295 assembly, with each airframe requiring approximately 50 pressure transducers. These ramps squeeze lead times for aerospace-grade piezoresistive parts beyond 52 weeks, forcing OEMs into multi-year supply contracts.
Regulatory Compliance Mandates Enforcing Strict Calibration And Maintenance Cycles
FAA AC 43-13-1B requires annual calibration with NIST traceability for critical pressure instruments, sustaining recurring aftermarket sales. EASA Part-M obliges operators to keep lifetime records and replace sensors that drift out of tolerance. The US Air Force Technical Order 33B-1-1 halves the interval to six months for fighter power plants, magnifying demand for certified replacements. Cybersecurity standards DO-326A and ED-202A add software validation costs and require secure boot functionality, which can increase certification budgets by up to USD 300,000 per sensor family. Operators view compliance as non-negotiable, given that a single pressure-sensor failure can ground an aircraft and cost airlines between USD 50,000 and USD 150,000 per day.
Restraints Impact Analysis of Aerospace Pressure Gauge Market*
| Restraint | (~) % Impact on CAGR Forecast | Geographic Relevance | Impact Timeline |
|---|---|---|---|
| Performance limitations associated with mechanical gauge reliability | -0.3% | Global, legacy fleets in North America, Europe, emerging markets | Short term (≤2 years) |
| Elevated certification and regulatory approval costs for advanced sensor technologies | -0.2% | Global, most acute in North America and Europe | Medium term (2–4 years) |
| Material sourcing challenges impacting high-grade sensor component availability | -0.2% | Global, supply concentrated in North America, Asia-Pacific | Short term (≤2 years) |
| Cybersecurity compliance requirements delaying deployment of connected gauge systems | -0.1% | Global, regulatory focus in North America and Europe | Medium term (2–4 years) |
| Source: Mordor Intelligence | |||
Performance Limitations Associated With Mechanical Gauge Reliability
Analog Bourdon-tube gauges drift 0.5% to 1.0% per year and contributed 18% of unscheduled maintenance events on regional turboprops in 2024. Temperature sensitivity can cause errors exceeding 3% at cruise altitude, whereas digital sensors compensate algorithmically. Complete retrofits cost between USD 15,000 and USD 25,000 per aircraft, deterring operators of older assets. Mechanical units also require 500-hour inspections, compared to 2,000 hours for digital equivalents, which increases lifecycle expenses by roughly 40%. Operators weigh known shortcomings against capital outlay, slowing the fleet-wide update pace.
Elevated Certification And Regulatory Approval Costs For Advanced Sensor Technologies
FAA TSO approval can exceed USD 800,000 once DO-178C, DO-160G, and DO-326A test regimes are met. EASA rules add up to USD 300,000 and nine months of dual-lab verification. Mid-tier suppliers, such as Kulite, report that certification expenses equal to 12% of their revenue limit their product pipeline. Annual cybersecurity audits increase recurring costs, prompting 40% of surveyed vendors to delay launches by more than a year.
*Our forecasts treat driver/restraint impacts as directional, not additive. The impact forecasts reflect baseline growth, mix effects, and variable interactions.
Aerospace Pressure Gauge Market Segment Analysis
By Gauge Type:
Digital Variants Gain On Integration MandatesAnalog instruments accounted for 55.92% of the aerospace pressure gauge market share in 2025, reflecting their legacy footprint across older narrowbodies and turboprops. Digital gauges, supported by airframe policies on integrated avionics, are forecast to grow at a rate of 3.12% annually to 2031, progressively displacing mechanical units in both linefit and retrofit channels.
Digital architectures simplify wiring, enable remote diagnostics, and meet new cybersecurity rules, tipping total cost-of-ownership in their favor by delivering a three-year payback through reduced calibration labor and fewer unscheduled interventions. The growth in market share of digital pressure gauges is envisioned to be aided by FAA incentives for software-based displays. Analog remains relevant in military programs that still specify mechanical backups, but its revenue pool steadily narrows as fleets modernize.

By Application:
Aviation Dominance Masks Space Segment PotentialAviation accounted for 92.85% of 2025 revenue, with commercial air transport leading unit demand as Airbus and Boeing boost single-aisle production. Military and business aviation add volume through modernization programs that embed digital sensors for condition-based maintenance. The aerospace pressure gauge market size in aviation applications is expected to grow at a 4.05% CAGR by 2031.
Spacecraft and satellite platforms, although smaller in dollars, display above-average growth as Artemis lunar missions, LEO constellations, and JAXA’s exploration projects adopt radiation-hardened gauges. Redundant capacitive sensors on SpaceX Dragon capsules set new performance benchmarks and guide specifications for future orbital stations. While space represents under 7% of current sales, its higher margins and technology spillovers give suppliers a strategic incentive to invest.
By Aircraft System:
Fuel Monitoring Leads, Landing Gear AcceleratesFuel systems retained 23.41% of demand in 2025 because regulations require dual-redundant measurement across tanks and feed lines. Hydraulics and cabin-pressure loops follow, each becoming more sensor-intensive as fly-by-wire and bleedless architectures expand. The aerospace pressure gauge market share for landing-gear and tire monitoring systems is growing at the fastest rate, with a 2.54% CAGR through 2031, driven by wireless TPMS approvals from the EASA and FAA.
Landing gear modules save operators up to 20 minutes per turnaround and cut unscheduled events tied to under-inflation, justifying rapid airline uptake. High-temperature SiC sensors are winning engine and APU positions once reserved for remotely mounted mechanical units, trimming weight and simplifying maintenance. Over the forecast period, wireless systems will continue to redistribute value toward connected ground operations, tooling, and data analytics.
By Pressure Sensor Technology:
Piezoresistive Maturity, Capacitive MomentumPiezoresistive devices held a 47.25% share in 2025, valued for linearity and heritage qualifications across pressure ranges up to 15,000 psi. Capacitive MEMS parts, however, are growing at a rate of 4.4% annually due to their superior drift performance and low-power traits, which are attractive for wireless and battery-powered use cases.
Capacitive share gains are most visible in cabin-pressure and TPMS modules, where milli-watt consumption extends sensor life within sealed housings. Piezoresistive units remain indispensable for high-pressure hydraulic circuits and cryogenic propellant lines. Piezoelectric designs remain niche but command premium prices in turbine blade and combustion pressure mapping applications.
Geography Analysis
North America Aerospace Pressure Gauge Market
North America led with 37.25% revenue in 2025, supported by Boeing’s production hubs, Airbus’s Alabama line, and a dense network of Tier 1 suppliers. Proximity to the FAA and RTCA accelerates certification, giving domestic vendors early access to new standards and program slots. US defense projects such as the KC-46 tanker and B-21 bomber sustain demand for 40-G shock-qualified, 10,000-hour mean time between failures (MTBF) sensors. Canada contributes through Bombardier upgrades, while Mexico’s low-cost sub-assembly capability supports local growth.
APAC Aerospace Pressure Gauge Market
The Asia-Pacific is the fastest-growing cluster, with a 5.59% CAGR, driven by COMAC’s C919 ramp, India’s C295 transport line, and high-tempo fleet expansion at low-cost carriers. China’s 70% domestic content mandate catalyzes joint ventures such as Safran-AVIC Jonhon’s Luoyang plant for piezoresistive output. India’s Tejas and HTT-40 programs intensify indigenous demand; meanwhile, Japan’s JAXA drives the development of cryogenic and radiation-hardened sensors. South Korea and Southeast Asian nations add incremental volume through urban air mobility (UAM) pilots.
EMEA and South America Aerospace Pressure Gauge Market
Europe maintains a robust share, anchored by Airbus assemblies in Toulouse, Hamburg, and Seville, as well as suppliers such as Safran and Parker Meggitt. EASA’s stringent Part-21 requirements lengthen the time-to-market yet ensure high-quality thresholds that favor established players. Sustainability themes, including Airbus’s ZEROe hydrogen demonstrator, spur requests for gauges capable of operating at -253 °C. The Middle East is leveraging the growth of MRO hubs in Dubai and Abu Dhabi. In contrast, Africa and South America remain comparatively small due to limited manufacturing of high-reliability sensors.
Regulatory Landscape
Aerospace pressure gauges are shaped by overlapping airworthiness, environmental, and quality-system requirements that raise qualification and audit burdens for both linefit and aftermarket parts. The International Aerospace Quality Group (IAQG) uses AS9100 as a baseline quality-management standard across aviation, space, and defense programs to align supplier practices with airworthiness obligations.
Product-level expectations also reference established gauge standards across major markets, including ASME B40.100 in the United States and EN 837-1 in Europe for Bourdon-tube gauges. For aircraft wheel inflation valves that incorporate an inflation pressure gauge, ARP5543A is referenced, and for connected instrumentation, DO-160G and DO-326A/ED-202A in cockpit modernization and wireless monitoring programs anchor software and environmental test regimes.
Value Chain Analysis
The value chain begins with sensing elements such as MEMS dies and ASICs, high-grade metals, and elastomers, then progresses to sensor design, packaging, calibration, and qualification under AS9100. Tiered suppliers from Tier 2 and 3 component makers through Tier 1 integrators deliver pressure gauges, transducers, and pressure modules to aircraft and engine OEMs, avionics, and system integrators.
At the aircraft-system level, pressure data supports air data, fuel, hydraulics, ECS, landing gear, and engine monitoring architectures, linking sensor performance to downstream system monitoring and maintenance workflows.
Competitive Landscape
Competitive intensity is moderate. Honeywell International Inc., TE Connectivity plc, Ahlers Aerospace, Inc., UMA, Inc., and Parker Meggitt (Parker-Hannifin Corporation) collectively hold a prominent market share, leaving a runway for niche innovators. Honeywell expanded its Arizona MEMS facility by 30% in 2025 to meet demand for the B737 MAX and A320neo aircraft, utilizing automated die-bonding to reduce unit costs by 15%. AMETEK’s acquisition of Crank Software folds rich graphical interfaces into sensor bundles, elevating value propositions for glass-cockpit programs.
TE Connectivity advances low-power capacitive designs, such as the MS5837-02BA, for UAVs, capitalizing on lightweight urban air mobility craft. Safran’s joint venture with AVIC Jonhon meets Chinese content rules, granting local access to the C919. Parker Meggitt’s USD 120 million Next Generation Air Dominance (NGAD) contract demonstrates incumbents’ leverage in defense niches that require 5,000 psi, 50-G-rated devices.
White space exists in wireless TPMS and deep-space probes, where fewer than five qualified suppliers operate. Patent filings underscore the innovation race: Honeywell lodged 14 pressure-sensor applications in 2024, covering fabrication and predictive algorithms, while TE Connectivity’s patents center on ultra-low-power telemetry. Cybersecurity compliance is emerging as a tie-breaker as airlines insist on DO-326A credentials for connected cockpit components.
Aerospace Pressure Gauge Industry Leaders
-
Honeywell International Inc.
-
UMA, Inc.
-
TE Connectivity plc
-
Ahlers Aerospace, Inc.
-
Parker Meggitt (Parker-Hannifin Corporation)
- *Disclaimer: Major Players sorted in no particular order
Aerospace Pressure Gauge Market Companies Covered in this Report
- UMA, Inc.
- Ahlers Aerospace, Inc.
- L3Harris Technologies, Inc.
- Davtron Inc.
- Honeywell International Inc.
- Parker Meggitt (Parker-Hannifin Corporation)
- TE Connectivity plc
- Baker Hughes Company
- CIRCOR International, Inc.
- Newbow Aerospace Ltd.
- PCB Piezotronics, Inc.
- Tronair Inc.
- WIKA Instrument, LP
Market Opportunities and Future Outlook
Opportunities are strongest where the industry shifts toward data-enabled sensing and condition-based maintenance, including wireless tire pressure monitoring and wheel-inflation gauge architectures. The push for qualified wireless sensors that meet DO-160G and cybersecurity validation supports differentiation in retrofit kits and spares, and it also helps suppliers manage longer lead times driven by OEM build cycles.
One evidence point is the April 2026 global distribution agreement between Boeing Distribution and Honeywell Sensing Solutions, which expands aftermarket access to Honeywell sensing products. In 2026, TE Connectivity and Measurement Specialties demonstrating high-accuracy, media-isolated sensors at scale also points to demand for calibrated, reliable sensing solutions in aerospace applications.
Recent Industry Developments in Aerospace Pressure Gauge Market
- June 2026: TE Connectivity / Measurement Specialties: Mouser Electronics stocking of the 8XH high-accuracy media-isolated pressure sensor series. The stocking indicates ongoing demand for high-accuracy sensors across industrial and OEM applications. This supports calibrated, media-isolated variants that reduce field calibration needs.
- April 2026: Honeywell Sensing Solutions / Boeing Distribution: Global distribution agreement to provide aftermarket access to Honeywell aerospace and defense sensing products, including pressure switches and oil level sensors. The arrangement broadens aftermarket access across fleets. The deal also strengthens supply chain resilience and serviceability for pressure-sensing components.
- July 2025: TE Connectivity (Measurement Specialties): NASA Shared Services Center presolicitation for TE Connectivity pressure scanners for NASA Glenn Research Center. The procurement signals a government-minimum viable demand for pressure-scanner platforms. It also creates a pipeline opportunity for TE Connectivity tied to NASA project spending.
Aerospace Pressure Gauge Market Report Scope and Research Methodology
Market Definition and Coverage
This market covers the value of pressure gauges used in aerospace platforms and related systems where pressure needs to be measured and displayed for safe operations and maintenance, across commercial, defense, and space uses.
Scope exclusions: We exclude general industrial pressure gauges not qualified for aerospace use and any pressure sensing elements counted only as standalone sensors without a gauge function.
Segments Covered in This Report
- By Gauge Type
- Analog
- Digital
- Others
- By Application
- Aviation
- Commercial Aviation
- Military Aviation
- General Aviation
- Unmanned Aerial Systems
- Space
- Satellite
- Spacecraft
- Aviation
- By Aircraft System
- Fuel System
- Hydraulics System
- Cabin Pressure and ECS
- Engine and APU Monitoring System
- Landing-Gear and Tire Pressure Monitoring System
- Avionics/Pitot-Static
- Pneumatic Systems
- By Pressure Sensor Technology
- Piezoresistive
- Capacitive
- Piezoelectric
- By Geography
- North America
- United States
- Canada
- Mexico
- Europe
- United Kingdom
- France
- Germany
- Italy
- Spain
- Rest of Europe
- Asia-Pacific
- China
- India
- Japan
- South Korea
- Rest of Asia-Pacific
- South America
- Brazil
- Argentina
- Rest of South America
- Middle East and Africa
- Middle East
- United Arab Emirates
- Saudi Arabia
- Turkey
- Rest of Middle East
- Africa
- South Africa
- Rest of Africa
- Middle East
- North America
Data Sources, Market Sizing, and Validation
Desk Research
Desk research starts by mapping where aerospace pressure gauges sit in aircraft and space hardware, and then tying demand to aircraft output and fleet activity. Public sources were used to anchor baseline demand signals, such as FAA and EASA airworthiness and fleet information, ICAO traffic and operations statistics, NASA program and technical publications, and defense procurement disclosures where available.
To sanity check adoption and pricing direction, we also referenced standards and technical bodies such as SAE publications, along with corporate filings, investor presentations, association websites, and reputable aviation press coverage of aircraft programs and maintenance trends. Select paid subscriptions for company financials, patent databases, aircraft and engine fleet tracking, and import and export shipment level data were used when public reporting was not specific enough to map pricing and unit volumes.
These examples are not exhaustive, and many other sources were also checked to collect, validate, and clarify the final inputs.
Primary Interviews and Surveys
Primary work focused on confirming what gets counted as a gauge versus a sensor, how replacement cycles behave across aircraft systems, and how digital adoption shifts typical selling prices. We spoke with component suppliers, calibration and MRO-focused participants, and aerospace procurement and engineering teams across major operating regions, so the assumptions used in the model could be pressure-tested before finalizing the demand pool.
Distribution of primary research fieldwork respondents
| Company type | Respondent position | Region |
|---|---|---|
| Top tier: 32% | CXOs: 22% | APAC: 44% |
| Mid tier: 46% | Functional/Unit leaders: 19% | EMEA: 37% |
| Smaller Players: 22% | Managers: 59% | Americas: 19% |
Market-Sizing & Forecasting
Sizing starts with a top-down build where aircraft production, fleet size, and maintenance intensity are used to reconstruct the addressable gauge demand pool, and then those volumes are translated into value using typical price bands by gauge type and use case. The totals are then cross-checked with selective bottom-up approximations, such as rolling up sampled supplier revenues, using channel checks on replacement demand, and validating implied units-per-platform assumptions.
Key inputs we relied on include aircraft deliveries and order backlogs, active fleet and utilization trends, the share of gauges used in fuel and hydraulic systems versus other systems, analog versus digital mix shifts, and typical calibration or replacement intervals seen in MRO workflows. Forecasting is built using scenario analysis, where base case assumptions on aircraft output and utilization are adjusted using expert feedback on program timing and retrofit or replacement behavior. Where bottom-up data is incomplete, gaps are handled by applying conservative penetration and replacement factors that were rechecked during interviews, before the final totals are locked.
Data Validation & Update Cycle
Validation is done in layers so the final numbers are not driven by a single series. We compare model outputs against independent signals like fleet changes, delivery ramps, and observed pricing direction, and then any sharp swings are reworked until the drivers match real market behavior. A second analyst review is completed for logic, unit consistency, and regional roll-ups, followed by a final variance check against historical trends.
Reports are refreshed annually, and interim updates are made when material events occur, such as major production rate changes or shifts in maintenance cycles. Before delivery, a fresh pass is completed so clients receive an updated view using the latest available public information and confirmed expert inputs.
Mordor Intelligence's Aerospace Pressure Gauge Market Sizing Compared With Other Published Estimates
Published market sizes for aerospace pressure gauges can look different because authors do not always count the same hardware set, the same aviation and space uses, or the same timing for pricing and currency conversion. Differences also come from how replacement demand is treated, since MRO driven volumes can be larger than new build volumes in certain years.
The main gap comes from whether cockpit pressure indicators are bundled with standalone pressure sensors and transmitters, and Mordor Intelligence counts only gauge products where a gauge function is explicitly present, which usually reduces totals when broader instrumentation baskets are used.
Benchmark comparison
| Source | Market Size | Gaps in Research Methodology |
|---|---|---|
| Mordor Intelligence | USD 22.57 M (2025) | |
| Aviation Components Brief A | USD 31.40 M (2025) | Uses a wider definition that blends gauges with pressure sensors and related cockpit instrumentation, and it applies a higher digital ASP uplift without separating retrofit from line-fit demand. |
| Global Consultancy B | USD 18.90 M (2026) | Leans heavily on new aircraft production only, with limited allowance for MRO replacement cycles and calibration driven demand, which pulls down the implied unit volumes in mature fleets. |
The spread in the table is mostly explained by scope and demand drivers, not by arithmetic differences. By keeping the counted product set consistent and then tying demand to both aircraft output and in-service maintenance behavior, our estimate stays traceable to clear variables and repeatable steps.
Key Questions Answered in the Report
What is the current value of the aerospace pressure gauge market?
The aerospace pressure gauge market size is USD 23.03 million in 2026 and is forecasted to reach USD 25.43 million by 2031, growing at a 2.02% CAGR.
Which gauge type holds the largest share?
Analog instruments hold 55.92% of 2025 revenue, although digital units are growing faster at 3.12% CAGR.
Which region is expanding the quickest?
Asia-Pacific is the fastest-growing region, projected at a 5.59% CAGR through 2031 due to COMAC C919 and Indian defense programs.
What technology is gaining ground over piezoresistive sensors?
Capacitive MEMS sensors are advancing at a 4.4% CAGR because of superior temperature stability and lower power draw.
How are wireless TPMS modules affecting airline operations?
Certified wireless tire-pressure systems cut ground inspection time by up to 20 minutes per turnaround and reduce unscheduled maintenance events.
What is the main hurdle for new sensor entrants?
High certification costs, often exceeding USD 800,000 per variant, and extended approval timelines create significant barriers for newcomers.