
Advertising Services Market Size and Share
Market Overview
| Study Period | 2020 - 2031 |
|---|---|
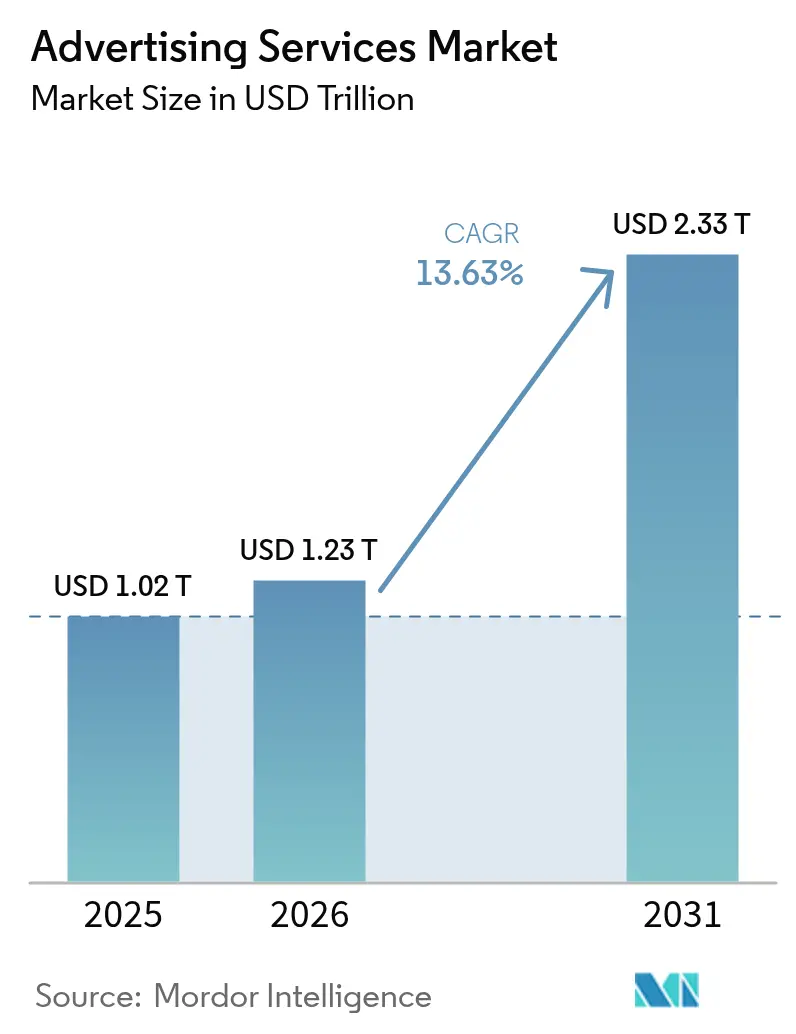
| Market Size (2026) | USD 1.23 Trillion |
| Market Size (2031) | USD 2.33 Trillion |
| Growth Rate (2026 - 2031) | 13.63 % |
| Fastest Growing Market | Asia Pacific |
| Largest Market | North America |
| Market Concentration | Medium |
Major Players *Disclaimer: Major Players sorted in no particular order Image © Mordor Intelligence. Reuse requires attribution under CC BY 4.0. | |
Advertising Services Market Analysis by Mordor Intelligence
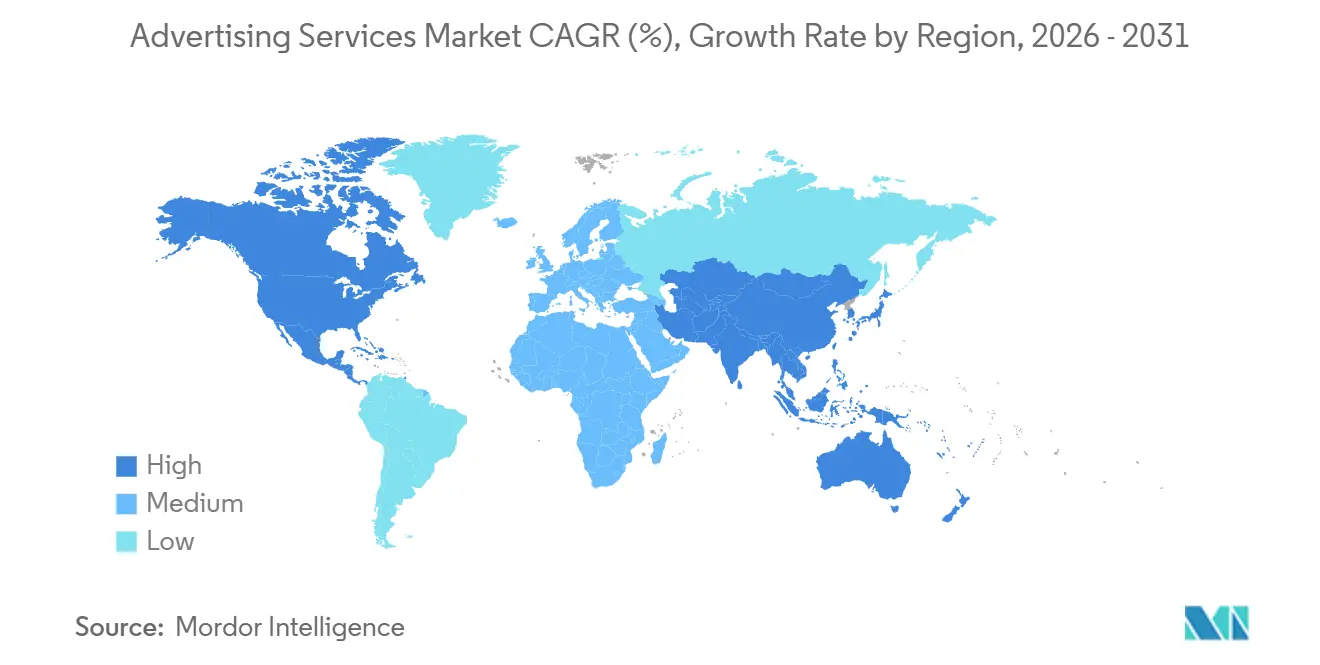
The advertising services market size is expected to grow from USD 1.03 trillion in 2025 to USD 1.23 trillion in 2026 and is forecast to reach USD 2.33 trillion by 2031 at a 13.63% CAGR over 2026-2031. Advertisers are reallocating budgets toward measurable, data-rich channels, pushing online platforms to a 61.73% share in 2025 and sustaining a 14.11% CAGR, as programmatic video, retail media networks, and social commerce integrations demonstrate closed-loop attribution. Social-media publishing retained 29.36% share, yet retail media’s 13.73% CAGR shows that transactional environments can now rival attention-based platforms for growth. Retail advertisers accounted for the largest end-user spend at 20.86% in 2025, while healthcare and pharmaceuticals spending grew at 13.96% CAGR as telehealth and digital therapeutics gained regulatory clarity. Regionally, North America held 37.94% of global revenue in 2025, but Asia Pacific is poised for the fastest expansion at 14.54% CAGR on the back of India’s 20.2% growth and Southeast Asia’s video-commerce momentum.
Key Report Takeaways
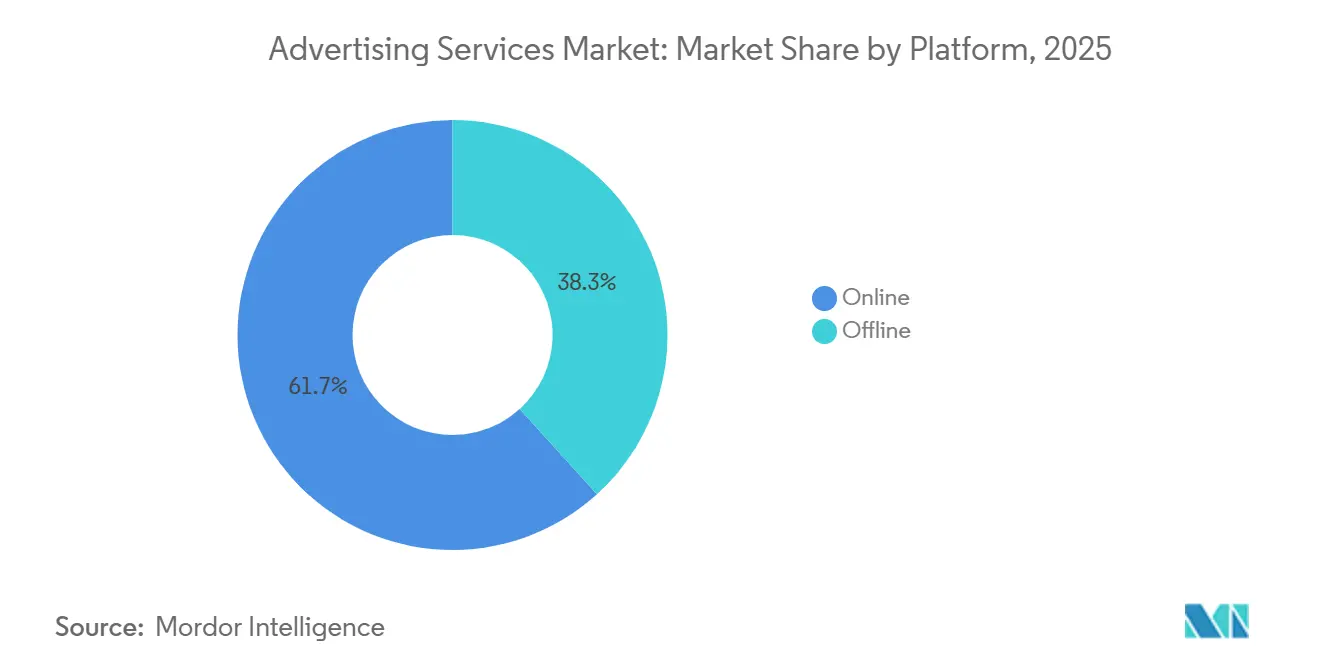
- By platform, online environments led with 61.73% of the advertising services market share in 2025, while the same segment is projected to grow at 14.11% CAGR through 2031.
- By advertising channel, social-media publishing held 29.36% share in 2025, whereas retail media is advancing at a 13.73% CAGR to 2031.
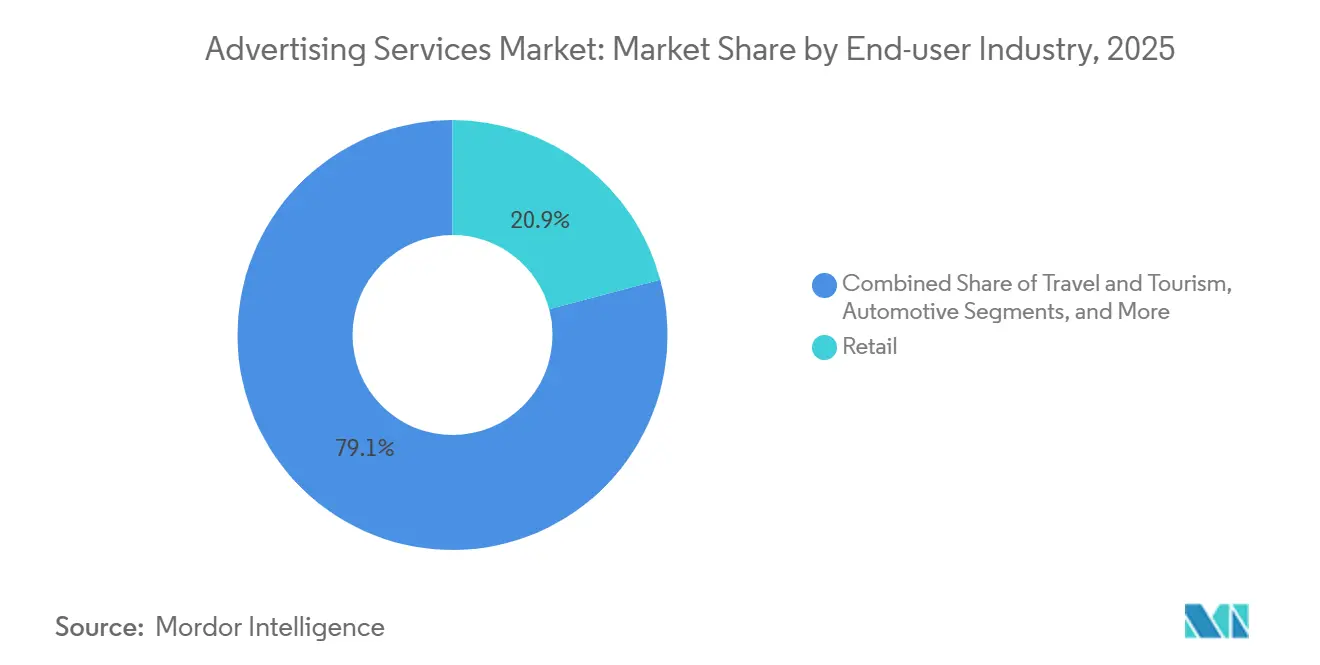
- By end-user industry, retail led with 20.86% share in 2025 and healthcare and pharmaceuticals is expanding at 13.96% CAGR over 2026-2031.
- By agency type, full-service integrated agencies commanded 25.39% share in 2025, while in-house brand studios are growing at 14.02% CAGR through 2031.
- By geography, North America contributed 37.94% revenue in 2025 and Asia Pacific is forecast to post a 14.54% CAGR during 2026-2031.
Note: Market size and forecast figures in this report are generated using Mordor Intelligence’s proprietary estimation framework, updated with the latest available data and insights as of 2026.
Market Trends and Insights
Drivers Impact Analysis of Advertising Services Market*
| Driver | (~) % Impact on CAGR Forecast | Geographic Relevance | Impact Timeline |
|---|---|---|---|
| Rise of mobile-first programmatic video advertising | +2.3% | Global, led by Asia Pacific and North America | Medium term (2-4 years) |
| Expanding social-commerce and influencer ecosystems | +2.1% | Global, strongest in Asia Pacific and Europe | Short term (≤2 years) |
| Accelerating shift of SMB budgets to self-serve digital platforms | +1.8% | Global, particularly North America and Europe | Short term (≤2 years) |
| Retail-media networks monetising first-party shopper data | +3.2% | North America and Europe, expanding to Asia Pacific | Medium term (2-4 years) |
| Cookieless identity solutions boosting first-party data activation | +1.9% | Global, compliance-driven in Europe and North America | Long term (≥4 years) |
| Generative-AI creative optimisation cutting campaign cycle times | +2.0% | Global, early adoption in North America and Europe | Medium term (2-4 years) |
| Source: Mordor Intelligence | |||
Rise of Mobile-First Programmatic Video Advertising
Programmatic video revenue is projected to top USD 200 billion in 2026, and more than 90% of connected-television impressions already trade programmatically in 2025. Mobile devices account for about 70% of programmatic display spend, but growth now concentrates on video inventory inside retail and transit venues, where Place Exchange logged a 25% expansion in available screens during second-half 2024. Average digital-out-of-home CPMs climbed from USD 7.16 to USD 7.62 in the same period, signaling advertiser willingness to pay for contextually relevant video placements. United States digital-video revenue reached USD 62.1 billion in 2024, up 19.2% year-on-year, underscoring the momentum behind video formats.[1]David Cohen, “Generative AI Playbook,” Interactive Advertising Bureau, iab.com As brands pursue measurable reach across screens, the advertising services market benefits from higher average media prices and richer attribution data. Standards such as ISO/IEC 23009-1 for MPEG-DASH ensure content interoperability and further support scaled adoption across global market.
Expanding Social-Commerce and Influencer Ecosystems
Influencer marketing spend is growing 14.2% year-on-year in 2025, outpacing broader digital advertising categories. ShopMy raised USD 77.5 million in December 2024, boosting its valuation to USD 410 million and attracting more than 550 brand subscribers. Whalar Group secured funding at a USD 400 million valuation in May 2025, showing strong enterprise interest in creator-commerce infrastructure. In the United Kingdom, social commerce sales are forecast to reach GBP 6.8 billion by 2026, accounting for about 3% of total e-commerce. Deloitte advises brands to integrate product catalogs and native checkout to convert social inspiration into completed transactions. This buyer journey convergence strengthens performance attribution, elevating the advertising services market as budgets shift from awareness channels to commerce-linked formats.
Retail-Media Networks Monetising First-Party Shopper Data
Eighty-six percent of buyers say commerce media outperforms other digital options, and more than 80% are already spending or plan to spend on retail-media networks. McKinsey projects the United States commerce-media revenue to exceed USD 100 billion by 2027 at a 21% CAGR. Advertisers are reallocating budgets, with 21% shifting spend from social media, 18% from display, and 17% from search into retail media during the next year. Amazon captures more than two-thirds of programmatic retail-media spend and is now licensing its ad-tech stack to other retailers. Walmart disclosed that roughly one-third of corporate profit in the third quarter of 2024 came from advertising, demonstrating the financial upside for retailers that scale media offerings. As more brands pursue closed-loop attribution, the advertising services market accelerates because first-party purchase data improves campaign efficiency and lifts media ROI.
Generative-AI Creative Optimisation Cutting Campaign Cycle Times
Seventy-three percent of marketers intend to partner with networks that deploy generative AI, seeking quicker production, personalized messaging, and dynamic copy. The CMO Survey recorded AI usage in 17.2% of marketing activities in 2024, and adoption is accelerating as creative-suite vendors embed automation tools. Publicis Groupe formed partnerships with Adobe and Nvidia in 2025 to scale AI-driven personalization across its network. Google added asset-generation features that can cut design hours by up to 60% for display and video placements. The Interactive Advertising Bureau released a generative AI playbook to guide responsible use, emphasizing clear labeling of synthetic content. As production cycles shorten and creative variants multiply, the advertising services market enjoys faster speed-to-market and more relevant messages.
Restraints Impact Analysis of Advertising Services Market*
| Restraint | (~) % Impact on CAGR Forecast | Geographic Relevance | Impact Timeline |
|---|---|---|---|
| Escalating digital ad-fraud and invalid traffic | -1.2% | Global, acute in programmatic open exchanges | Short term (≤2 years) |
| Widespread consumer ad-blocking and fatigue | -0.9% | Global, highest in North America and Europe | Medium term (2-4 years) |
| Stricter global privacy regulations (GDPR, CPRA, PIPL) | -1.5% | Europe, North America, China | Long term (≥4 years) |
| Data-analytics talent shortage within full-service agencies | -0.7% | Global, most severe in North America and Europe | Medium term (2-4 years) |
| Source: Mordor Intelligence | |||
Escalating Digital Ad-Fraud and Invalid Traffic
Industry certification reduced fraudulent impressions by 92% in 2023, saving USD 10.8 billion, yet advertisers still lost USD 979 million to invalid traffic. Buyers are shifting spend to private marketplaces at a two-to-one ratio versus open exchanges to secure greater supply-chain transparency. Sell-side curation can obscure fee structures, so advertisers must audit partners carefully to avoid inflated costs that erode return on ad spend. AdTech merger activity rose 73% year-on-year in 2024, concentrating risk on fewer platforms that require ongoing investment in fraud-detection models. Certification frameworks from the Interactive Advertising Bureau and the Media Rating Council remain voluntary, leaving many small publishers outside the trusted ecosystem. Continued fraud drains budgets and slows the advertising services market because advertisers pad CPMs to offset potential waste.
Stricter Global Privacy Regulations (GDPR, CPRA, PIPL)
The European Commission estimates the cost of complying with cookie consent requirements at EUR 1.86 billion per year. Marketers anticipate Google Chrome will institute a broad opt-out for third-party cookies by mid-2025, accelerating signal loss across web campaigns. California’s Privacy Rights Act and China’s Personal Information Protection Law add regional governance layers that complicate global audience targeting. Data clean rooms attract interest from 90% of advertisers, yet they require costly first-party data audits and partner alignment before launch. ISO/IEC 27701 offers a voluntary privacy-management standard that agencies use to demonstrate diligence, but implementation consumes time and resources. These regulatory burdens curb experimentation and raise operating costs, which moderates growth in the advertising services market.
*Our forecasts treat driver/restraint impacts as directional, not additive. The impact forecasts reflect baseline growth, mix effects, and variable interactions.
Advertising Services Market Segment Analysis
By Platform:
Digital Dominance Continues as Retail Media ScalesOnline outlets held 61.73% of the advertising services market share in 2025 and are on track to expand at 14.11% CAGR through 2031, buoyed by programmatic automation and retail-media uptake. Offline channels remain relevant for brand storytelling, yet their proportional weight declines as advertisers pivot toward measurable formats that link impressions to conversions. Video inventory on connected television and digital out-of-home grows fastest because buyers can apply data signals historically limited to the web. Mobile continues to capture roughly 70% of programmatic display spend, although larger screens attract premium CPMs when content is streamed on living-room devices. Rising inventory costs signal stronger demand, which sustains revenue momentum for the overall advertising services market.
Offline media still supports mass-reach objectives, especially during live sports and cultural tent-pole events, but younger audiences gravitate toward streaming and social feeds. Print and radio defend high-intent niches such as luxury goods and local services, yet limited measurement hinders wider budget allocations. Advertisers now integrate QR codes and near-field technologies to bridge analog placements with digital attribution, blurring the channel divide. Digital out-of-home reaches 63% of all out-of-home spend and is projected to reach 75% by 2027, closing the gap between street-level exposure and online conversion paths.[2] As omni-channel strategies mature, the advertising services market size benefits from cross-screen frequency management that reduces waste and lifts return on ad spend.


By Advertising Channel:
Social Leads but Retail Media AcceleratesSocial-media publishing commanded 29.36% share in 2025, reflecting its ability to blend scale, targeting and native checkout flows.[3]James Chandler, “IAB Compass: Navigating Digital Advertising,” IAB UK, iabuk.com Retail media, however, posts the fastest growth at 13.73% CAGR to 2031 as first-party shopper data proves more predictive than third-party cookies. Search remains a cornerstone at USD 102.9 billion in United States revenue in 2024, yet generative answer engines are expected to dilute click-through rates over time. Display and online video earned USD 62.1 billion in 2024 and continue to advance on the back of connected-television adoption. Influencer and creator marketing grows 14.2% annually as brands seek authentic peer endorsement at lower production cost.
Native, television, radio, print, outdoor and direct mail round out the mix, often serving as either top-of-funnel awareness or hyper-local conversion triggers. Programmatic buying now covers most display, video and audio impressions, giving planners granular control over reach and frequency. Retail media’s closed-loop reporting attracts budgets from social, display and search, changing the historical hierarchy among channels. As commerce networks proliferate, advertisers diversify spend across five or more retail platforms on average, intensifying competition for inventory. The advertising services market size therefore expands on both incremental spend and higher unit pricing tied to verified outcomes
By End-User Industry:
Retail Dominates While Healthcare Gains SpeedRetail, including grocery, delivered 20.86% of global spend in 2025, leveraging omnichannel strategies that synchronize in-store promotions with e-commerce search and retail-media placements. Healthcare and pharmaceuticals record the fastest 13.96% CAGR through 2031, enabled by clearer telehealth advertising rules and rising consumer interest in digital therapeutics. E-commerce and direct-to-consumer brands follow retail closely, favoring performance channels that deliver immediate sales attribution. Travel and tourism spending rebounds on pent-up demand, lifting investment in video and social storytelling that inspire bookings. Media and entertainment advertisers pour money into social and CTV to promote streaming premieres and gaming launches.
Financial services remain heavy users of search and display because comparison shopping dominates customer journeys. Automotive marketers accelerate digital budgets as electric-vehicle launches rely on targeted content rather than dealer footfall. Consumer packaged goods, technology, telecommunications and real estate complete the roster, each calibrating channel selection to purchase cycles and data availability. As verticals with strict regulation embrace digital, the advertising services market share broadens across end-user categories, reducing cyclical risk tied to any single sector.

By Agency Type:
Integrated Shops Lead but In-House Studios SurgeFull-service networks captured 25.39% share in 2025 by bundling creative, data and media under one contract. In-house brand studios, though smaller, posted a 14.02% CAGR, as 82% of companies now operate internal agencies to cut costs by up to 44% and accelerate turnarounds by 25%. Media-buying specialists still command scale-driven discounts, yet self-serve platform tools have lowered barriers for smaller advertisers. Digital-only performance agencies win assignments that hinge on programmatic expertise and conversion optimization, often partnering with creators for rapid content testing.
Creative boutiques thrive on differentiated storytelling and award aspirations, positioning themselves as innovation labs even when production is outsourced. Consulting firms such as Accenture Song and Deloitte Digital leverage enterprise systems integration to secure marketing transformation mandates, eroding the historic moat of holding companies. Hybrid models emerge as brands tap external partners selectively while keeping strategy or production in-house. Technology differentiators such as data clean rooms and generative AI toolkits influence pitch outcomes. Diversified service lines help insulate the advertising services industry from macro-economic shocks because spend can shift among agency types rather than exit the ecosystem.
Geography Analysis
North America and APAC Advertising Services Market
North America accounted for 37.94% of global revenue in 2025, lifted by the United States' internet advertising income of USD 258.6 billion and the strong adoption of retail-media networks that generated USD 53.7 billion. Canadian growth benefits from grocery and pharmacy chains launching ad platforms, while Mexico leverages near-shoring to attract multinational budgets. Asia Pacific is the fastest-growing territory at 14.54% CAGR, underpinned by India’s 20.2% annual rise to USD 14.17 billion and Southeast Asia’s video-commerce share reaching 25% of e-commerce value. China, already exceeding USD 181.7 billion with 86.1% digital penetration, continues to favor short-video and social commerce formats. Japan and Australia add stable programmatic spend, while Southeast Asian retail-media revenue nears USD 3 billion as local marketplaces monetize data at checkout. Collectively, these dynamics enlarge the advertising services market size across emerging and mature economies.
EMEA and South America Advertising Services Market
Europe contributes significant volume despite regulatory friction, with the United Kingdom’s retail-media spend set to surpass GBP 6.6 billion in 2025 and creator-marketing revenue forecast to reach GBP 2.6 billion by 2030. Germany, France, Italy, and Spain remain large buyers, yet language fragmentation and privacy rules raise operating costs. Digital out-of-home claims 63% of outdoor budgets and is projected to hit 75% by 2027, indicating sustained appetite for screen-based formats that bridge offline venues and online data. Russia experiences advertiser pullback due to geopolitical sanctions, while the Nordics and Benelux post steady gains driven by high broadband penetration. South America rebounds as Brazil’s sizable social audience draws platform investment and Argentina stabilizes currency fluctuations, encouraging more consistent media outlays. Middle East and Africa growth centers on Saudi Arabia and United Arab Emirates diversification plans, with Turkey and South Africa providing additional momentum.
APAC and Europe Advertising Services Market
Across regions, spending migrates toward channels that guarantee measurable return, reinforcing a global convergence in media strategy even as local platforms and regulations differ. Asia Pacific’s double-digit trajectory offsets slower European expansion, balancing the overall advertising services market. Multinational advertisers now allot budgets through centrally negotiated frameworks but adapt creatives to local language and cultural nuance. Currency fluctuations and privacy mandates add execution complexity, yet data clean rooms and consent-management platforms help standardize processes. As retail-media, programmatic CTV and generative AI spread worldwide, geographic growth differentials narrow, supporting sustained top-line expansion for the advertising services market share holders.

Regulatory Landscape
Advertising services operate under a tightening mix of platform transparency rules, privacy laws, and advertising substantiation requirements that affect targeting, measurement, and creative disclosures. In the European Union, the Digital Services Act (Regulation (EU) 2022/2065) places ad transparency and accountability obligations on very large online platforms, including requirements tied to ad repositories and options around profiling-based ad delivery. As a result, agencies and adtech intermediaries need to document how ads are served and targeted.
In the United States, the Federal Trade Commission (FTC) continues to set the enforcement tone for advertising practices under Section 5, reinforced by the Endorsements and Testimonials Guides (16 C.F.R. Part 255) for influencer and testimonial disclosures. The compliance bar is also rising for technology claims in marketing: in June 2026, the FTC announced a proposed order tied to allegations of deceptive AI-related claims in ad targeting, signaling heightened scrutiny of AI positioning and data-use representations. Separately, EU AI Act transparency duties (Regulation (EU) 2024/1689) introduce disclosure obligations for AI-generated content and interactions, adding new governance steps for creative production and client approvals across cross-border campaigns.
Value Chain Analysis
The advertising services value chain starts with advertiser objectives and budgets (brands and performance marketers), followed by strategy, creative development, and media planning and buying carried out by full-service agencies, media specialists, digital performance agencies, and in-house brand studios. Execution increasingly depends on data and identity infrastructure (first-party data, clean rooms, measurement and attribution stacks), plus adtech plumbing that routes demand through DSPs to supply-side partners and publishers across channels such as social, search, online video/CTV, retail media, and DOOH.
Operational bottlenecks have shifted from creative capacity to data flow, auction efficiency, and payment mechanics. Programmatic supply-chain inefficiencies such as bidstream congestion and CTV query-per-second inflation raise infrastructure and filtering costs for DSPs while complicating transparency and fee auditing. This has supported movement toward private marketplaces and curated supply paths, along with deeper integration with cloud and workflow platforms to improve governance and turnaround times, including cloud-centric supply chain modernization initiatives such as SDVI's Strategic Collaboration Agreement with AWS (March 2025) and Fremantle selecting Prime Focus Technologies with AWS to unify content operations (April 2025). As retail media and closed-loop measurement expand, retailers and platforms become more central nodes in the chain, monetizing shopper data and tightening the link between media delivery and conversion reporting.
Competitive Landscape
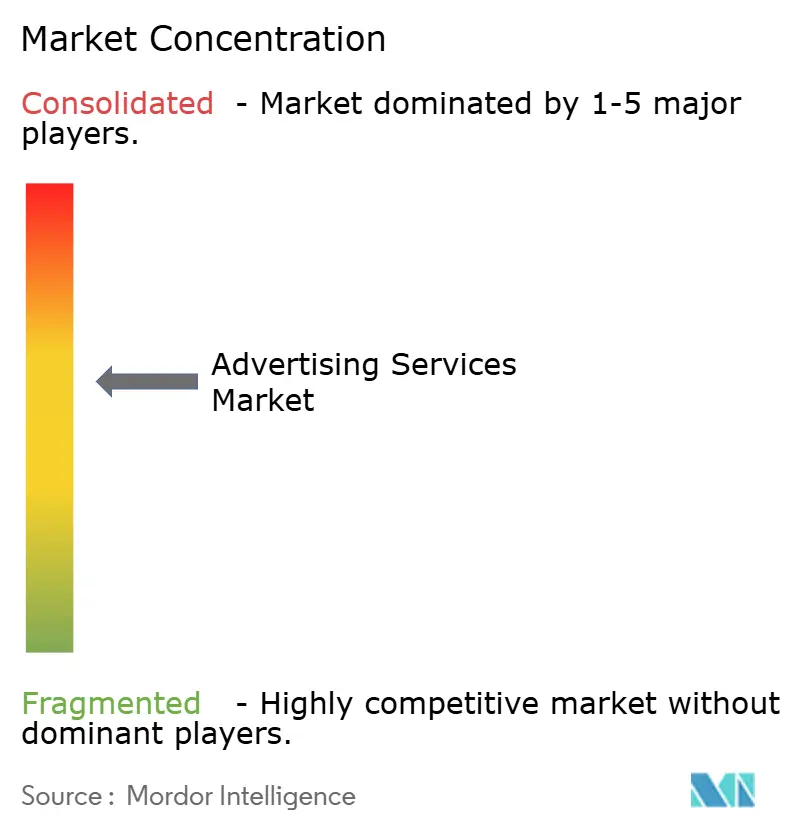
The advertising services market remains moderately concentrated, with the five largest holding companies accounting for a considerable share of global revenue. Consulting practices such as Accenture Song, Deloitte Digital, and IBM iX continue to win integrated mandates by bundling data engineering, cloud, and change management services, prompting legacy networks to pursue bolt-on deals that add commerce and influencer capabilities. Publicis Groupe completed a string of acquisitions in 2025, including Influential, Captiv8, HEPMIL Media Group, and p-value Group, to deepen creator, retail-media, and data-analytics expertise. Omnicom closed a USD 9 billion merger with Interpublic Group in November 2025, forming an entity with more than USD 25 billion in combined revenue and announcing plans to eliminate 20,000 overlapping roles.
Traditional networks are also partnering with technology vendors to sharpen automation and personalization. WPP rolled out generative-AI creative tools through Adobe Firefly pilots, while Dentsu integrated Google’s Performance Max into its global media stack to streamline campaign builds. At the same time, midsize independent agencies are gaining visibility by offering niche services such as gaming influencer strategy and multicultural retail-media buying. These specialists often become acquisition targets once they exceed USD 50 million in annual billings, providing scale networks with fresh talent pipelines.
Price competition centers on performance-based remuneration that links fees to cost-per-acquisition or return-on-ad-spend metrics. Consulting firms exploit existing enterprise relationships to secure outcome-based contracts that displace traditional retainers, while in-house studios continue to capture lower-complexity work. Consequently, top holding companies are investing in data clean rooms, privacy engineering and commerce-media monetization to defend margins and win holistic briefs that cover strategy, media, creative and customer experience. Talent shortages in advanced analytics persist, encouraging networks to establish training hubs and near-shore delivery centers that lower labor costs and widen recruitment pools.
Advertising Services Industry Leaders
WPP plc
Omnicom Group Inc.
Publicis Group S.A
Dentsu Group Inc.
The Interpublic Group of Companies Inc.
- *Disclaimer: Major Players sorted in no particular order
Advertising Services Market Companies Covered in this Report
- WPP plc
- Omnicom Group Inc.
- The Interpublic Group of Companies Inc.
- Publicis Groupe S.A.
- Dentsu Group Inc.
- Havas S.A.
- Stagwell Inc.
- Accenture plc (Accenture Song)
- Hakuhodo DY Holdings Inc.
- Deloitte Touche Tohmatsu Ltd. (Deloitte Digital)
- PwC Advisory Services LLP (PwC Digital Services)
- Cognizant Technology Solutions Corp. (Cognizant Interactive)
- IBM Corp. (IBM iX)
- Salesforce Inc. (Marketing Cloud Services)
- Lamar Advertising Company
- JCDecaux SE
- Clear Channel Outdoor Holdings Inc.
- Fiverr International Ltd.
- S4 Capital plc (Media.Monks)
- Wieden + Kennedy Inc.
- Droga5 LLC
- Serviceplan Group SE and Co. KG
- MandC Saatchi plc

Market Opportunities and Future Outlook
The market opportunity set is increasingly shaped by measurable, data-rich advertising formats and by the infrastructure needed to run them safely under privacy and transparency constraints. Retail media and commerce-linked formats create whitespace for agencies and platforms that can operationalize first-party shopper data with clean-room style collaboration and auditable measurement, especially as advertisers shift budgets from social, display, and search into commerce environments. Evidence of the monetization incentive is visible in retailer profit dynamics, including Walmart disclosing that roughly one-third of corporate profit in Q3 2024 came from advertising. This supports why more retailers build media networks and why brands diversify across multiple commerce platforms.
A second opportunity is the buildout of AI-enabled production and decisioning across the campaign lifecycle, from creative versioning to planning and optimization, paired with governance for disclosure and claims substantiation. Enterprise-grade deployments are accelerating through ecosystem partnerships, including Publicis Groupe expanding its strategic partnership with Microsoft in April 2026 to deploy agentic marketing capabilities and tooling at scale, and WPP Enterprise Solutions signing a multi-year Strategic Collaboration Agreement with AWS in June 2026 to operationalize production-grade generative and agentic AI for brands. As EU and US oversight intensifies around ad transparency, endorsements, and AI-related claims, demand increases for services that combine creative automation with compliant workflows, documented data lineage, and supply-path transparency across online video/CTV, social commerce, and retail media.
Recent Industry Developments in Advertising Services Market
- June 2026: WPP Enterprise Solutions signed a multi-year Strategic Collaboration Agreement with Amazon Web Services (AWS) to operationalize production-grade generative and agentic AI for leading brands. The agreement pushes AI enablement deeper into agency operating models, linking cloud infrastructure and marketing workflows to shorten production cycles and standardize deployment across global accounts.
- May 2026: Publicis Groupe entered an agreement to acquire LiveRamp for a total enterprise value of about USD 2.167 billion. Adding a data collaboration platform strengthens Publicis capabilities around first-party data activation and partner-safe measurement, supporting closed-loop advertising in retail media and other performance channels.
- December 2024: ShopMy raised USD 77.5 million and reported more than 550 brand subscribers, expanding creator-commerce infrastructure. The funding supports scaled influencer-led shopping experiences and adds tools that agencies and brands use to connect creator content with measurable transactions.


Advertising Services Market Report Scope and Research Methodology
Market Definition and Coverage
This market covers revenues earned from services that plan, create, place, and optimize advertising across online and offline media, for business and public sector advertisers, reported as a global value in USD.
Scope exclusions (for this sizing): We exclude unpaid organic promotion, in-house labor costs that are not billed as external services, and pure software subscription revenues where no advertising service is delivered.
Segments Covered in This Report
- By Platform
- Online
- Offline
- By Advertising Channel
- Social-media publishing
- Search-engine ads
- Display and online video
- Influencer / creator marketing
- Native advertising
- TV spots
- Radio commercials
- Print media
- Outdoor and transit (OOH / DOOH)
- Direct mail
- By End-user Industry
- Retail (incl. grocery)
- Ecommerce and DTC brands
- Travel and tourism
- Media and entertainment
- Financial services
- Healthcare and pharma
- Automotive
- Other End-user Industries
- By Agency Type
- Full-service integrated agency
- Media-buying and planning agency
- Digital-only performance agency
- Creative boutique
- In-house brand studio
- By Geography
- North America
- United States
- Canada
- Mexico
- South America
- Brazil
- Argentina
- Rest of South America
- Europe
- Germany
- United Kingdom
- France
- Italy
- Spain
- Russia
- Rest of Europe
- Asia Pacific
- China
- Japan
- India
- South Korea
- Southeast Asia
- Rest of Asia Pacific
- Middle East and Africa
- Saudi Arabia
- United Arab Emirates
- Turkey
- South Africa
- Rest of Middle East
- North America
Data Sources, Market Sizing, and Validation
Desk Research
To set the base structure of the model, we use public datasets that show advertising spend and media delivery changes by region and channel. Typical references include sources such as the US Bureau of Economic Analysis, the US Census Bureau, OECD national accounts, the International Telecommunication Union (internet and mobile penetration), and the World Bank for macro indicators that influence advertising budgets.
We also review advertiser and agency disclosures, including annual reports, earnings transcripts, and investor presentations, since they provide clues on revenue mix and channel exposure. For cross-checks, we use reputable press, trade association releases, and peer-reviewed research on ad effectiveness and media consumption shifts. Where needed, paid subscriptions for company financials and intelligence, news and financials, and patent databases are used to speed up screening and validation, but they do not replace the core model logic. This list is illustrative, and we also review many other public and internal reference points for data collection, validation, and clarification.
Primary Interviews and Surveys
Primary interviews are used to pressure-test the desk view with practitioners who see budgets and execution day-to-day, including agencies, media buying teams, ad-tech enabled service providers, and large advertisers. We also speak with functional leaders across creative, performance marketing, and planning teams, which helps confirm assumptions like channel mix, fee structures, and expected pricing changes across APAC, EMEA, and the Americas.
Distribution of primary research fieldwork respondents
| Company type | Respondent position | Region |
|---|---|---|
| Top tier: 29% | CXOs: 15% | APAC: 39% |
| Mid tier: 53% | Functional/Unit leaders: 28% | EMEA: 37% |
| Smaller Players: 18% | Managers: 57% | Americas: 24% |
Market-Sizing & Forecasting
The core model uses a top-down approach where national advertising activity is reconstructed from media spend signals and digital adoption indicators, then allocated into service revenues using observed service fee and pass-through patterns. After shaping the demand pool, we use selective bottom-up approximations to keep totals realistic, for example by rolling up sampled agency service revenues by region, checking media planning and buying intensity, and validating implied spend per advertiser.
Key inputs include advertising spend direction by channel, internet and smartphone penetration, time spent on digital media, ecommerce and retail media expansion signals, GDP and sector output trends that influence marketing budgets, and the expected shift between offline and online placements. When a country data series is missing, we handle gaps by proxying with comparable markets based on media penetration and economic structure, then revisit those assumptions during interviews. For forecasting, we run scenario analysis so base, conservative, and aggressive cases reflect different assumptions on ad budget growth, pricing in managed services, and the speed of channel migration, with the final outlook anchored to the most consistent expert consensus.
Data Validation & Update Cycle
Outputs are validated through cross-checks against independent signals, such as how fast digital penetration is rising versus the modeled online share, and whether regional growth lines up with macro indicators and category-level advertising intensity. Outliers are flagged early, and assumptions are re-checked with additional calls when implied spend or service revenue per advertiser looks inconsistent.
Before sign-off, the model goes through multi-step analyst reviews where definitions, currency handling, and year-to-year jumps are inspected, and sensitivity checks are run on the most influential variables. Reports are refreshed annually, and interim updates are triggered when material events occur, such as major regulatory changes affecting targeting, sharp macro swings, or a step-change in ad pricing. Right before delivery, we do a quick refresh pass so the numbers match the latest available public inputs.
Mordor Intelligence's Advertising Services Market Size Compared With Other Published Estimates
Published market sizes for advertising services can vary a lot, even when they appear to cover the same scope, because the boundary between ad spend, agency services, and adjacent marketing work is defined differently. Differences also come from the year used for the starting point, how online and offline mixes are treated, and how pricing or pass-through costs are counted.
By tracking channel-level demand signals and updating currency timing and service-versus-pass-through assumptions, Mordor Intelligence keeps the total tied to paid advertising services delivered across online and offline media, instead of blending in broader marketing categories or only agency-only revenues.
Benchmark comparison
| Source | Market Size | Gaps in Research Methodology |
|---|---|---|
| Mordor Intelligence | USD 1.23 T (2026) | |
| Industry Publisher A | USD 0.79 T (2025) | This estimate appears to use an earlier base year and a narrower service definition that groups advertising with a limited set of service lines, which can undercount parts of digital activation and some managed placement services. |
| Global Publisher B | USD 0.40 T (2025) | This scope is closer to advertising agencies revenue only, which is a subset of the broader advertising services ecosystem, so it does not fully capture spend routed through non-agency service models and wider execution services across channels. |
The spread in values is mostly explained by what is counted as a service and how closely the model stays to paid advertising activity by channel and region. When scope, base year, and pass-through treatment are made explicit, the resulting market size is easier to reconcile and to reuse in planning discussions.


Key Questions Answered in the Report
What is the projected revenue for the advertising services market in 2031?
It is forecast to reach USD 2.33 trillion by 2031.
Which platform segment is growing fastest?
Online environments are expanding at 14.11% CAGR through 2031, driven by programmatic video and retail media.
Why is retail media important to advertisers?
Retail media supplies first-party shopper data and closed-loop attribution, improving return on ad spend.
Which region will post the highest growth?
Asia Pacific is projected to record a 14.54% CAGR between 2026 and 2031.
How are holding companies responding to consulting-firm competition?
They are acquiring data-activation, commerce-media and influencer platforms while integrating generative-AI tools.
Page last updated on:


 Your data is secure and never sold or shared.


