
Market Overview
| Study Period | 2021 - 2031 |
|---|---|
| Market Size (2026) | USD 20.07 Billion |
| Market Size (2031) | USD 30.66 Billion |
| Growth Rate (2026 - 2031) | 8.84 % |
| Fastest Growing Market | Asia-Pacific |
| Largest Market | North America |
| Market Concentration | Medium |
Major Players *Disclaimer: Major Players sorted in no particular order Image © Mordor Intelligence. Reuse requires attribution under CC BY 4.0. | |
Advanced Biofuel Market Analysis by Mordor Intelligence
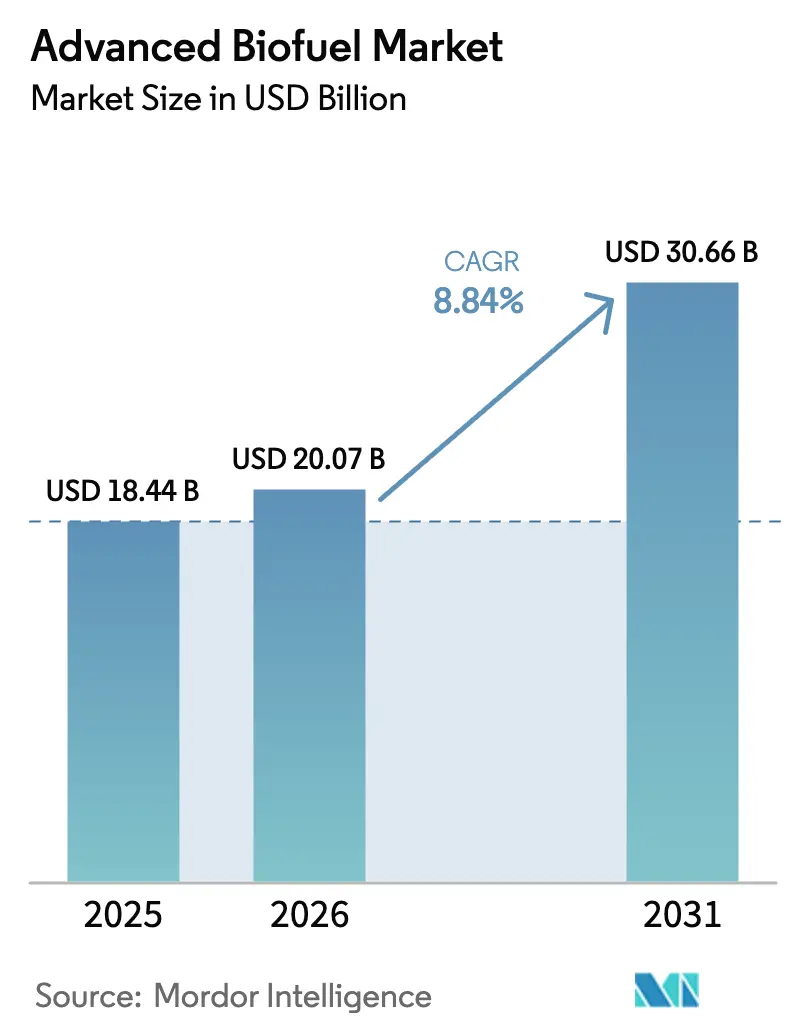
The Advanced Biofuel Market size was valued at USD 18.44 billion in 2025 and estimated to grow from USD 20.07 billion in 2026 to reach USD 30.66 billion by 2031, at a CAGR of 8.84% during the forecast period (2026-2031).
Rapid policy tightening, corporate procurement commitments, and proven drop-in compatibility lift demand across road, aviation, and industrial segments. Lignocellulosic residues anchored raw-material leadership, while breakthrough synthetic-biology platforms lowered algae cultivation costs enough to unlock the fastest feedstock growth trajectory. Renewable diesel secured first-mover advantage inside existing refinery and retail networks, yet municipal-waste-to-biomethane projects illustrate how circular-economy incentives diversify supply. Large-scale investments by oil majors and chemical incumbents signal confidence that hybrid biochemical-thermochemical routes can drive further cost reductions and yield gains. Regionally, North America leveraged decades-old renewable fuel standards to sustain capacity expansions, whereas Asia-Pacific is deploying fresh mandates that accelerate the advanced biofuel market toward double-digit growth.
Key Report Takeaways
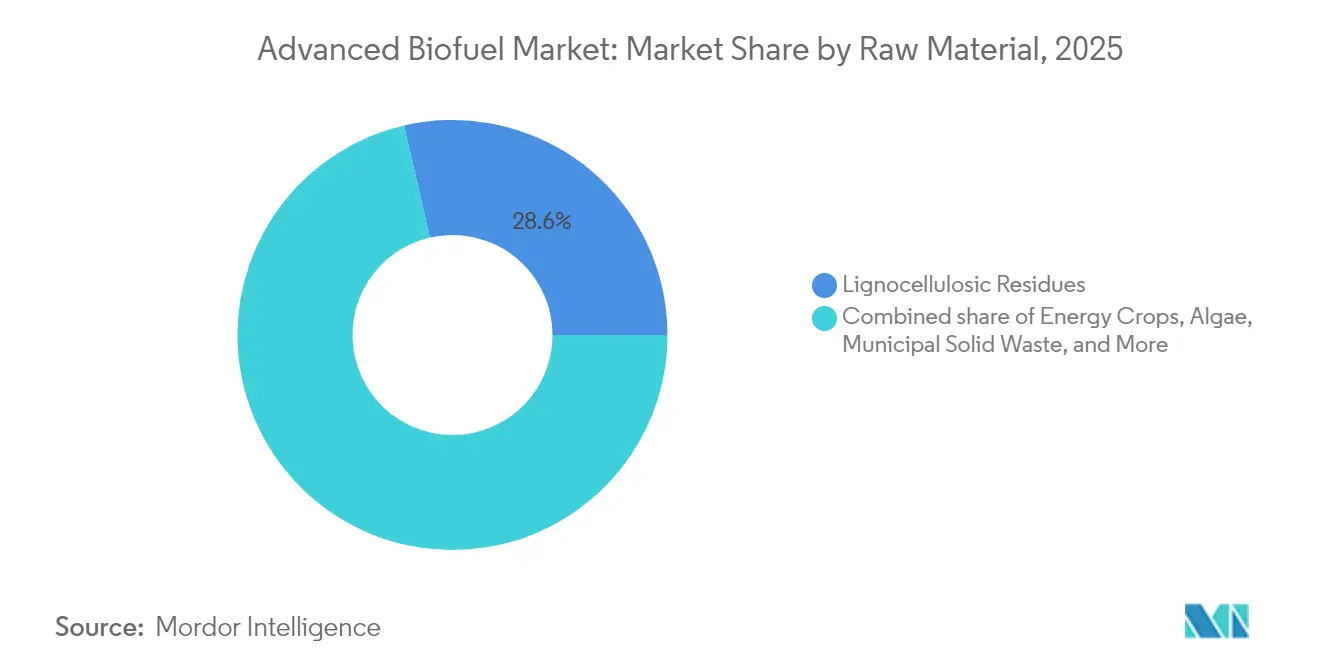
- By raw material, lignocellulosic residues led with 28.62% revenue share in 2025; algae-based feedstocks are projected to expand at a 14.92% CAGR through 2031.
- By biofuel type, renewable diesel held 45.38% of the advanced biofuel market share in 2025, while biogas/biomethane is set to post the highest 12.11% CAGR to 2031.
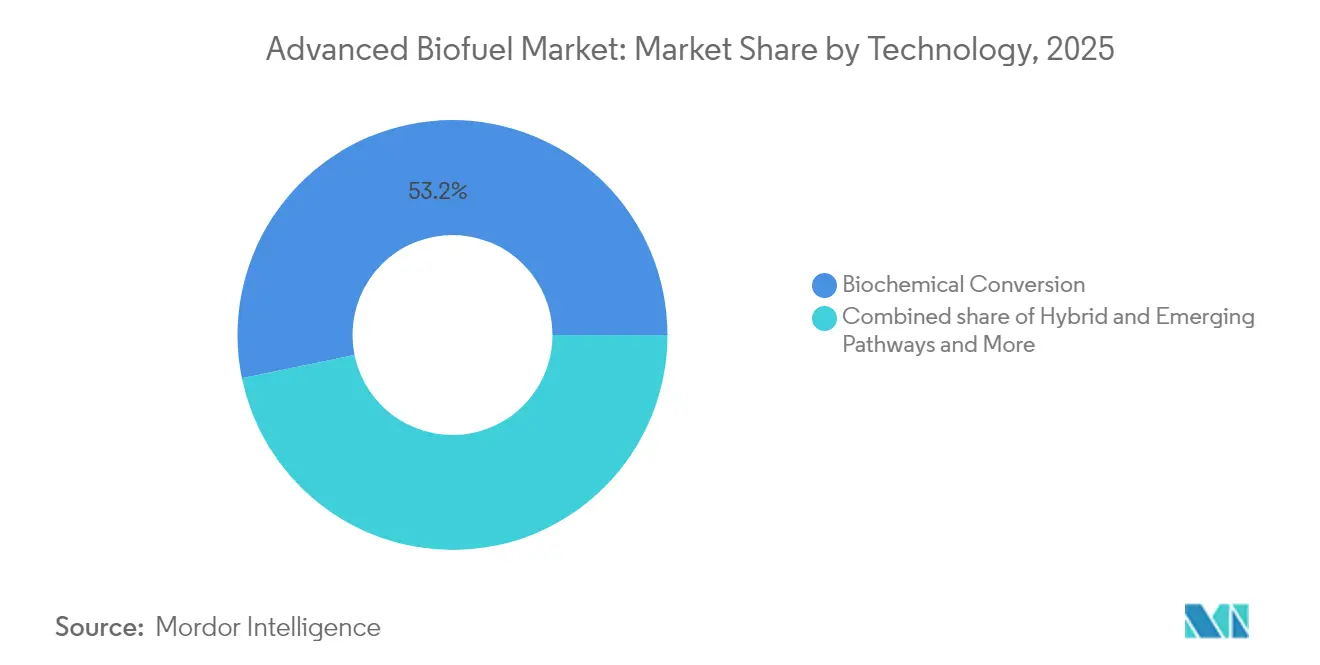
- By technology, biochemical conversion accounted for 53.22% of the advanced biofuel market size in 2025, and hybrid + emerging pathways are advancing at a 12.98% CAGR over the same period.
- By end-use, road transport commanded a 59.15% share of the advanced biofuel market size in 2025; sustainable aviation fuel is growing at a 13.89% CAGR to 2031.
- By geography, North America captured 38.42% revenue share in 2025; Asia-Pacific is forecast to record the fastest 12.23% CAGR through 2031.
Note: Market size and forecast figures in this report are generated using Mordor Intelligence’s proprietary estimation framework, updated with the latest available data and insights as of 2026.
Market Trends and Insights
Drivers Impact Analysis of Advanced Biofuel Market*
| Driver | (~)% Impact on CAGR Forecast | Geographic Relevance | Impact Timeline |
|---|---|---|---|
| Tightening global blending mandates | +2.10% | Global, with early gains in UK, EU, Canada | Medium term (2-4 years) |
| Surging sustainable aviation-fuel demand | +1.80% | North America & EU, spill-over to APAC | Short term (≤ 2 years) |
| Corporate net-zero procurement targets | +1.40% | Global, concentrated in developed markets | Medium term (2-4 years) |
| Carbon-negative BECCS pathways emerge | +0.90% | North America & EU, pilot projects in APAC | Long term (≥ 4 years) |
| MSW-to-bio-crude backed by zero-landfill laws | +0.70% | EU core, expanding to North America | Medium term (2-4 years) |
| Synthetic-biology cost breakthroughs | +1.20% | Global, with R&D centers in US, EU, Singapore | Long term (≥ 4 years) |
| Source: Mordor Intelligence | |||
Tightening Global Blending Mandates
National and supranational legislation is shifting from voluntary schemes to binding quotas that hard-wire demand visibility for producers. The United Kingdom’s sustainable aviation-fuel obligation rises from 2% in 2025 to 22% by 2040, supported by a revenue-certainty mechanism that could add GBP 5 billion to the economy and sustain up to 15,000 jobs. Brazil’s planned E30 gasoline blend is projected to cut greenhouse-gas emissions by 1.7 million t per year while mobilising BRL 9 billion in inbound investment.(1)Source: Government of Brazil, “National Biofuels Policy Update,” gov.br Canada’s Clean Fuel Regulation and the EU’s ReFuelEU Aviation rule likewise embed long-range offtake certainty, enabling long tenor project financing. These mandates allow capital-intensive refineries to lock in throughput volumes, lowering risk premiums and accelerating scale-up across the advanced biofuel market.
Surging Sustainable Aviation-Fuel Demand
Airline net-zero pledges translate into direct offtake agreements that bypass traditional jet-fuel distributors. DHL Express procured 7,400 t of SAF from Neste for Singapore’s Changi Airport, while Cathay Pacific is co-developing four power-to-liquids plants in China capable of 50,000-100,000 t per year each. United States SAF production doubled between December 2024 and February 2025 to about 30,000 bpd, yet still covers less than 2% of national jet-fuel demand, underscoring a sizeable supply gap. Aviation stakeholders are therefore accelerating long-term contracts that underwrite capacity expansions and technology diversification, lifting the advanced biofuel market well beyond conventional road-fuel confines.
Corporate Net-Zero Procurement Targets
Large corporations are embedding scope 3 emission cuts into purchasing policies, paying premiums for verifiable low-carbon molecules. Bank of America earmarked USD 2 billion for SAF financing and secured 1.2 million gal annually from SkyNRG, aiming for a 20% SAF mix in its corporate travel. DHL and Neste extended their collaboration toward 300,000 t annual SAF offtake by 2030. Such bilateral contracts derisk cash flows, help lenders attain green-loan certifications, and steer the advanced biofuel industry toward predictable, long-run revenue models.
Carbon-Negative BECCS Pathways Emerge
Bioenergy with carbon capture and storage transforms several pilot facilities into net-negative emission hubs. Gevo logged a −339 g CO2e/MJ carbon-intensity score at its North Dakota renewable-gas project, allowing it to monetise high-value carbon credits alongside fuel sales. SWISS and Synhelion produced solar-derived kerosene by using concentrated sunlight to convert atmospheric CO2 and water into syngas, thereby closing the carbon cycle. These breakthroughs position certain refineries to sell energy and negative-emission certificates, improving margins and boosting attractiveness to climate-focused investors across the advanced biofuel market.
Restraints Impact Analysis of Advanced Biofuel Market*
| Restraint | (~) % Impact on CAGR Forecast | Geographic Relevance | Impact Timeline |
|---|---|---|---|
| Feedstock-price volatility vs. food crops | -1.60% | Global, acute in grain-dependent regions | Short term (≤ 2 years) |
| High capex for cellulosic biorefineries | -1.20% | Global, particularly in emerging markets | Medium term (2-4 years) |
| Algal-culture scaling & contamination risks | -0.80% | Global, concentrated in R&D-intensive regions | Long term (≥ 4 years) |
| ILUC policy uncertainty in key regions | -0.90% | EU core, regulatory spillover effects globally | Medium term (2-4 years) |
| Source: Mordor Intelligence | |||
Feedstock-Price Volatility vs. Food Crops
Feedstock accounts for 60%-80% of operating expenditure, so price swings in used cooking, soybean, or corn stover can erode margins and discourage new builds. Rising demand from HVO producers and food processors pushes edible oil prices higher, sparking food security debates in developing economies. Producers diversify toward agricultural residues, municipal solid waste, and algae to buffer against commodity cycles. Algal cultivation still ranges between USD 0.43 and USD 8.75 per l, with contamination and nutrient management risks inflating costs. The resulting volatility obliges investors to demand larger contingency budgets, tempering near-term growth in the advanced biofuel market.
High Capex for Cellulosic Biorefineries
Full-scale cellulosic refineries typically require USD 200-500 million, restricting participation to oil majors, diversified chemical firms, or well-capitalised start-ups. Air Products committed USD 2 billion to expand World Energy’s Paramount, California site to 340 million gal per year, illustrating the capital depth needed for meaningful capacity. BP paused its Kwinana project in Australia when rising construction costs met an absence of robust local mandates, showing how policy weakness can derail deployment. Financing hurdles slow technology diffusion and moderate the overall advanced biofuel market CAGR outlook.
*Our forecasts treat driver/restraint impacts as directional, not additive. The impact forecasts reflect baseline growth, mix effects, and variable interactions.
Advanced Biofuel Market Segment Analysis
By Raw Material:
Residues Retain Scale, Algae Gains TractionLignocellulosic residues provided 28.62% of the advanced biofuel market share in 2025 by exploiting plentiful crop waste, sawdust, and forestry slash with minimal land-use penalty. Energy-crop acreage is expanding in lower-yield farmland where miscanthus and switchgrass offer reliable biomass tonnage and soil-health benefits. Collection networks for used cooking oil and other fats, oils, and grease tapped into restaurant chains and municipal recycling programs, but demand is now outstripping supply, driving price premiums. Therefore, the advanced biofuel market is broadening its raw-material base to municipal solid waste streams; Enerkem’s Edmonton facility illustrates how zero-landfill rules can provide steady feedstock volumes. Synthetic-biology breakthroughs have pushed microalgae productivity beyond 60 g per m² per day in closed raceways, compressing production costs and fuelling a 14.92% CAGR for algae between 2026 and 2031. Producers are layering smart harvesting, flocculation, and downstream lipid extraction to achieve yields that rival terrestrial oilseeds without competing for arable land.
Feedstock strategy is increasingly multipronged: refineries blend agricultural residues for base-load supply, add waste lipids for high-value HVO batches, and trial algae or municipal waste to secure future scalability. This hedge lowers exposure to commodity cycles and enhances eligibility for policy incentives favoring non-food inputs. As corporate buyers request life-cycle assessments with rigorous traceability, residue-based pathways strengthen their status inside the advanced biofuel market.


By Biofuel Type:
Renewable Diesel Holds Pole, Biogas AcceleratesRenewable diesel captured 45.38% revenue in 2025 thanks to drop-in compatibility with existing engines and logistics networks, allowing fleets to decarbonise without asset swaps. HEFA plants operated at high utilisation because readily available used cooking oil and tallow shorten commissioning lead time. Biogas and biomethane ride a 12.11% CAGR as anaerobic-digestion clusters spring up near landfills and large dairy operations under zero-methane-emission rules. Cellulosic ethanol remains restrained by enzyme costs, although continuous fermentation and consolidated bioprocessing are closing the cost gap. Despite its superior energy density and octane performance, biobutanol is held to niche aviation blends until capital costs fall.
Market demand aligns each fuel with end-use niches: HVO for heavy-duty transport and winter climates, SAF blends for long-haul aviation, and pipeline-quality biomethane for industrial heat. Producers that can flex between outputs are better positioned to capture value when regulation or feedstock shifts. Such optionality reinforces vertical-integration moves by oil majors, thereby deepening competitive barriers inside the advanced biofuel market.
By Technology:
Biochemical Dominates, Hybrid Platforms Scale UpBiochemical routes controlled 53.22% of the advanced biofuel market size in 2025 because fermentation and enzymatic hydrolysis are well understood and supported by robust supply chains for enzymes and yeasts. Thermochemical routes such as fast pyrolysis and gasification process virtually any carbon-based feed, but the need for high-temperature reactors and rigorous gas cleanup raises capex. Hybrid platforms are advancing at a 12.98% CAGR as developers sequence thermochemical pretreatment to unlock sugars, followed by microbial upgrading to achieve higher carbon yields.
Cathay Pacific’s four planned power-to-liquids facilities will harness renewable electricity and captured CO2 to produce SAF, creating a synthetic pathway unlinked to biomass availability. Synhelion’s heliostat field in Switzerland demonstrated that concentrated solar energy can drive endothermic reactions at 1,500 °C, lowering natural-gas consumption and operating emissions. Cross-disciplinary engineering turns refineries into flexible platforms capable of swinging between ethanol, diesel, and aviation-fuel outputs depending on price signals. The result is a tech-stack arms race across the advanced biofuel market.
By End-Use Sector:
Road Fuels Prevail, Aviation SurgesRoad transport retained 59.15% of 2025 demand as national blending quotas for diesel and gasoline continue to widen. Electrification of passenger cars is eroding long-term gasoline volumes, yet heavy-duty and off-road applications still depend on liquid drop-ins that meet power density and refueling-time constraints. Meanwhile sustainable aviation fuel volumes are climbing at 13.89% per year, driven by net-zero flight pledges, EU ReFuelEU obligations, and the United Kingdom’s escalating SAF schedule. Marine bunkering remains early-stage because on-board tank retrofits and port storage for bio-methanol or bio-LNG require significant capital.
Industrial heat and combined heat-and-power plants are integrating biomethane to comply with regional emission-trading schemes, providing an offtake outlet for refineries during aviation demand dips. This segmentation diversity cushions revenue volatility and underpins further scale in the advanced biofuel market.
Geography Analysis
North America Advanced Biofuel Market
North America delivered 38.42% of 2025 revenue after decades of policy support that created a mature credit market for low-carbon fuelsRenewable diesel capacity in the United States climbed 44% in 2023, lifting total national biofuel output to 24 billion gal per year and stimulating fresh feedstock collection hubs in the Midwest. Canada’s Clean Fuel Regulation layers a federal carbon-price signal onto provincial mandates, ensuring demand certainty even as cross-border trade arbitration with the United States persists.
APAC Advanced Biofuel Market
Asia-Pacific is on track for a 12.23% CAGR through 2031 as China, India, and ASEAN members tighten import dependency and build domestic supply lines. India’s “Biofuel Scheme-2025” offers land-use concessions and tax breaks for Bio-CNG and ethanol projects, and Bihar alone targets nine ethanol plants by 2026 that will employ 50,000 people. China’s civil-aviation regulator cleared the first commercial SAF flight in 2024, and regional airlines are now entering offtake contracts to secure supply ahead of anticipated quotas. Australia’s lagging policy environment delayed BP’s Kwinana upgrade, emphasising the decisive role of regulation in securing investment across the advanced biofuel market.
Europe Advanced Biofuel Market
Europe sustains steady growth under the Renewable Energy Directive but faces indirect land-use-change policy uncertainty that lengthens permitting cycles. Germany and France upgraded biodiesel reactors to process waste lipids, while Nordic governments embed long-term purchase commitments to shield producers from spot-price swings. The ReFuelEU Aviation mandate and national carbon taxes are expected to pull SAF demand past 5 million t by 2030. Complex life-cycle accounting rules elevate compliance costs and create a premium niche for producers with robust traceability frameworks.


Regulatory Landscape
Advanced biofuel demand is being anchored by a widening set of binding mandates that increasingly reward lifecycle GHG performance rather than pure volumetric blending. In Europe, implementation of RED III is driving national transpositions toward emissions-based obligations, with the Netherlands approving RED III transposition with an emissions-based approach retroactive to 1 January 2026, and Germany advancing proposals to tighten its GHG-reduction obligation for transport fuels in the RED III context. In aviation, the policy stack is becoming more explicit: the EU ReFuelEU Aviation rule is complemented by the United Kingdoms SAF obligation pathway (2% in 2025 rising to 22% by 2040) and a revenue-certainty mechanism launched in March 2025 to support SAF development out to 2050.
Outside Europe, North America continues to operate under long-running credit frameworks. The United States Renewable Fuel Standard (RFS) is maintained through 2025, and there is growing attention on the 45Z Clean Fuel Production Credit under the Inflation Reduction Act, while Canada is advancing decarbonisation via the federal Clean Fuel Regulations crediting structure. In Asia-Pacific, newer aviation measures are translating into clearer compliance timelines, including Singapores SAF levy framework with a 1% target effective 1 October 2026, alongside emerging SAF mandate timelines referenced for 2026-2027 in markets such as South Korea and India. Collectively, these mechanisms tighten eligibility rules around feedstocks and traceability, lifting the value of non-food pathways (lignocellulosic residues, MSW, and qualifying waste lipids) within the advanced biofuel market.
Competitive Landscape
The advanced biofuel market exhibits moderate concentration, with the top five companies controlling near-30% of installed capacity. Neste, TotalEnergies, and Chevron’s Renewable Energy Group utilise incumbent hydrotreating assets and global feedstock sourcing to dominate renewable diesel supply. Acquisition and partnership activity rose sharply in 2024-2025 as oil and gas majors sought technology access and policy-credit upside. For example, Air Products invested USD 2 billion to extend World Energy’s Paramount SAF facility, while OMV signed a strategic MoU with Airbus that targets 1.5 million t of SAF delivery by 2030.
Emerging players such as LanzaJet and Fulcrum BioEnergy specialise in Fischer-Tropsch or municipal-waste conversion and often rely on off-balance-sheet project finance backed by long-term offtake agreements from airlines or freight haulers. Technology developers, including Comstock Fuels, are marketing modular “Bioleum” refineries designed to de-risk scale-up by replicating smaller units; four such plants are planned for Malaysia at a combined USD 4 billion capex.(4)OMV Aktiengesellschaft, “OMV and Airbus Sign SAF Agreement,” omv.com
Competition is intensifying along two axes: feedstock access and proprietary process efficiency. Firms with vertically integrated supply chains secure raw material at stable prices, while those with enzyme patents, advanced catalysts, or novel reactor designs can lift yields and margins. Therefore, Patent races converge with feedstock-acquisition drives, shaping a dynamic competitive environment inside the advanced biofuel market.
Advanced Biofuel Industry Leaders
Abengoa Bioenergy
Chemtex Group
Bankchak Petroleum
Clariant Produkte GmbH
DuPont Industrial Biosciences
- *Disclaimer: Major Players sorted in no particular order

Advanced Biofuel Market Companies Covered in this Report
- Neste Oyj
- Chevron (Renewable Energy Group)
- TotalEnergies (SAFE)
- Gevo Inc.
- POET LLC
- Aemetis Inc.
- Verbio AG
- UPM Biofuels
- LanzaJet Inc.
- Fulcrum BioEnergy
- Shell plc (Biofuels)
- BP (bp Bunge Bioenergia)
- Clariant AG
- Abengoa Bioenergy
- Green Plains Inc.
- Sekab Biofuels & Chemicals
- Enerkem Inc.
- Algenol Biotech
- GranBio
- Sundrop Fuels Inc.

Market Opportunities and Future Outlook
A primary whitespace sits in turning policy-driven SAF and low-carbon diesel demand into bankable, multi-year offtake and credit strategies that can underwrite capex-heavy projects. Current evidence points to a durable mismatch between aviation demand signals and available supply. United States SAF production was cited as doubling between December 2024 and February 2025 to about 30,000 bpd, yet it still represented less than 2% of national jet-fuel demand. Corporate and airline procurement and financing are moving to address this mismatch, including Bank of America earmarking USD 2 billion for SAF financing and DHL Express procuring SAF from Neste at Singapore Changi Airport. That dynamic creates room for additional producers that can document lifecycle emissions and meet fuel-certification requirements at major hubs.
A second opportunity is in feedstock and asset-integration models that reduce cost while improving permitting and logistics outcomes. With HEFA supply chains under pressure from competing demand for waste lipids, producers are increasingly pushed toward lignocellulosic residues and municipal solid waste (MSW), along with siting strategies that draw on existing refinery infrastructure, hydrogen networks, or industrial energy systems. The investment gap highlighted in 2025, where around USD 25 billion per year was reported as below the roughly USD 100 billion per year associated with meeting global 2030 pledges, supports financing and project-structuring whitespace for platforms that combine secure feedstock access, credit optimization (RFS/Clean Fuel Regulation style systems), and scalable conversion pathways. In Asia-Pacific specifically, the activation of aviation compliance measures such as Singapores SAF levy starting 1 October 2026 provides a clear commercial trigger for local and import supply chains, supporting new hub-and-spoke distribution and blending opportunities around airports and coastal refining centers.
Recent Industry Developments in Advanced Biofuel Market
- July 2026: Bangchak Corporation announced the first supply of Thailand-produced sustainable aviation fuel SAF to Thai Airways for flight TG 409. The launch expands international SAF availability in the region and strengthens Bangchak's integrated SAF production and distribution capabilities. It enhances feedstock security and reinforces Bangchak's regional market position in Southeast Asia.
- May 2026: Bangchak Corporation completed full commercial operation of Thailand's first 100 percent HEFA-SPK SAF unit at Phra Khanong Refinery. The milestone expands commercial SAF production scale and supports Thailand's shift toward low-carbon aviation fuel. It anchors domestic SAF supply and signals a move toward broader decarbonization of the aviation sector.
- March 2026: Bangchak Corporation commenced SAF production unit commissioning at Phra Khanong Refinery. The initiation marks initial SAF production readiness at a key refinery site. It sets up subsequent full commercial operation and supply commitments.


Advanced Biofuel Market Report Scope and Research Methodology
Market Definition and Coverage
This market covers revenue generated from advanced biofuels produced from non-food and waste based feedstocks and then sold for energy use across transport and other fuel consuming sectors.
Scope exclusions: We exclude conventional, food crop based biofuels and we also exclude biofuel blending, logistics, and retail fuel margin.
Segments Covered in This Report
- By Raw Material
- Lignocellulosic Residues
- Energy Crops (e.g., Miscanthus)
- Used Cooking Oil and FOG
- Algae
- Municipal Solid Waste
- By Biofuel Type
- Cellulosic Ethanol
- Hydroprocessed Esters and Fatty Acids (HEFA)
- Renewable Diesel (HVO)
- Biogas/Biomethane
- Biobutanol
- By Technology
- Biochemical Conversion
- Thermochemical Conversion
- Hybrid & Emerging Pathways
- By End-Use Sector
- Road Transport Fuel
- Aviation Fuel (SAF)
- Marine Fuel
- Industrial Heat and Power
- By Geography
- North America
- United States
- Canada
- Mexico
- Europe
- Germany
- United Kingdom
- France
- Italy
- NORDIC Countries
- Russia
- Rest of Europe
- Asia-Pacific
- China
- India
- Japan
- South Korea
- ASEAN Countries
- Rest of Asia-Pacific
- South America
- Brazil
- Argentina
- Rest of South America
- Middle East and Africa
- Saudi Arabia
- United Arab Emirates
- South Africa
- Egypt
- Rest of Middle East and Africa
- North America
Data Sources, Market Sizing, and Validation
Desk Research
Desk research is used to map the demand pool, policy direction, and supply readiness, before any market math is finalized. We mainly refer to public sources that are repeatedly updated and have consistent definitions, such as the IEA, EIA, U.S. EPA Renewable Fuel Standard datasets, Eurostat energy statistics, and the International Civil Aviation Organization for aviation activity and fuel context.
To translate these signals into a usable model, we also review company filings and investor presentations, sustainability reports, and project announcements covered by reputed press, which help confirm capacity additions and commissioning timelines. In a few cases, paid subscriptions for company financials and intelligence, patent databases, and shipment-level trade data are used to spot-check corporate scale and cross-border flows. The desk source list is illustrative only, and many additional public references are used for data collection, validation, and clarification.
Primary Interviews and Surveys
Primary work is used to pressure-test what desk sources cannot fully answer, especially around plant utilization, feedstock constraints, and realized pricing. We speak with producers, technology providers, feedstock aggregators, distributors, and end users across key consuming regions, and then we loop back with policy and industry experts to validate mandate impacts and adoption pace.
Distribution of primary research fieldwork respondents
| Company type | Respondent position | Region |
|---|---|---|
| Top tier: 34% | CXOs: 13% | APAC: 40% |
| Mid tier: 52% | Functional/Unit leaders: 29% | EMEA: 36% |
| Smaller Players: 14% | Managers: 58% | Americas: 24% |
Market-Sizing & Forecasting
Sizing starts from a top-down build where national and regional biofuel production, consumption, and trade series are reconstructed and then filtered to the advanced pool using mandate eligible pathways and observed end use adoption. This is then corroborated with selective bottom-up approximations, where we test totals using sampled plant capacities, typical utilization bands, and indicative price ranges for key advanced fuel categories.
A few practical inputs that shape the model include renewable diesel and SAF demand signals (policy targets and airline uptake), feedstock availability indicators (used cooking oil and waste fats collection trends), commissioning and expansion timelines for commercial plants, crude oil and refining spread movements that influence blending economics, and regional compliance credit behavior where relevant. Where company level detail is incomplete, gaps are handled by using conservative utilization assumptions, proxy pricing from comparable markets, and cross-checks against trade and import dependence.
Forecasting is done using scenario analysis supported by multivariate regression on key demand drivers, where expert feedback helps choose realistic adoption curves for transport fuels and a reasonable ramp-up path for new capacity. Assumptions are rechecked across regions so the final time series stays consistent with policy timing, feedstock constraints, and project execution risk.
Data Validation & Update Cycle
Validation is done through multiple checks so the totals stay anchored to real-world signals. We compare modeled revenue against independent indicators like announced capacity, trade movement direction, and policy-driven demand targets, and then we rework any outliers that cannot be explained by pricing, utilization, or currency assumptions.
Before sign-off, the model is reviewed in steps by analysts, with variance checks across regions and end uses to ensure no double counting across adjacent fuel categories. Reports are refreshed annually, and interim updates are made when material events occur, such as major mandate changes or large plant commissioning delays. Right before delivery, a final pass is completed so clients receive the latest updated view.
Mordor Intelligence's Advanced Biofuel Market Size Versus Other Published Estimates
Published market values for advanced biofuels often vary because each publisher draws the market boundary a bit differently and also makes different choices on what price, what year, and what end uses to count. Some estimates also lean more on announced projects, which can lift totals early if utilization is assumed to ramp faster than what plants typically achieve in the first years.
By tracking pathway eligible volumes, realized ramp-up patterns, and currency timing, Mordor Intelligence keeps the estimate tied to actual advanced fuel supply and demand signals instead of counting adjacent conventional biofuels or early-stage announcements as fully monetized output.
Benchmark comparison
| Source | Market Size | Gaps in Research Methodology |
|---|---|---|
| Mordor Intelligence | USD 18.44 B (2025) | |
| Global Publisher A | USD 3.52 B (2025) | Uses a narrower interpretation that appears to focus on a subset of advanced fuel types and applications, which can exclude parts of renewable diesel and broader transport demand that are counted in a wider advanced biofuel boundary. |
| Sector Report B | USD 5.06 B (2025) | Defined around aviation and marine biofuels, so road transport and other end uses are not counted, and the scope is shaped by SAF and marine blending adoption rather than the full advanced biofuel demand pool. |
The spread across sources mainly comes down to scope and what gets treated as advanced, along with how ramp-up and pricing are applied across end uses. Our approach stays repeatable by linking the market total to observable volumes, policy eligibility, and realistic utilization, and then checking that the outcome matches independent capacity and trade signals.


Key Questions Answered in the Report
What is the current value of the advanced biofuel market?
The advanced biofuel market size was USD 20.07 billion in 2026 and is projected to reach USD 30.66 billion by 2031.
Which biofuel type leads global revenue?
Renewable diesel holds the largest 45.38% share due to seamless compatibility with existing diesel engines and retail infrastructure.
Why is sustainable aviation fuel growing faster than other segments?
Airline net-zero commitments and binding SAF mandates are driving a 13.89% CAGR, creating premium demand for verified low-carbon jet fuel.
Which region will expand most rapidly?
Asia-Pacific is forecast to grow at a 12.23% CAGR through 2031 as China, India, and ASEAN countries scale domestic production under new blending policies.
What is the main bottleneck to wider adoption?
High capital expenditure for cellulosic and hybrid biorefineries, often exceeding USD 200 million per facility, slows project roll-out despite strong policy support.
How concentrated is the competitive landscape?
The market concentration score is 6, indicating that while the top five companies control a little over 60% of capacity, there remains significant space for emerging technology developers.
Page last updated on:


 Your data is secure and never sold or shared.


