
Advanced Analytics Market Size and Share
Market Overview
| Study Period | 2020 - 2031 |
|---|---|
| Market Size (2026) | USD 69.52 Billion |
| Market Size (2031) | USD 178.93 Billion |
| Growth Rate (2026 - 2031) | 20.82 % |
| Fastest Growing Market | Asia-Pacific |
| Largest Market | North America |
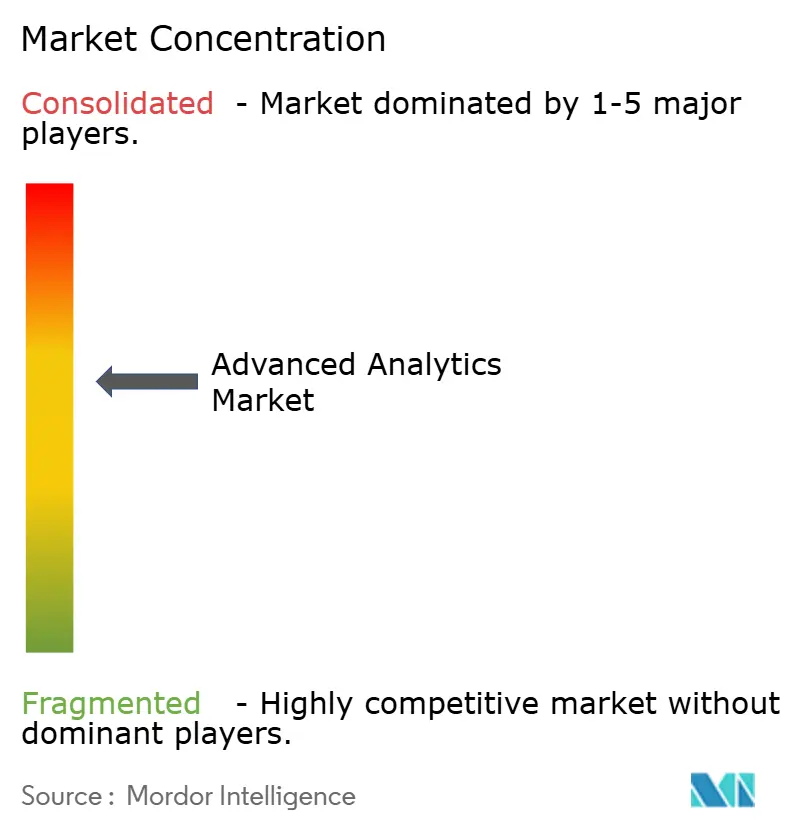
| Market Concentration | Medium |
Major Players *Disclaimer: Major Players sorted in no particular order Image © Mordor Intelligence. Reuse requires attribution under CC BY 4.0. | |
Advanced Analytics Market Analysis by Mordor Intelligence
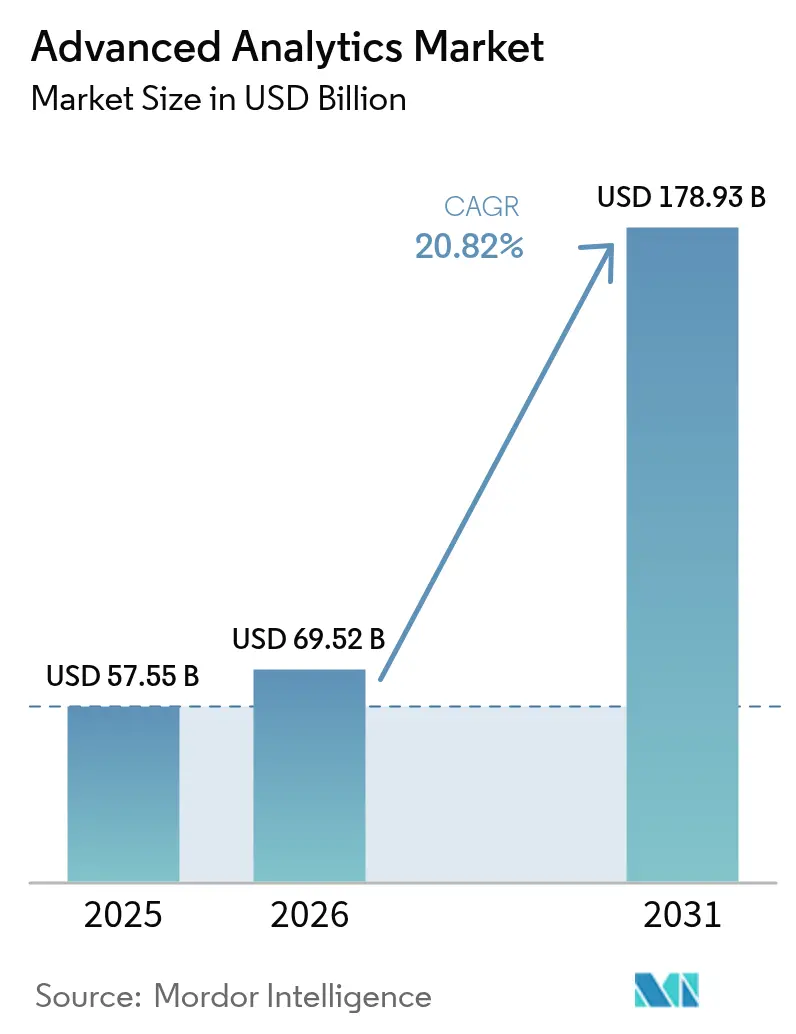
The advanced analytics market size in 2026 is estimated at USD 69.52 billion, growing from 2025 value of USD 57.55 billion with 2031 projections showing USD 178.93 billion, growing at 20.82% CAGR over 2026-2031. Surging data volumes, falling AI infrastructure costs, and urgent requirements for real-time decision support continue to expand adoption across industries. Rising fraud sophistication is accelerating demand for predictive, risk, and graph analytics, while platform consolidation is reducing customer switching costs and encouraging multi-function deployments. Edge processing is now critical for latency-sensitive use cases such as autonomous systems and industrial automation, lifting edge-analytics growth ahead of other segments. Simultaneously, explainable AI regulation in the EU is redirecting investment toward transparent, auditable models, granting compliant vendors an early-mover advantage. [1]
Key Report Takeaways
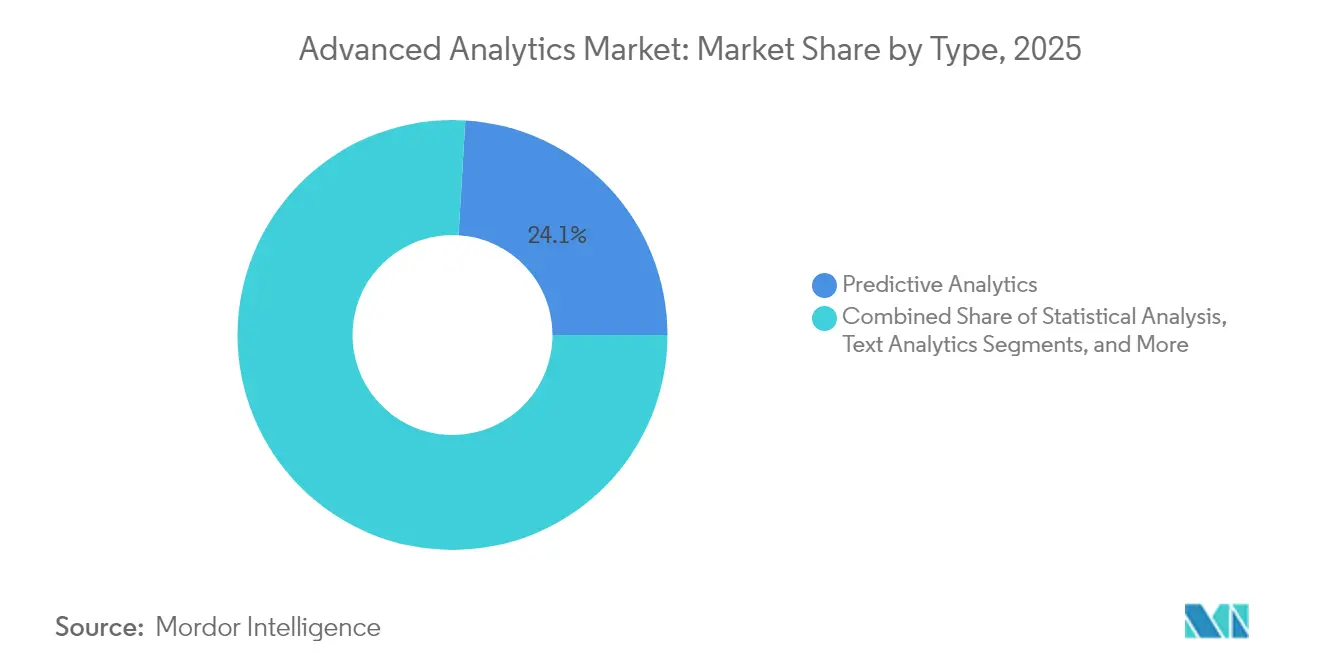
- By type, Predictive Analytics led with 24.05% of advanced analytics market share in 2025, whereas Edge Analytics is advancing at a 27.35% CAGR through 2031.
- By deployment mode, On-Premises captured 53.40% revenue share in 2025, while Cloud is projected to expand at 23.95% CAGR to 2031.
- By component, Solutions commanded 61.25% of the advanced analytics market size in 2025; Services are rising at a 22.90% CAGR through 2031.
- By business function, Sales & Marketing held 28.55% of the advanced analytics market size in 2025, but Operations & Supply-Chain will grow fastest at 22.85% CAGR.
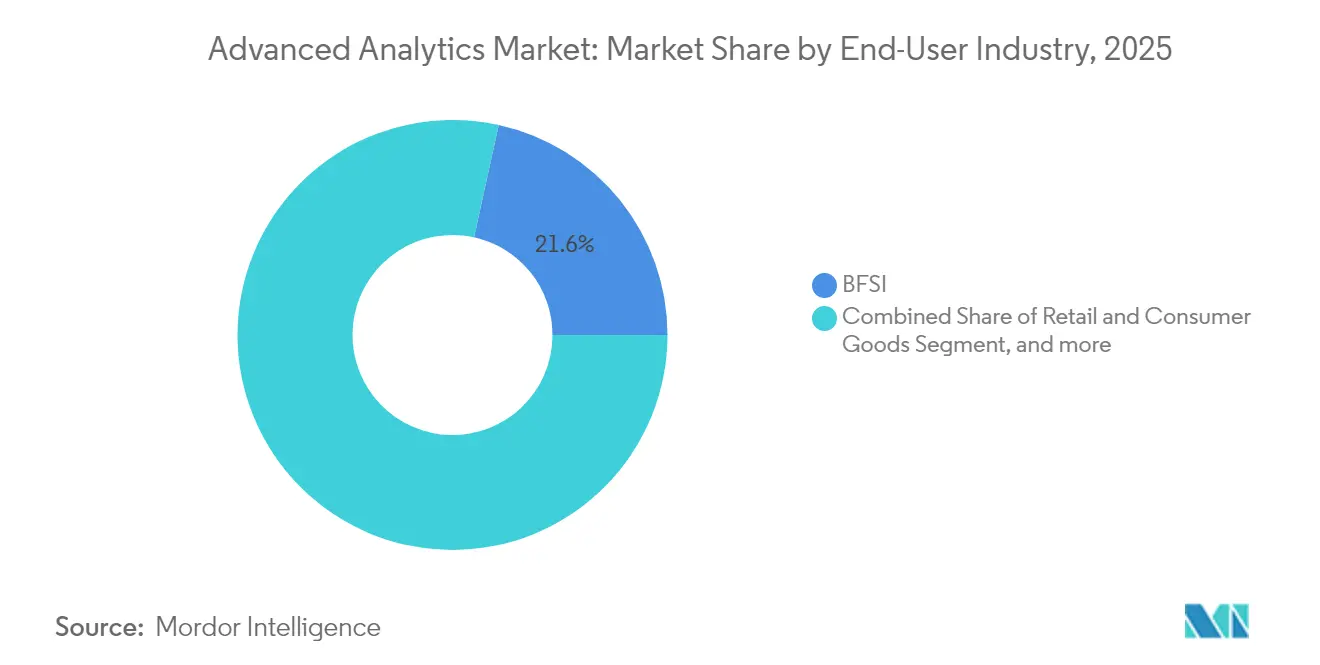
- By end-user industry, BFSI accounted for 21.55% of advanced analytics market share in 2025, whereas Healthcare & Life Sciences is growing at 23.70% CAGR.
- By organization size, Large Enterprises generated 65.10% revenue in 2025, yet SMEs are scaling at a 24.10% CAGR through 2031.
- By geography, North America retained 40.65% revenue share in 2025; APAC is forecast to climb at a 22.40% CAGR through 2031.
Note: Market size and forecast figures in this report are generated using Mordor Intelligence’s proprietary estimation framework, updated with the latest available data and insights as of 2026.
Market Trends and Insights
Drivers Impact Analysis of Advanced Analytics Market*
| Driver | (~) % Impact on CAGR Forecast | Geographic Relevance | Impact Timeline |
|---|---|---|---|
| Escalating fraud-detection needs | +4.2% | Global, with concentration in North America and EU | Short term (≤ 2 years) |
| Big-data volume and complexity explosion | +5.8% | Global | Medium term (2-4 years) |
| Enterprise digital-transformation wave | +6.1% | North America, Europe, APAC core | Medium term (2-4 years) |
| Rapid AI/ML and cloud cost declines | +3.9% | Global | Short term (≤ 2 years) |
| Edge analytics for real-time decisions | +4.7% | APAC, North America | Long term (≥ 4 years) |
| Regulatory push for explainable AI | +2.8% | EU, with spillover to North America | Medium term (2-4 years) |
| Source: Mordor Intelligence | |||
Escalating Fraud-Detection Needs
Financial institutions face highly sophisticated fraud threats that outpace rule-based systems. U.S. regulators urge AI-driven monitoring, and machine-learning models already lift detection accuracy by 40% while halving false positives. IBM research shows 95% classification accuracy when large-scale transaction data is analysed in near real time. Hybrid cloud-edge architectures satisfy sub-second latency requirements and create opportunities for providers bundling fraud analytics, compliance dashboards, and model governance into unified platforms.
Big-Data Volume & Complexity Explosion
Enterprises generated 328.77 million TB daily in 2024, overwhelming traditional BI tooling. Nearly half now employ hybrid storage and data-fabric approaches to integrate siloed sources for advanced analytics market deployments. By 2025, more than 50% of critical processing is expected outside conventional data centers, reinforcing the need for automated data preparation and augmented analytics that expose insights to non-technical business users.
Enterprise Digital-Transformation Wave
AI-first strategies are replacing incremental digitization. While 92% of companies intend to raise AI spending, only 1% deem themselves mature, elevating demand for expert implementation partners and low-code development features that speed time-to-value. Hyperautomation—where analytics, RPA, and decision models converge—further magnifies platform requirements and underpins the 23.60% services CAGR.
Regulatory Push for Explainable AI
The EU AI Act enforces algorithmic transparency, costing enterprises EUR 52,227 per high-risk AI model annually. Vendors embedding explainability and audit trails directly into analytics pipelines gain a foothold, especially within finance and critical-infrastructure domains. Extraterritorial provisions extend these obligations to global providers, elevating transparent platforms from optional to essential. [3]
Restraints Impact Analysis of Advanced Analytics Market*
| Restraint | (~) % Impact on CAGR Forecast | Geographic Relevance | Impact Timeline |
|---|---|---|---|
| Data integration and connectivity gaps | -3.4% | Global, particularly in legacy-heavy industries | Medium term (2-4 years) |
| Shortage of data-science talent | -2.8% | Global, acute in North America and Europe | Long term (≥ 4 years) |
| Sustainability limits on compute energy | -1.9% | EU, California, with global implications | Long term (≥ 4 years) |
| Vendor lock-in to hyperscale clouds | -2.1% | Global | Medium term (2-4 years) |
| Source: Mordor Intelligence | |||
Data Integration & Connectivity Gaps
Fragmented architectures often trap data across aging on-premises, cloud, and operational-technology systems. Organizations allocate 64% of engineering time to integration rather than analysis, delaying returns and dampening enthusiasm for large-scale projects. Industrial firms battle proprietary protocols that complicate analytics linkages, reinforcing the premium placed on data-fabric and no-code integration solutions.
Shortage of Data-Science Talent
Universities do not graduate enough professionals skilled in statistics, coding, and domain knowledge. Smaller firms struggle to attract scarce experts, so they adopt automated ML and managed-service models, fuelling the services CAGR. Remote hiring alleviates location constraints yet introduces coordination overhead that prolongs deployment cycles.
*Our forecasts treat driver/restraint impacts as directional, not additive. The impact forecasts reflect baseline growth, mix effects, and variable interactions.
Advanced Analytics Market Segment Analysis
By Type:
Edge Analytics Drives Highest CAGREdge Analytics owns a 27.35% CAGR to 2031, reflecting its role in latency-critical IoT scenarios. In contrast, Predictive Analytics retained 24.05% advanced analytics market share in 2025 as the mainstream choice for forecasting. Edge devices perform localized inference, cutting network costs and ensuring data sovereignty, which is vital for regulated verticals. Automotive, energy, and manufacturing players are embedding compact inference chips to enable anomaly detection and autonomous control loops. Vendors differentiate through federated-learning capabilities that train global models without raw-data egress. Text and Visual Analytics hold steady adoption as unstructured data volumes balloon, while Prescriptive and Risk Analytics are spurred by demand for optimization and scenario modelling.
The advanced analytics market size for Edge Analytics is poised to expand rapidly as 5G coverage broadens. Critical infrastructure owners shift from centralized clouds to distributed mesh fabrics that push decision logic to turbines, substations, and vehicles. Meanwhile, established predictive platforms are integrating real-time data streams to avoid obsolescence, illustrating the market’s pivot toward hybrid cloud-edge designs

By Deployment Mode:
Cloud Growth Outpaces On-PremisesOn-Premises architectures, favored by banks and public agencies, accounted for 53.40% revenue in 2025 largely due to data-sovereignty mandates. Still, Cloud deployment is rising at 23.95% CAGR as enterprises pursue elastic scaling and pay-as-you-go economics. Hyperscalers prioritize GPU fleet expansion, though intermittent capacity shortfalls create openings for specialized analytics clouds and colocation-edge hybrids.
Security improvements and confidential-compute services steadily erode customer objections. The advanced analytics market size for cloud workloads gains further lift from managed model-ops suites that automate drift detection, versioning, and governance. Hybrid scenarios blend sensitive on-premises data processing with burst-to-cloud training cycles, ensuring compliance without capping innovation. Regional data-residency laws now shape provider buildouts, particularly in the EU and APAC, where in-country zones address privacy statutes.
By Component:
Services Reflect ComplexitySolutions platforms generated 61.25% of revenue in 2025 by bundling visualization, data prep, and model-building features. Yet the services segment accelerates at 22.90% CAGR because enterprises need road-mapping, change management, and industry-specific model tuning. Consulting teams specialize in regulated sectors, delivering explainability, bias testing, and scenario analysis for auditors. As customer churn shifts toward outcome-based engagements, managed-service contracts secure multi-year recurring fees.
The advanced analytics market size for professional services grows alongside platform spending as firms outsource continuous model refinement and integration. Hyperscalers now embed partner ecosystems to co-deliver vertical templates, compressing deployment timelines. Meanwhile, open-source frameworks push software margins lower, intensifying competition on advisory and managed offerings.
By Business Function:
Operations Analytics Gains MomentumSales & Marketing led revenue in 2025 by targeting personalization and campaign optimization use cases. Operations & Supply-Chain analytics, however, is projected to record a 22.85% CAGR, as inflationary pressure compels real-time cost control. Predictive maintenance and dynamic inventory balance algorithms drive manufacturing savings of 10%-20%. Finance & Risk teams continue to expand model-driven compliance reporting, while HR analytics grows via retention pattern mining and DEI metrics.
The advanced analytics market responds with cross-functional platforms unifying data definitions and metrics libraries. Integrated suites allow frontline staff to embed visual insights within workflow apps, amplifying adoption beyond analytics centers of excellence. Citizen-developer features further reduce IT bottlenecks and accelerate experimentation cycles.
By End-User Industry:
Healthcare AcceleratesBFSI dominated in 2025 with 21.55% revenue share due to fraud, AML, and credit-risk workloads. Healthcare & Life Sciences, backed by FDA clearance for 223 AI-enabled devices, leads growth at 23.70% CAGR. Clinical decision support, imaging analysis, and personalized medicine all require transparent, high-accuracy models compliant with health regulations.
Manufacturers leverage digital twins and predictive yield analytics to trim waste, while Retailers deploy recommendation engines and price-optimization tools. Telecom providers rely on network anomaly detection, and Energy utilities use grid-state prediction to balance renewables. Defence agencies pursue intelligence fusion and autonomous systems, though procurement complexity slows volume scaling.
By Organization Size:
SMEs Scale RapidlyLarge Enterprises captured 65.10% revenue in 2025 by funding multi-function deployments and maintaining skilled data-science teams. Small and Mid-Sized Enterprises lift adoption at 24.10% CAGR due to SaaS subscription pricing and automated ML that hides complexity. Citizen-data-scientist features accelerate ROI for resource-constrained firms, broadening the advanced analytics market footprint.
Vendor roadmaps increasingly target SMEs with industry-specific starter kits and usage-based billing. Services partners bundle quick-start packages combining data integration, template dashboards, and continuous tuning, shortening sales cycles. Talent shortages hit SMEs hardest, boosting demand for managed analytics that supply both technology and expertise.
Geography Analysis
North America Advanced Analytics Market
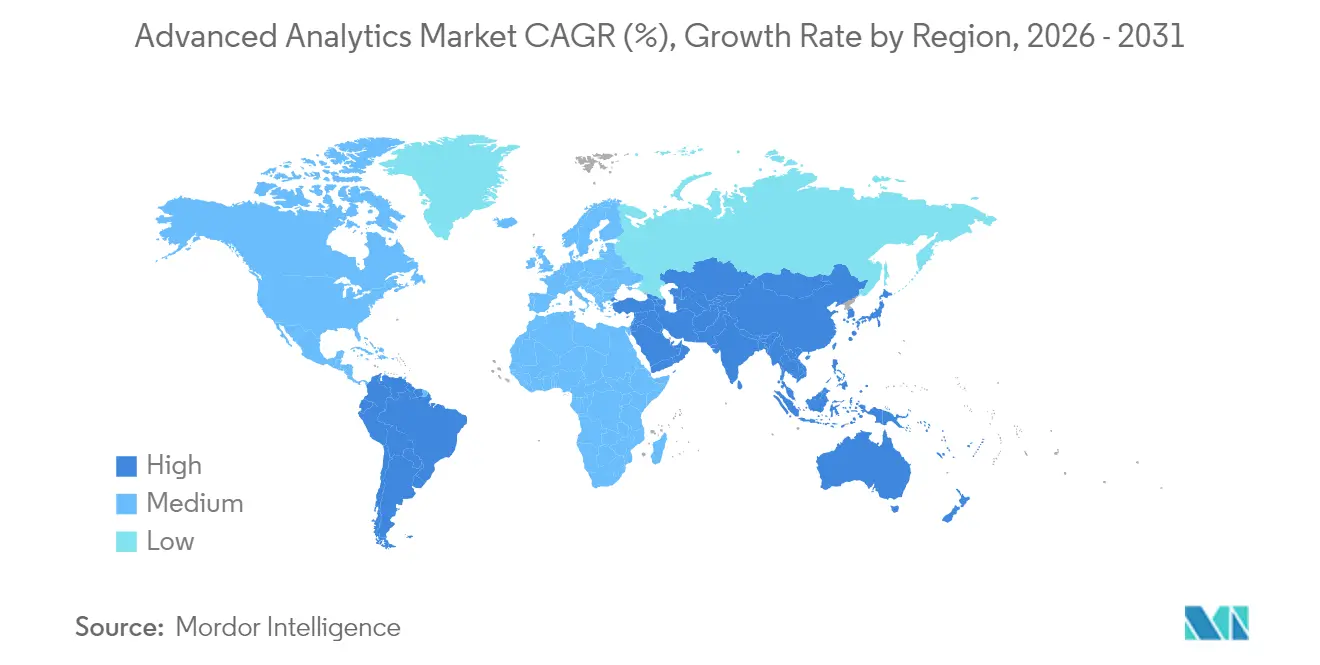
North America continued to command 40.65% of advanced analytics market revenue in 2025. Venture capital channelled USD 109.1 billion into AI, including USD 33.9 billion for generative models, expanding startup ecosystems and enterprise experimentation. U.S. hyperscalers address prior capacity constraints by injecting new GPU clusters, with Amazon’s USD 20 billion Pennsylvania build-out illustrating the scale of investment. Regulatory initiatives, though numerous, remain fragmented, prompting demand for governance add-ons that interpret divergent federal and state requirements.
APAC Advanced Analytics Market
APAC posts the highest 22.40% CAGR, propelled by manufacturing automation, 5G rollouts, and government smart-city grants. Chinese AI-model enhancements create competitive domestic alternatives, while India’s IT-services exports deliver implementation talent to regional manufacturers. Japan and South Korea push deep into edge-analytics applications for industrial robotics and autonomous mobility. Lower total-cost-of-ownership and public-sector digitalization policies expand the advanced analytics market across Southeast Asian nations integrating ecommerce, fintech, and logistics platforms.
Europe Advanced Analytics Market
Europe grows steadily under rigorously evolving policy. The EU AI Act accelerates purchases of explainable platforms to satisfy transparency rules, especially in critical sectors. Germany’s automotive and machinery firms adopt predictive and prescriptive analytics for Industry 4.0, while Nordic utilities embed sustainability analytics to optimize renewables. United Kingdom financial institutions invest in risk-model governance post-Brexit. The advanced analytics market size in Europe benefits from cross-border data-space initiatives that harmonize sharing standards among member states, yet compliance workloads elongate deployment cycles.
Regulatory Landscape
Advanced analytics deployments are increasingly governed through risk-based AI rules and sector-led standards that emphasize transparency, auditability, and consumer protection. In the European Union, the EU AI Act establishes obligations for high-risk systems and applies broadly to providers serving EU users, elevating explainability and documentation from best practice to procurement requirements; the Act reaches full application on August 2, 2026, with earlier provisions already taking effect in 2024/2025. Alongside this, the United States has leaned on standards-driven guidance such as NIST's AI Risk Management Framework (AI RMF) to structure organizational risk controls for AI-enabled analytics.
Sector regulators are also formalizing AI/ML use in operational enforcement and service quality. In India, the Telecom Regulatory Authority of India (TRAI) issued a February 2026 direction to institutionalize AI/ML-based intelligence for detecting unregistered commercial communication (UCC), reinforcing demand for real-time detection, graph/pattern analytics, and governance within telecom data environments. In the United Kingdom, the Department for Science, Innovation and Technology (DSIT) set 2026/27 growth goals for Ofcom that include generating insights for responsible AI innovation and adoption in telecoms, signaling a policy stance that encourages AI-enabled analytics while maintaining oversight expectations for safety and compliance.
Value Chain Analysis
The advanced analytics value chain spans data generation and capture (enterprise applications, IoT/OT systems, customer channels), data aggregation and management (connectors, ETL/ELT, data fabric/lakehouse), model development and orchestration (ML frameworks, MLOps, feature stores, governance), and delivery layers where insights are consumed (dashboards, embedded analytics, APIs, and automated decisioning). Hyperscalers and infrastructure providers supply cloud compute, storage, and GPU capacity that underpin large-scale training and real-time inference, while software vendors package these capabilities into analytics platforms and vertical solutions. System integrators and consulting partners provide implementation, migration, and managed services, which is critical when customers must integrate hybrid estates and meet audit and explainability requirements.
Bottlenecks increasingly sit in data readiness and operational resilience rather than algorithm availability. Marsh reported via its Sentrisk platform (January 2026) that 65% of companies face at least one supply chain bottleneck, reinforcing the need for analytics-driven visibility and control-tower approaches that connect multi-tier data sources and surface exceptions in real time. At the same time, supply constraints and policy frictions around advanced compute (including AI chip technologies and manufacturing tools) can influence infrastructure lead times and cost structures, pushing buyers toward hybrid architectures, cloud portability, and workload placement strategies that balance performance, sovereignty, and continuity.
Competitive Landscape
The advanced analytics market features moderate fragmentation. Incumbent platform providers IBM, Microsoft, SAS, and Oracle exploit broad portfolios and entrenched enterprise relationships. Hyperscalers AWS, Google Cloud, and Microsoft Azure add pressure by offering integrated compute, storage, and managed model services, eroding traditional licensing models. Disruptors focus on automated machine learning, domain-specific cloud analytics, and real-time edge-processing stacks.
Platform consolidation shapes strategy: vendors acquire adjacent capabilities such as data-fabric layers, MLOps orchestration, and embedded BI to lock in customers. FICO’s awards program spotlights ecosystem partners Fujitsu, TSYS, and TCS that extend its platform into regional niches. USPTO’s AI strategy underlines government interest in protecting domestic AI innovations, indirectly bolstering R&D commitments. Competition revolves around feature completeness, cloud portability, and regulatory compliance assurances.
Price competition intensifies as open-source frameworks reach enterprise maturity, shifting differentiation toward service level guarantees and domain expertise. Edge-analytics specialists pitch ultra-low latency and ruggedized form factors, winning pilots in manufacturing and energy. Meanwhile, consultancies team with software vendors to deliver turnkey outcomes, capturing services revenue that traditional license sellers risk losing.
Advanced Analytics Industry Leaders
-
IBM Corporation
-
SAS Institute Inc.
-
SAP SE
-
Oracle Corporation
-
Microsoft Corporation
- *Disclaimer: Major Players sorted in no particular order
Advanced Analytics Market Companies Covered in this Report
- IBM Corporation
- Microsoft Corporation
- SAS Institute Inc.
- SAP SE
- Oracle Corporation
- Amazon Web Services (AWS)
- Google LLC
- Salesforce Inc. (Tableau)
- Teradata Corporation
- QlikTech International AB
- MicroStrategy Incorporated
- Alteryx Inc.
- KNIME AG
- RapidMiner Inc.
- TIBCO Software Inc.
- Altair Engineering Inc.
- Sisense Inc.
- Domo Inc.
- Fair Isaac Corporation (FICO)
- Avanade Inc.
Market Opportunities and Future Outlook
Governed, auditable analytics and AI operations represent a clear whitespace as compliance obligations become explicit and cross-border. The EU AI Act's move to full application on August 2, 2026 strengthens demand for platforms that embed explainability, documentation, model inventorying, and monitoring into analytics pipelines, especially in regulated end users such as BFSI and critical infrastructure. Enterprise spend is also shifting toward operationalization, where analytics connects to workflows and remediation, aligning with rising adoption of MLOps, decision intelligence, and agentic assistance inside analytics suites.
Infrastructure modernization and scaling compute capacity are translating into broader deployment scope for advanced analytics across industries and geographies. KPMG's TMT Monitor 2026 reports 92% of TMT companies are using AI, while only 10% have a fully developed integrated AI strategy, indicating substantial room for services-led programs that combine data integration, governance, and production operations. In parallel, hyperscaler investment cycles to expand GPU clusters and data center capacity reduce practical constraints on large-model training and real-time inference, which supports higher-velocity use cases such as fraud detection, edge/near-edge decisioning, and network and supply chain control towers that consolidate data across suppliers, production, and logistics.
Recent Industry Developments in Advanced Analytics Market
- June 2026: IBM introduced IBM Planning Analytics Agent in Planning Analytics Workspace releases (2.1.21 and 3.1.9). The update adds agent-based assistance to planning and forecasting workflows, pushing advanced analytics closer to decision execution rather than standalone reporting.
- June 2025: Amazon announced a USD 20 billion investment in Pennsylvania to expand AI infrastructure and create 1,250 skilled jobs. The build-out directly supports advanced analytics by expanding GPU and data center capacity that enterprises rely on for training and real-time inference at scale.
- May 2024: NIST advanced its AI governance baseline through the AI Risk Management Framework (AI RMF) program, which organizations use to structure risk controls for AI-enabled analytics. The framework strengthens vendor and buyer focus on measurable governance practices such as documentation, monitoring, and accountability across model lifecycles.
Advanced Analytics Market Report Scope and Research Methodology
Market Definition and Coverage
This market is defined as revenue generated from advanced analytics software and related services that help organizations predict outcomes, optimize decisions, and automate actions using statistical and AI-based methods on structured and unstructured data.
Scope exclusions: We exclude basic reporting and descriptive dashboards that do not materially use predictive, prescriptive, or cognitive techniques.
Segments Covered in This Report
- By Type
- Statistical Analysis
- Text Analytics
- Risk Analytics
- Predictive Analytics
- Prescriptive Analytics
- Visual Analytics
- Network Analytics
- Geospatial Analytics
- Social Media Analytics
- Edge Analytics
- Other Types
- By Deployment Mode
- On-Premise
- Cloud
- Hybrid
- By Component
- Solutions
- Services
- Consulting
- Managed Services
- By Business Function
- Sales and Marketing
- Finance and Risk
- Operations and Supply-Chain
- Human Resources
- Customer Support
- By End-User Industry
- BFSI
- Retail and Consumer Goods
- Healthcare and Life Sciences
- IT and Telecommunication
- Transportation and Logistics
- Government and Defense
- Manufacturing
- Energy and Utilities
- Media and Entertainment
- Other Industries
- By Organization Size
- Large Enterprises
- Small and Mid-Sized Enterprises (SMEs)
- By Geography
- North America
- United States
- Canada
- Mexico
- South America
- Brazil
- Argentina
- Rest of South America
- Europe
- United Kingdom
- Germany
- France
- Italy
- Rest of Europe
- Asia-Pacific
- China
- Japan
- India
- South Korea
- Rest of Asia-Pacific
- Middle East
- Israel
- Saudi Arabia
- United Arab Emirates
- Turkey
- Rest of Middle East
- Africa
- South Africa
- Egypt
- Rest of Africa
- North America
Data Sources, Market Sizing, and Validation
Desk Research
Desk work starts by building a clean fact base on enterprise IT spending, cloud adoption, and AI and data infrastructure direction. For this, we rely on public and official sources such as the US Bureau of Economic Analysis, US Census Bureau business and trade datasets, Eurostat, OECD digital economy indicators, and the World Bank, which helps anchor macro and regional growth patterns.
We then map how advanced analytics gets bought and deployed across industries using SEC filings, annual reports, investor presentations, product documentation on company websites, and reputable press coverage of major deployments. Select paid subscriptions are used only to speed up company financials and intelligence checks, patent landscape scans, and import and export shipment-level signals where relevant to data-center and hardware-linked demand. The examples listed here are illustrative and not exhaustive, and many other public materials were also used for collection, validation, and clarification during the study.
Primary Interviews and Surveys
Primary work was used to pressure-test desk assumptions, especially what buyers actually budget for and how pricing shifts between license, subscription, and managed service contracts. We spoke with analytics platform providers, system integrators, and enterprise users across major regions so that adoption patterns and spend mix could be cross-checked before finalizing the market model.
Distribution of primary research fieldwork respondents
| Company type | Respondent position | Region |
|---|---|---|
| Top tier: 27% | CXOs: 14% | APAC: 46% |
| Mid tier: 55% | Functional/Unit leaders: 41% | EMEA: 35% |
| Smaller Players: 18% | Managers: 45% | Americas: 19% |
Market-Sizing & Forecasting
Our core sizing starts with a top-down build where enterprise software and IT services spending pools are reconstructed by region and then filtered using adoption and usage indicators tied to advanced analytics workloads. To keep it realistic, the model uses a limited set of inputs that can be refreshed, such as cloud and on-premise mix, AI and data platform rollout pace, analytics seat and workload expansion in large enterprises versus SMEs, and the shift from one-time licenses to subscriptions and managed services.
Results are then corroborated with selective bottom-up approximations, including sampled vendor revenue disclosures, channel checks with integrators, and ASP-by-volume logic for common contract types. When coverage gaps show up in bottom-up references, such as private firms with limited disclosures, we fill them using peer multiples and workload-based sanity checks before totals are finalized. For forecasting, we lean on scenario analysis supported by expert views on cloud migration speed, regulatory attention on explainable AI, and budget sensitivity across industries, and then year-by-year growth is smoothed so that jumps are explained by clear demand signals rather than math alone.
Data Validation & Update Cycle
Validation is done in layers so the final number is not dependent on one assumption. Model outputs are compared against independent signals such as enterprise IT spend direction, cloud services momentum, and disclosed analytics and AI revenue commentary, and then large variances are investigated before sign-off.
Anomaly checks are run at the regional level and across major use cases to confirm the growth shape makes sense. A second analyst review is used to challenge inputs like adoption rates and pricing progression. If an assumption materially shifts or conflicts with new evidence, we re-contact relevant respondents and revise the model. Reports are refreshed annually, and interim updates are made when material events affect demand, supply, or pricing, followed by a final freshness pass right before delivery.
Mordor Intelligence's Advanced Analytics Market Estimate Compared With Other Published Estimates
Published market sizes for advanced analytics often do not match because the definitions are not uniform, and because the revenue counted can shift between software-only, services-heavy, and broader data and AI toolkits. Differences also come from the year used for currency conversion, how fast subscription pricing is assumed to expand, and whether estimates are refreshed after major enterprise spending changes.
Some external figures appear to fold in adjacent categories like broader business intelligence stacks, data management tooling, or large bundles of consulting services sold under transformation programs. For Mordor Intelligence, revenue is counted only for advanced analytics platforms and closely tied services that deliver predictive, prescriptive, or cognitive outcomes, and basic descriptive reporting is kept out so the demand pool stays consistent.
Benchmark comparison
| Source | Market Size | Gaps in Research Methodology |
|---|---|---|
| Mordor Intelligence | USD 57.55 B (2025) | |
| Global Consultancy A | USD 94.63 B (2025) | Uses a broader revenue lens that can include wider analytics categories and a fuller services envelope, which can lift totals versus a platform-and-advanced-technique-only view. |
| Industry Research Group B | USD 148.89 B (2025) | Appears to capture a wider set of analytics types and applications, and may include more bundled solution revenue across industries, which changes what is counted as advanced analytics. |
The spread in the table is mainly explained by what gets counted as advanced analytics revenue and how much adjacent tooling and services are pulled into the total. By keeping the scope tied to identifiable advanced techniques and then validating growth with buyer and supplier checks, the resulting number stays easier to replicate and track over time.
Key Questions Answered in the Report
What is the current value of the advanced analytics market?
The market is valued at USD 69.52 billion in 2026 and is projected to reach USD 178.93 billion by 2031, growing at a 20.82% CAGR.
Which analytics type is growing fastest?
Edge Analytics shows the highest growth, advancing at a 27.35% CAGR due to rising demand for sub-millisecond, on-device decision-making.
Why are services growing faster than software sales?
Complex deployments, talent shortages, and regulatory requirements push enterprises to seek consulting and managed services, driving a 22.90% CAGR for services revenue.
How does the EU AI Act influence vendor selection?
Mandatory transparency rules favour platforms with built-in explainability and audit trails, shifting European buying criteria toward compliant solutions.
Which region will expand most rapidly?
APAC leads with a forecast 22.40% CAGR, propelled by manufacturing automation, smart-city initiatives, and supportive government policies.
What is the biggest barrier to wider analytics adoption?
Data integration challenges remain the primary restraint, accounting for a 3.4-percentage-point drag on the global CAGR due to fragmented legacy systems and governance complexity.