
Adult Malignant Glioma Therapeutics Market Size and Share
Market Overview
| Study Period | 2020 - 2031 |
|---|---|
| Market Size (2026) | USD 3.43 Billion |
| Market Size (2031) | USD 5.08 Billion |
| Growth Rate (2026 - 2031) | 8.18 % |
| Fastest Growing Market | Asia Pacific |
| Largest Market | North America |
| Market Concentration | Medium |
Major Players *Disclaimer: Major Players sorted in no particular order Image © Mordor Intelligence. Reuse requires attribution under CC BY 4.0. | |
Adult Malignant Glioma Therapeutics Market Analysis by Mordor Intelligence
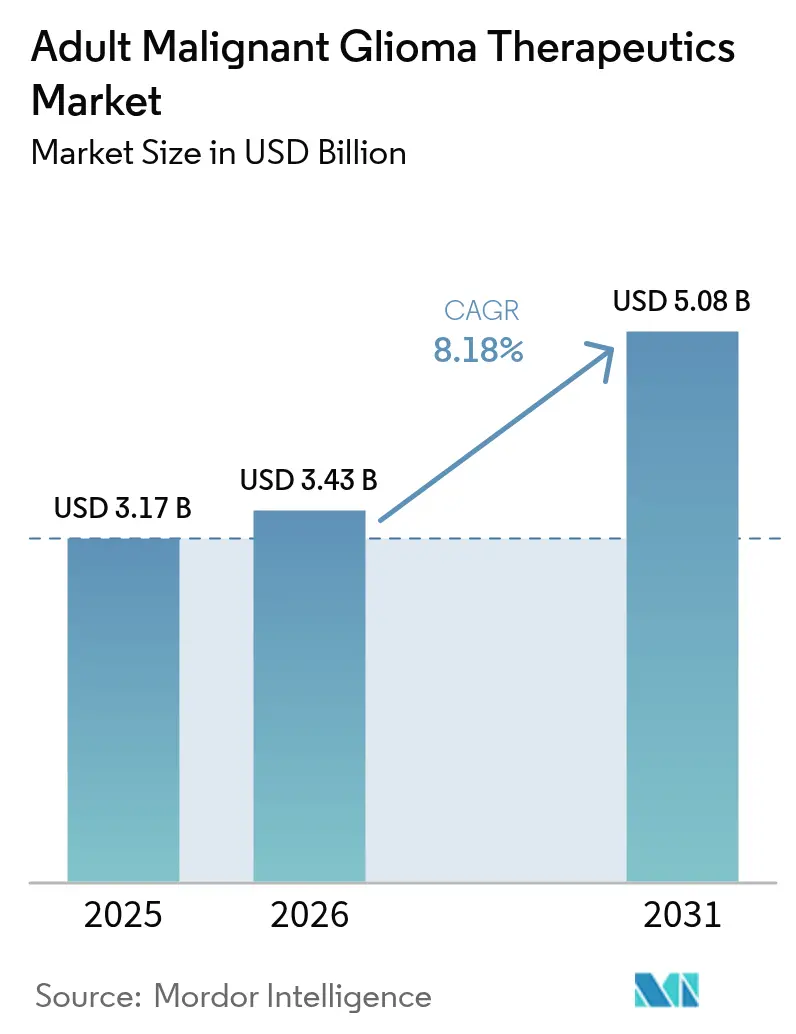
The Adult Malignant Glioma Therapeutics Market size was valued at USD 3.17 billion in 2025 and estimated to grow from USD 3.43 billion in 2026 to reach USD 5.08 billion by 2031, at a CAGR of 8.18% during the forecast period (2026-2031).
Pipeline momentum stems from the FDA’s fast-track and breakthrough programs, which shorten review timelines for first-in-class assets such as LP-184, and from AI-driven diagnostic tools that improve tumor characterization and treatment matching. Venture capital continues to flow into precision platforms, while large pharmaceutical firms consolidate targeted portfolios to offset temozolomide resistance and the blood-brain-barrier delivery challenge. Regionally, North America anchors commercial uptake through reimbursement support, yet hospital network expansion and regulatory harmonization in Asia Pacific are catalyzing the next demand wave. Parallel growth opportunities arise in device-based modalities like Tumor Treating Fields (TTFields), biosimilar bevacizumab launches, and cell-based therapies that register favorable stable-disease rates in early studies.
Key Report Takeaways
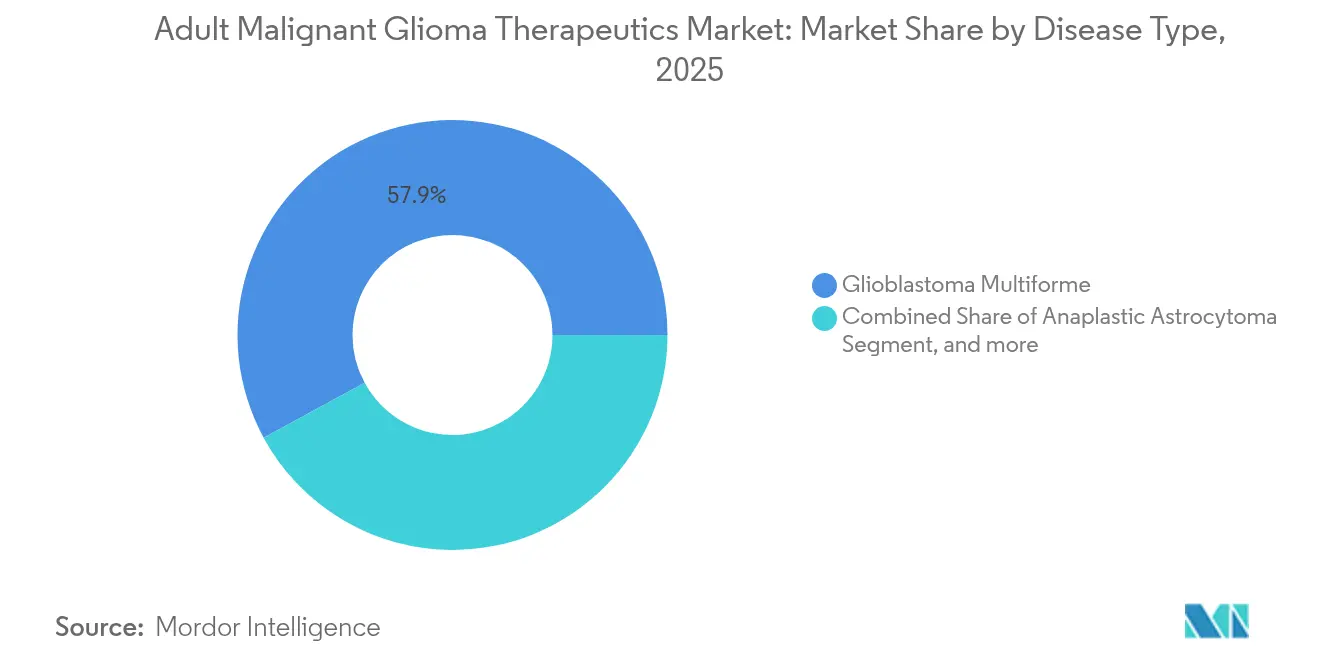
- By disease type, glioblastoma multiforme held 57.92% of the adult malignant glioma therapeutics market share in 2025, whereas anaplastic oligodendroglioma is poised for the fastest 9.12% CAGR through 2031.
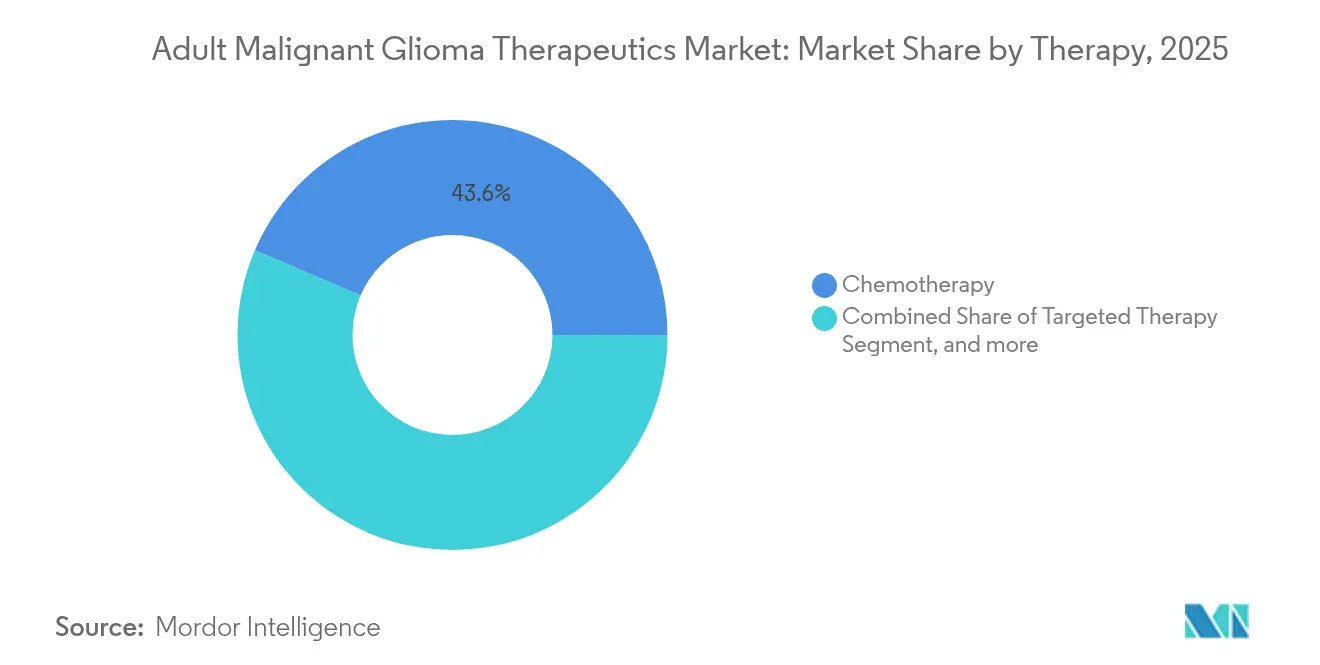
- By therapy, chemotherapy commanded 43.55% of the adult malignant glioma therapeutics market size in 2025, while immunotherapy leads growth at a 12.41% CAGR for 2026-2031.
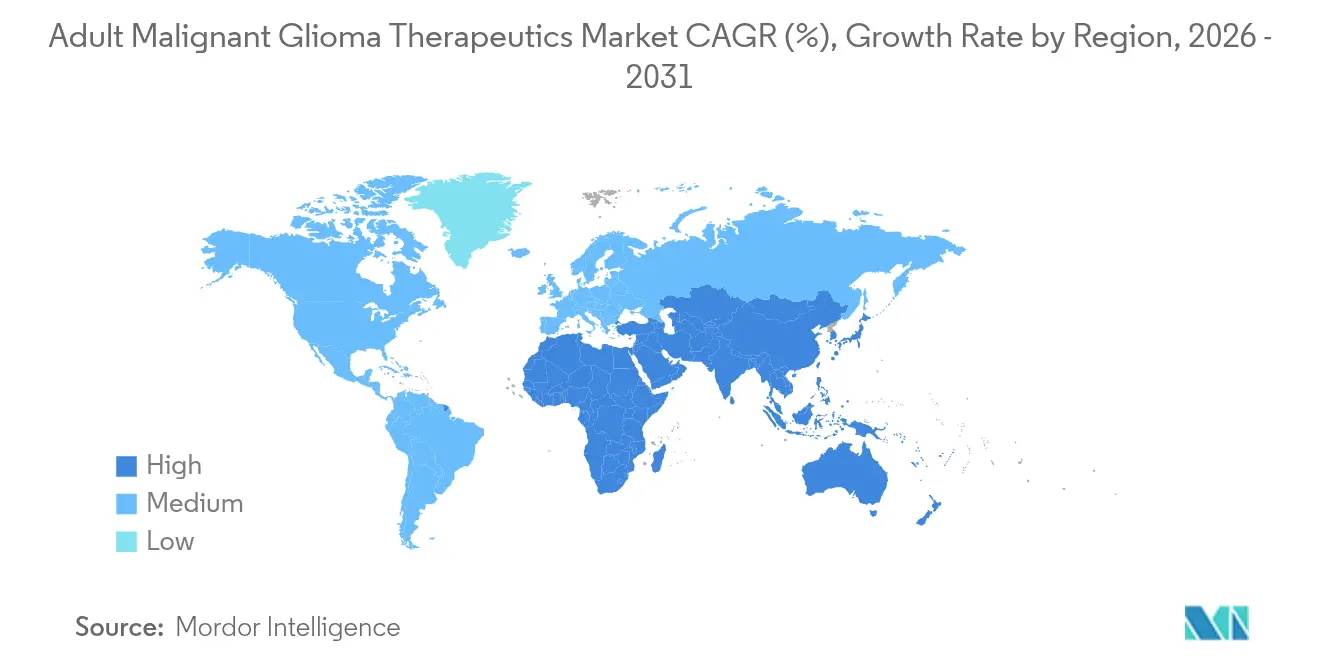
- By geography, North America maintained 41.32% share of the adult malignant glioma therapeutics market in 2025; Asia Pacific is positioned as the fastest-growing region at an 11.55% CAGR to 2031.
Note: Market size and forecast figures in this report are generated using Mordor Intelligence’s proprietary estimation framework, updated with the latest available data and insights as of 2026.
Market Trends and Insights
Drivers Impact Analysis of Adult Malignant Glioma Therapeutics Market*
| Driver | (~) % Impact on CAGR Forecast | Geographic Relevance | Impact Timeline |
|---|---|---|---|
| Rising incidence of malignant gliomas | +1.8% | Global, higher rates in North America & Europe | Long term (≥ 4 years) |
| Sustained public-sector R&D funding | +1.2% | North America & EU primary, spillover to APAC | Medium term (2-4 years) |
| Fast-track & breakthrough designations | +1.5% | Global, FDA-led with EMA harmonization | Short term (≤ 2 years) |
| AI-enabled early diagnosis & treatment plans | +0.9% | North America & APAC core, expanding to EU | Medium term (2-4 years) |
| Venture capital surge into BNCT platforms | +0.7% | Global, concentrated in biotech hubs | Long term (≥ 4 years) |
| Availability of bevacizumab biosimilars | +0.4% | Global, strongest in price-sensitive markets | Short term (≤ 2 years) |
| Source: Mordor Intelligence | |||
Rising Incidence of Malignant Gliomas
Epidemiological projections indicate that Asian glioma cases will jump 39.3% by 2040, fundamentally shifting the Adult malignant glioma therapeutics market toward emerging economies.[1] Improved imaging infrastructure now detects tumors earlier, adding previously undocumented patients to national registries. Younger Asian cohorts also present higher treatment tolerance, encouraging localized clinical trials and region-specific protocol adjustments. Survival rates from leading Chinese centers already surpass many Western benchmarks, implying potential biological or care-pathway differences. Drug developers therefore increase trial footprints in China, India, and South Korea to validate molecularly targeted regimens in genetically diverse populations.
Sustained Public-Sector R&D Funding
The adult malignant glioma therapeutics market benefits from government spending that offsets early-stage risk. The California Institute for Regenerative Medicine has allocated USD 11 million to UCSF’s CAR-T glioblastoma program, complementing NIH and DoD line items aimed at brain cancer.[2] Europe mirrors this trajectory through Horizon Europe grants that underpin the LEGATO study, which enrolls 411 patients at 43 sites across 11 countries. Public co-funding stretches beyond direct grants to include tax incentives and academic-industry incubators, thereby lowering capital barriers for first-in-class concepts such as synNotch cell therapies and nanoparticle delivery vehicles.
Fast-Track & Breakthrough Designations for Novel Devices
Regulators have accepted that standard 12-15-month median survival requires urgent reform, translating into unprecedented use of expedited pathways. The FDA has awarded breakthrough device designation to TTFields for brain metastases and has simultaneously fast-tracked CAN-3110, TLX101-CDx, and other assets.[3] EMA’s participation in Project Orbis enables coordinated dossier reviews, compressing Europe-US launch gaps to months rather than years. Accelerated programs also unlock rolling submissions and increased agency feedback, letting small biotechs allocate resources more efficiently. Commercially, priority review vouchers linked to rare pediatric extensions provide additional monetization options, reinforcing innovation velocity across the Adult malignant glioma therapeutics market.
AI-Enabled Early Diagnosis & Treatment Planning
Machine-learning systems now translate radiological, genomic, and intraoperative data into actionable guidance. FastGlioma software offers real-time tumor segmentation during surgery, while DeepGlioma algorithms deliver IDH mutation probability scores that inform immediate therapeutic decisions. Predictive models project individual response curves for temozolomide and CAR-T candidates, improving trial stratification and resource allocation. Hospitals integrating AI workflows report shorter diagnosis-to-treatment cycles, driving better progression-free outcomes that ripple across payer evaluations. Vendors bundling AI-driven decision support with drug or device portfolios secure a competitive edge as clinical teams demand turnkey solutions.
Restraints Impact Analysis of Adult Malignant Glioma Therapeutics Market*
| Restraint | (~) % Impact on CAGR Forecast | Geographic Relevance | Impact Timeline |
|---|---|---|---|
| Low late-stage trial success rates | -1.4% | Global, particularly affecting biotech sector | Medium term (2-4 years) |
| Rapid emergence of temozolomide resistance | -0.8% | Global, most pronounced in recurrent cases | Short term (≤ 2 years) |
| Boron-10 isotope supply-chain bottlenecks | -0.6% | Global, concentrated in BNCT development regions | Long term (≥ 4 years) |
| Oncology R&D capital diverted elsewhere | -0.9% | North America & Europe, spillover globally | Medium term (2-4 years) |
| Source: Mordor Intelligence | |||
Low Late-Stage Trial Success Rates
Success rates in phase 3 glioblastoma programs remain below 5%, eroding investor confidence and inflating capital requirements. The Adult malignant glioma therapeutics market therefore witnesses portfolio diversification as companies balance high-risk CNS assets with solid-tumor franchises. Failures often stem from off-target toxicity, insufficient blood-brain-barrier penetration, or control-arm outperformance. Each setback can wipe USD 500 million in sunk costs, driving partnerships that share financial exposure. Venture syndicates react by inserting stringent milestone-based tranched financing, prolonging timelines for smaller entrants.
Rapid Emergence of Temozolomide Resistance
Within 6-12 months of therapy initiation, MGMT promoter demethylation like clusters trigger clinical relapse across many glioblastoma patients. Oncologists then pivot to bevacizumab, TTFields, or off-label checkpoint inhibitors, yet durable responses remain elusive. The Adult malignant glioma therapeutics market thus accelerates investment in resistance-overcoming strategies such as PARP inhibitor combinations and polymer-encapsulated temozolomide formulations. Regulators demand robust proof of superiority, increasing trial complexity and prolonging data accrual.
*Our forecasts treat driver/restraint impacts as directional, not additive. The impact forecasts reflect baseline growth, mix effects, and variable interactions.
Adult Malignant Glioma Therapeutics Market Segment Analysis
By Disease Type:
Molecular precision reorders therapeutic prioritiesGlioblastoma multiforme led with 57.92% of the adult malignant glioma therapeutics market share in 2025, a level that steered sponsor focus toward blood-brain-barrier penetration chemistry and adaptive trial designs. Anaplastic oligodendroglioma, aided by IDH-targeted breakthroughs such as vorasidenib, is registering a 9.12% CAGR to 2031 and is on course to raise its contribution to the Adult malignant glioma therapeutics market size in absolute terms. Anaplastic astrocytoma garners steady funding for combination regimens, while anaplastic oligoastrocytoma benefits from refined WHO re-classification that funnels patients into mutation-specific protocols.
The success of vorasidenib, which delivered 27.7-month median progression-free survival against 11.1 months for placebo, illustrates how genotype-guided design outperforms histology-centric approaches. As panel sequencing becomes routine, developers can match small-molecule libraries to well-defined subpopulations, improving statistical power in trials and facilitating conditional approvals. The Adult malignant glioma therapeutics market therefore shifts toward smaller, faster studies that direct capital efficiency toward high-response cohorts.

By Therapy:
Next-wave modalities escalate competitive churnChemotherapy retained 43.55% of Adult malignant glioma therapeutics market size in 2025, reflecting the entrenched use of temozolomide in newly diagnosed cases. Immunotherapy, led by early CAR-T and PD-1 combination signals, is expanding at a 12.41% CAGR and threatens to capture meaningful share once registrational trials mature. Device-based approaches such as TTFields continue to grow through label expansions and payer adoption, while gene and cell therapies advance rapidly from a small base.
Checkpoint inhibitors and CAR-T platforms now dominate conference abstracts, indicating a pipeline pivot away from monotherapy cytotoxics. The Adult malignant glioma therapeutics market responds with cooperative studies that blend TTFields electric-field disruption with immune activation or DNA-repair inhibition. Pricing flexibility for biosimilar bevacizumab further intensifies competition by freeing hospital budgets for premium novel agents, elevating barriers for follow-on chemotherapy entrants.
Geography Analysis
North America Adult Malignant Glioma Therapeutics Market
North America contributed 41.32% of the Adult malignant glioma therapeutics market size in 2025, supported by robust reimbursement schemes, NCI-designated trial networks, and high diagnosis rates. The United States leads in fast-track designations, enabling products like vorasidenib to move from pivotal data to approval within a year. Canada integrates provincial health technology assessments that expedite reimbursement once Health Canada decisions align with FDA precedents.
APAC Adult Malignant Glioma Therapeutics Market
Asia Pacific is the fastest-growing theatre at an 11.55% CAGR, adding modern radiotherapy suites and accelerating inclusion of Chinese, Japanese, and South Korean centers in global protocols. Superior survival metrics reported by large tertiary hospitals in Beijing and Shanghai have triggered comparative-effectiveness collaborations to decode protocol differences. Harmonized rules under the ASEAN Mutual Recognition Arrangement further reduce barriers for device-based therapies, positioning the region as a volume and innovation hub.
Europe Adult Malignant Glioma Therapeutics Market
Europe posts stable momentum as EMA’s Project Orbis shortens market entry gaps. Germany, France, and the United Kingdom dominate trial starts, while Southern and Eastern European countries benefit from pan-regional ethical-review alignment. Horizon Europe grants finance multi-national datasets such as LEGATO, reinforcing investigator-initiated evidence generation that feeds directly into NICE and G-BA decisions. The Adult malignant glioma therapeutics market thus enjoys continent-wide platform harmonization, improving sponsor ROI on pivotal enrollment.
Regulatory Landscape
Regulatory oversight for adult malignant glioma therapeutics is increasingly centered on expedited pathways and biomarker-defined labeling, reflecting the high unmet need in aggressive gliomas. The FDA continues to rely on accelerated mechanisms for rare, high-mortality CNS tumors, including an August 2025 accelerated approval of dordaviprone (Modeyso) for H3 K27M-mutated diffuse midline glioma (including adult patients), while also advancing mutation-driven approvals such as Servier's vorasidenib (VORANIGO) approval in August 2024 for IDH1/IDH2-mutant Grade 2 glioma in patients 12 years and older following surgery.
In Europe, EMA decisions reinforce molecular stratification and conditional authorizations in neuro-oncology. Voranigo (vorasidenib) received EU-wide marketing authorization in September 2025 for predominantly non-enhancing Grade 2 IDH-mutant astrocytoma or oligodendroglioma (12 years and older), highlighting how genomic testing is increasingly treated as a prerequisite for targeted therapy access. Although outside the adult malignant glioma core, EMA's April 2026 conditional authorization of Ojemda (tovorafenib) for pediatric low-grade glioma shows continued openness to conditional routes in glioma settings, shaping sponsor development strategies and the evidence needed for CNS oncology programs.
Competitive Landscape
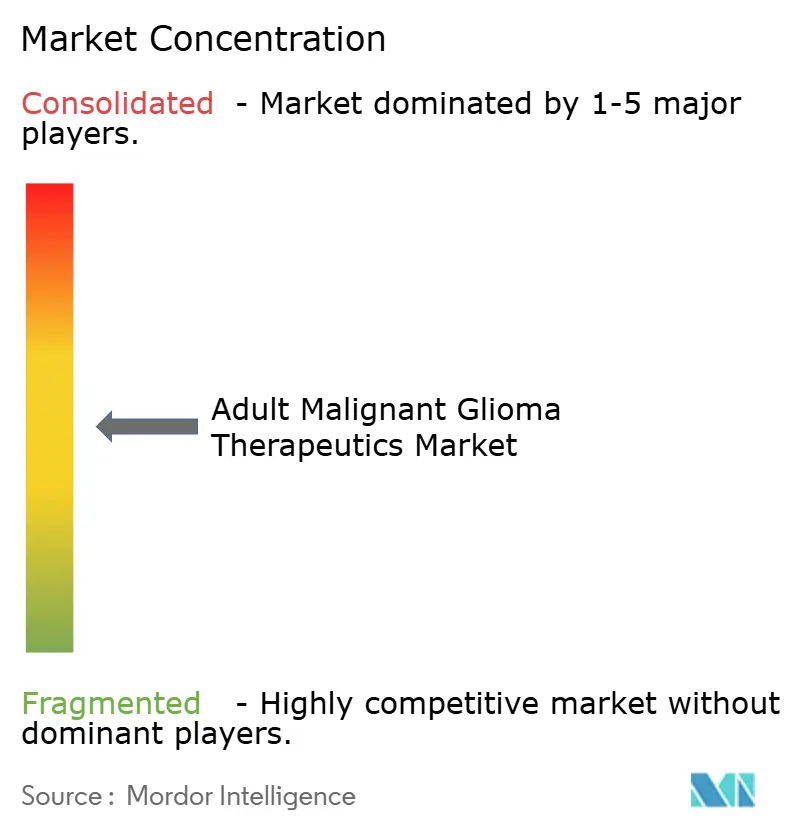
The adult malignant glioma therapeutics market is moderately concentrated, with top companies controlling meaningful revenue but leaving room for nimble biotechs that exploit niche molecular targets. Big-pharma players strengthen pipelines through buy-and-build tactics; Jazz Pharmaceuticals’ USD 935 million takeover of Chimerix for dordaviprone underscores appetite for H3 K27M-mutant assets. Novocure maintains first-mover advantage in TTFields across both adult and pediatric indications, partnering with MSD to explore checkpoint synergies.
Strategic alliances are proliferating as blood-brain-barrier delivery chemistry remains a universal hurdle. Biotechs with liposomal, polymer-conjugate, or focused-ultrasound platforms increasingly license technology rather than push full-cycle development. Intellectual-property jockeying around CAR-T engineering and neoantigen personalization intensifies, prompting cross-licensing to avoid mutual blocking worldwide.
Pricing dynamics evolve as biosimilars pressure legacy monoclonal antibodies, while orphan-drug exclusivity sustains premium positioning for mutation-specific therapies. Companies therefore embed value-based reimbursement models that tie payment to real-world outcomes, aligning economic incentives with clinical endpoints. This shift reinforces demand for AI analytics that track progression-free survival and quality-of-life metrics in near real time.
Adult Malignant Glioma Therapeutics Industry Leaders
-
Merck & Co. Inc.
-
Bristol-Myers Squibb Company
-
F. Hoffmann-La Roche Ltd
-
Bio-Rad Laboratories
-
Azurity Pharmaceuticals, Inc.
- *Disclaimer: Major Players sorted in no particular order
Adult Malignant Glioma Therapeutics Market Companies Covered in this Report
- Roche
- Merck
- Pfizer
- Novocure
- Bristol-Myers Squibb
- Amgen
- Abbvie
- AstraZeneca
- Chimerix
- DelMar Pharma
- Sumitomo Heavy Industries
- TAE Life Sciences
- Bluebird Bio
- Immunomic Therapeutics
- Ono Pharma
- GlaxoSmithKline
- Novartis
- Boehringer Ingelheim
- Servier
- Sun Pharmaceuticals Industries
Read Analysis of Adult Malignant Glioma Therapeutics Companies
Market Opportunities and Future Outlook
White-space opportunities in adult malignant glioma therapeutics concentrate on biomarker-defined high-grade disease, earlier and more routine molecular testing, and faster regimen iteration through adaptive development. In April 2026, the FDA granted Breakthrough Therapy Designation to FORE Biotherapeutics' plixorafenib for BRAF V600E-mutated high-grade glioma, which is a clear regulatory signal that mutation-directed approaches are moving into higher-grade settings where chemotherapy resistance and blood-brain-barrier constraints limit durability. This supports demand for companion diagnostics and for combinations designed to manage heterogeneity and intracranial delivery, as sponsors increasingly build programs around specific molecular subsets rather than broad histology labels.
Development throughput and differentiation also depend on trial infrastructure and modality selection. The GBM AGILE master protocol continues to function as a scalable entry point for multiple assets, with the first newly diagnosed glioblastoma patient randomized to the tinostamustine arm in June 2026, offering a way for sponsors to generate comparative signals through a shared platform. Modality choice is also being clarified by negative or mixed readouts, including Novocure's June 2026 Phase 3 TRIDENT results showing no statistically significant overall survival improvement for early initiation of Tumor Treating Fields, which elevates the need for patient selection, combination strategy, and endpoints beyond timing changes. 2026 signals reported for agents such as Sapience Therapeutics' lucicebtide plus standard of care (positive Phase 2 update with reported mPFS of 28.4 months) and published data from IN8bio's DeltEx DRI program (July 2026 Journal of Clinical Oncology publication) also underscore how differentiated mechanisms and well-defined populations can drive adoption and partnering decisions.
Recent Industry Developments in Adult Malignant Glioma Therapeutics Market
- July 2026: A Nature Medicine publication documented a Phase 1 recurrent glioblastoma study using nivolumab and relatlimab supplied by Bristol-Myers Squibb. The report keeps LAG-3 and PD-1 combination biology active in glioblastoma clinical experimentation, supporting continued partnering and protocol innovation even as CNS efficacy hurdles persist.
- March 2026: Merck & Co. announced a USD 6.7 billion agreement to acquire Terns Pharma to strengthen its oncology pipeline. While not glioma-specific, the deal signals ongoing large-pharma appetite to replenish cancer portfolios, which can raise the competitive bar for CNS-focused biotechs seeking partnerships and capital.
- August 2024: The FDA approved Servier's VORANIGO (vorasidenib) as the first targeted therapy for Grade 2 IDH-mutant glioma. The approval accelerated routine integration of molecular profiling into treatment decisions and reinforced mutation-specific development and commercialization strategies across glioma programs.
Adult Malignant Glioma Therapeutics Market Report Scope and Research Methodology
Market Definition and Coverage
This market covers revenues generated from therapies used to treat adult patients diagnosed with malignant glioma, across the full care pathway from first line to later lines, and counted in value terms at the point of sale within each country.
Scope exclusions: Pediatric malignant glioma care, diagnostics and imaging, neurosurgery procedure revenues, and supportive care medicines used mainly for symptom relief are excluded.
Segments Covered in This Report
- By Disease Type
- Glioblastoma Multiforme
- Anaplastic Astrocytoma
- Anaplastic Oligodendroglioma
- Anaplastic Oligoastrocytoma
- Other High-Grade Gliomas
- By Therapy
- Chemotherapy
- Temozolomide
- Lomustine
- Carmustine
- Bevacizumab
- Other Alkylating Agents
- Targeted Therapy
- EGFR Inhibitors
- VEGF/VEGFR Inhibitors
- IDH Inhibitors
- Immunotherapy
- Checkpoint Inhibitors
- CAR-T/NK Cell Therapy
- Oncolytic Viruses
- Device-Based Therapy
- Radiation Therapy
- Gene & Cell Therapy
- Chemotherapy
- By Geography
- North America
- United States
- Canada
- Mexico
- Europe
- Germany
- United Kingdom
- France
- Italy
- Spain
- Rest of Europe
- Asia-Pacific
- China
- Japan
- India
- Australia
- South Korea
- Rest of Asia-Pacific
- Middle East & Africa
- GCC
- South Africa
- Rest of Middle East & Africa
- South America
- Brazil
- Argentina
- Rest of South America
- North America
Data Sources, Market Sizing, and Validation
Desk Research
Desk research was used to map the disease and treatment landscape in a way that is easy to audit. We relied on public and official references, including cancer registry outputs (such as the US SEER program), WHO and OECD health statistics, national health service and ministry of health publications, and peer reviewed clinical literature indexed in PubMed for incidence, survival, and treatment patterns.
To translate clinical adoption into market numbers, we also reviewed drug labels and approval summaries from regulators (such as FDA and EMA pages), open price and reimbursement references where available, and import export or customs level statistics when therapies have identifiable trade codes. Company filings, earnings call decks, and press releases helped confirm launch timing and geographic footprint. A paid subscription used for company financials, and another for patent mapping, supported cross checks on pipeline maturity. This desk source list is illustrative only, and other public references were used during the study for clarification and validation.
Primary Interviews and Surveys
Primary work focused on neurologists, neuro oncologists, hospital pharmacists, payers, and distribution side contacts so assumptions from desk research could be stress tested against real world treatment flow. Inputs across the Americas, EMEA, and APAC were used to validate line of therapy mix, patient eligibility filters, and pricing corridors, and any large variance points were rechecked through follow up conversations.
Distribution of primary research fieldwork respondents
| Company type | Respondent position | Region |
|---|---|---|
| Top tier: 37% | CXOs: 17% | APAC: 43% |
| Mid tier: 42% | Functional/Unit leaders: 40% | EMEA: 32% |
| Smaller Players: 21% | Managers: 43% | Americas: 25% |
Market-Sizing & Forecasting
The core model starts from a top-down treated patient pool build up, where incidence and prevalence for adult malignant glioma are adjusted by diagnosis rates, resection and radiotherapy access, and the share of patients receiving active drug or device based therapy. After the demand pool is built, it is converted into value using therapy mix by line of therapy, typical duration of treatment, and price levels that reflect local reimbursement and channel markups.
To keep results practical, we corroborate totals with selective bottom-up approximations, such as sampled ASP times volume checks for key regimens, channel discussions on unit movement, and supplier side signals for major geographies. The model is then tuned when a gap cannot be explained. The most used input fingerprints include newly diagnosed versus recurrent case split, IDH mutation and MGMT methylation testing penetration as a proxy for targeted therapy eligibility, adoption of temozolomide based regimens, uptake of device based therapy where access exists, and timing of new product launches and label expansions.
For forecasting, scenario analysis is applied around adoption curves and pricing progression, anchored by expert consensus on diagnosis growth, treatment switching patterns, and reimbursement stability. When bottom-up checks are incomplete for smaller countries, we fill gaps using incidence scaled benchmarks tied to therapy access indices, and then validate the implied spend per treated patient against interview ranges.
Data Validation & Update Cycle
Outputs are validated through several passes, starting with basic logic checks on treated patients, implied cost per patient, and regional share stability. This is followed by variance checks against independent health spending and oncology drug trend signals. Any outliers trigger deeper drill down on inputs such as regimen duration, eligibility filters, or currency conversion timing, and the relevant assumptions are then rechecked with primary contacts.
Before sign off, another analyst reviews the calculation chain so key assumptions can be traced back to a specific input, and sensitivity cases are rerun for the biggest drivers. Reports are refreshed on an annual cycle, with interim updates added when a material event occurs, such as a major approval, a reimbursement change, or a step change in treatment adoption. Right before delivery, we do a fresh scan of public updates so clients receive the latest view.
Mordor Intelligence's Adult Malignant Glioma Therapeutics Market Size Compared Against Other Published Estimates
Published values for this market often do not match because the underlying counting logic differs, even when the title looks the same. Common reasons include which therapies are counted, how adult only patient pools are filtered, what year is treated as the base, and whether pricing is taken as list price or a net realized level.
Supportive care drugs and neurosurgery procedure revenues sit outside Mordor Intelligence's scope, which is one concrete reason the 2026 total can appear higher or lower than studies that fold those adjacent spends into the same number. In addition, some estimates rely on broad oncology growth rates with limited validation of line of therapy mix, while others assume faster uptake for newer modalities without checking access constraints country by country.
Benchmark comparison
| Source | Market Size | Gaps in Research Methodology |
|---|---|---|
| Mordor Intelligence | USD 3.43 B (2026) | |
| Industry Publisher A | USD 2.63 B (2024) | Uses an earlier base year and a different segment structure, and the therapy basket appears narrower with less explicit coverage of device-based therapy and cross-region pricing normalization. |
| Global Publisher B | USD 2.96 B (2026) | Often blends broader therapy categories and may apply higher level growth assumptions, with less visibility on treated patient filters, duration assumptions, and country-level reimbursement effects. |
The comparison shows that the spread is mainly explained by what gets counted as therapy spend, which year anchors the model, and how pricing and access are handled across countries. By keeping the treated adult malignant glioma pool explicit and tying spend to therapy mix, duration, and locally relevant pricing checks, the final number stays transparent and repeatable for planning.
Key Questions Answered in the Report
How large is global spending on adult malignant glioma therapeutics in 2026?
Worldwide spending stands at USD 3.43 billion in 2026.
What compound annual growth rate is projected for this segment through 2031?
The forecast calls for an 8.18% CAGR, lifting revenue to USD 5.08 billion by 2031.
Which treatment approach currently generates the highest revenue?
Chemotherapy leads with 43.55% share, owing to the entrenched use of temozolomide.
Which disease subtype is expanding the quickest?
Anaplastic oligodendroglioma is advancing at a 9.12% CAGR on the back of IDH-targeted breakthroughs such as vorasidenib.
Which region is growing fastest in therapeutic uptake?
Asia Pacific records the highest pace, rising at an 11.55% CAGR as clinical infrastructure and regulatory harmonization improve.
What primary factor is accelerating the adoption of immunotherapy options?
Early-phase CAR-T studies demonstrating 50% stable-disease rates are encouraging clinicians to add immunotherapy to treatment plans.