
Adipic Acid Market Size and Share
Market Overview
| Study Period | 2020 - 2031 |
|---|---|
| Market Volume (2026) | 4.69 Million tons |
| Market Volume (2031) | 5.55 Million tons |
| Growth Rate (2026 - 2031) | 3.45 % |
| Fastest Growing Market | Asia Pacific |
| Largest Market | Asia Pacific |
| Market Concentration | Medium |
Major Players *Disclaimer: Major Players sorted in no particular order Image © Mordor Intelligence. Reuse requires attribution under CC BY 4.0. | |
Adipic Acid Market Analysis by Mordor Intelligence
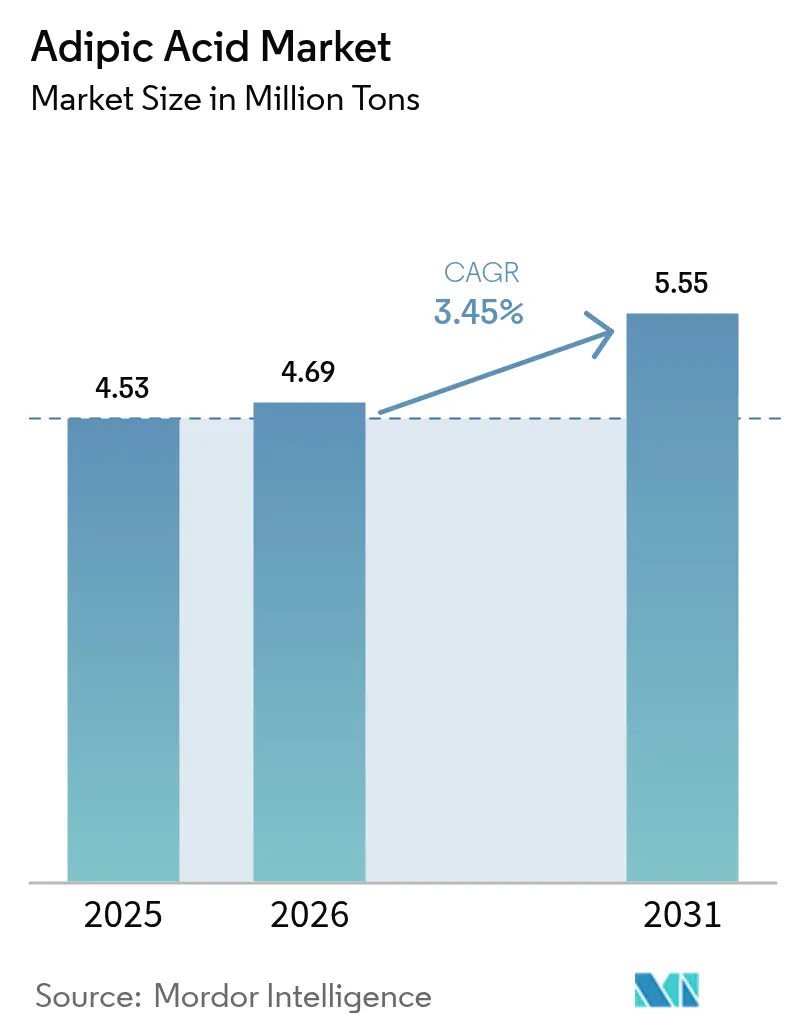
The Adipic Acid market size is expected to grow from 4.53 million tons in 2025 to 4.69 million tons in 2026 and is forecast to reach 5.55 million tons by 2031 at 3.45% CAGR over 2026-2031. Emission regulations, automotive light-weighting, and the appeal of bio-fermentation pathways are the pivotal forces shaping this trajectory. Asia-Pacific remains the production and consumption epicenter, while North America and Europe advance low-emission technologies that can meet tightening policy targets. Disruptive strides in fermentation are narrowing cost gaps with nitric-acid oxidation, and strategic capital flows into integrated nylon 66 capacity signal confidence in downstream demand. Feedstock volatility and scale-up risks temper optimism, yet regulatory tailwinds and end-market diversification keep the adipic acid market on a clear growth path.
Key Report Takeaways
- By raw material, cyclohexanone led with 54.62% of adipic acid market share in 2025, while cyclohexanol is projected to register the fastest 4.78% CAGR through 2031.
- By production process, nitric-acid oxidation accounted for 90.98% of adipic acid market share in 2025; bio-fermentation is set to advance at a 4.82% CAGR over 2026-2031.
- By end product, nylon 66 fibers held 35.22% share of the adipic acid market size in 2025, whereas polyurethanes are tracking the highest 5.26% CAGR to 2031.
- By application, plasticizers accounted for 28.66% of adipic acid market share in 2025, while food additives is projected to register the fastest 4.61% CAGR through 2031.
- By end-user industry, the automotive sector retained 41.05% adipic acid market share in 2025, yet personal care leads growth with a 4.63% CAGR forecast.
- By geography, Asia-Pacific dominated with 46.88% share in 2025 and is poised to expand at 4.98% CAGR, outpacing all other regions.
Note: Market size and forecast figures in this report are generated using Mordor Intelligence’s proprietary estimation framework, updated with the latest available data and insights as of 2026.
Market Trends and Insights
Drivers Impact Analysis of Adipic Acid Market*
| Driver | (~) % Impact on CAGR Forecast | Geographic Relevance | Impact Timeline |
|---|---|---|---|
| Surging demand for Nylon 66 in e-mobility lightweight parts | +0.80% | Asia-Pacific and North America | Medium term (2-4 years) |
| Shift from metal to plastics in EV battery casings | +0.60% | China and North America | Medium term (2-4 years) |
| Growth of energy-efficient construction foams | +0.50% | North America and Europe | Long term (≥ 4 years) |
| Expansion of textile filament capacity | +0.40% | Asia-Pacific and South America | Short term (≤ 2 years) |
| Emergence of bio-based adipic acid for compostable films | +0.30% | North America and Europe | Long term (≥ 4 years) |
| Source: Mordor Intelligence | |||
Surging Demand for Nylon 66 in E-Mobility Lightweight Parts
Electric vehicle manufacturers are embracing nylon 66 to reduce vehicle mass and extend driving range, which elevates consumption of adipic acid-based intermediates. INVISTA’s project to double Shanghai nylon 66 output to 400,000 tons places production close to adiponitrile feedstock, lowering logistics costs and shortening supply chains. BASF’s 260,000-ton hexamethylenediamine unit in France expands regional self-sufficiency for critical monomers[1]. Battery thermal-management and structural modules rely on nylon 66 for heat resistance that metals cannot offer at comparable weight. Recent unplanned outages at adiponitrile plants in China highlighted supply vulnerability and prompted producers to integrate upstream operations for risk mitigation.
Shift from Metal to Plastics in EV Battery Casings
Automakers are converting metal battery covers to polymer solutions that combine weight savings with enhanced design flexibility. Polyurethane foams derived from adipic acid now insulate casings while dissipating heat, and Covestro’s ISCC+ certified raw materials illustrate the industry’s sustainability pivot. United States automotive producers consumed 142 million lb of polyurethane coatings in 2023, a scale that underscores the near-term revenue upside for adipic acid suppliers. Complex geometries are achievable through plastics, enabling streamlined battery pack architectures. Premium pricing for high-performance polymers offsets higher raw-material costs and encourages capacity additions that stabilize the adipic acid market.
Growth of Energy-Efficient Construction Foams
Tighter building-code mandates across North America and Europe are pushing demand for rigid and spray polyurethane foams that require adipic acid-derived polyols. High R-values, flame retardancy, and sound-damping dampening position these foams as multi-functional solutions for net-zero buildings. Bio-based pathways employing vegetable oils and lignin attract green-building certification points. Multifunctionality, including electromagnetic interference shielding, widens the application envelope to smart-home infrastructure. Global insulation retrofits, especially under European Renovation Wave programs, sustain long-term volume growth for the adipic acid market.
Expansion of Textile Filament Capacity
Asian producers are scaling nylon fibers for technical textiles that demand abrasion resistance and moisture management. Research on biobased PA56 reveals up to 50% lower fossil resource needs relative to conventional nylons. Wool/PA56 blends show promise in automotive interiors where comfort and durability converge. Controlled copolymer crystallization tailors mechanical properties for high-end performance wear. Hyosung’s USD 1 billion Vietnam project for biobased 1,4-butanediol underpins fiber diversification strategies. Heightened textile innovation diversifies the downstream base for the adipic acid market and shields producers from automotive cyclicality.
Restraints Impact Analysis of Adipic Acid Market*
| Restraint | (~) % Impact on CAGR Forecast | Geographic Relevance | Impact Timeline |
|---|---|---|---|
| Volatility in cyclohexanone feedstock prices | -0.70% | Global, acute in Asia-Pacific | Short term (≤ 2 years) |
| Scale-up challenges for bio-fermentation pathways | -0.40% | North America and Europe | Medium term (2-4 years) |
| Geopolitical risk to nitric-acid supply chains | -0.30% | Trade-dependent regions | Medium term (2-4 years) |
| Source: Mordor Intelligence | |||
Volatility in Cyclohexanone Feedstock Prices
Cyclohexanone accounts for roughly two-thirds of conversion costs; hence, price swings rapidly compress margins. Limited upstream diversification means unplanned outages or geopolitical shocks ripple through the value chain. Rising logistics and energy costs further destabilize total production economics, complicating long-term contracts. Vertical integration or alternative feedstocks such as bio-aromatics are gaining attention as resilience strategies. However, securing capital for upstream acquisitions is challenging when feedstock cycles remain unpredictable.
Scale-Up Challenges for Bio-Fermentation Pathways
While laboratory titers of cis,cis-muconic acid have reached 47.2 g/L, productivity declines markedly when processes scale beyond 150 L. Economic models projecting an adipic acid price of USD 2.60 kg hinge on ideal yields, which may not be met in early commercial plants. Microbial tolerance to high acid concentrations remains a central bottleneck, requiring strain engineering to reach 50-100 g/L thresholds. Historical bankruptcies such as BioAmber amplify investor caution, and regulatory reviews add timeline uncertainty. These hurdles slow but do not halt the transition toward bio-routes in the adipic acid market.
*Our forecasts treat driver/restraint impacts as directional, not additive. The impact forecasts reflect baseline growth, mix effects, and variable interactions.
Adipic Acid Market Segment Analysis
By Raw Material:
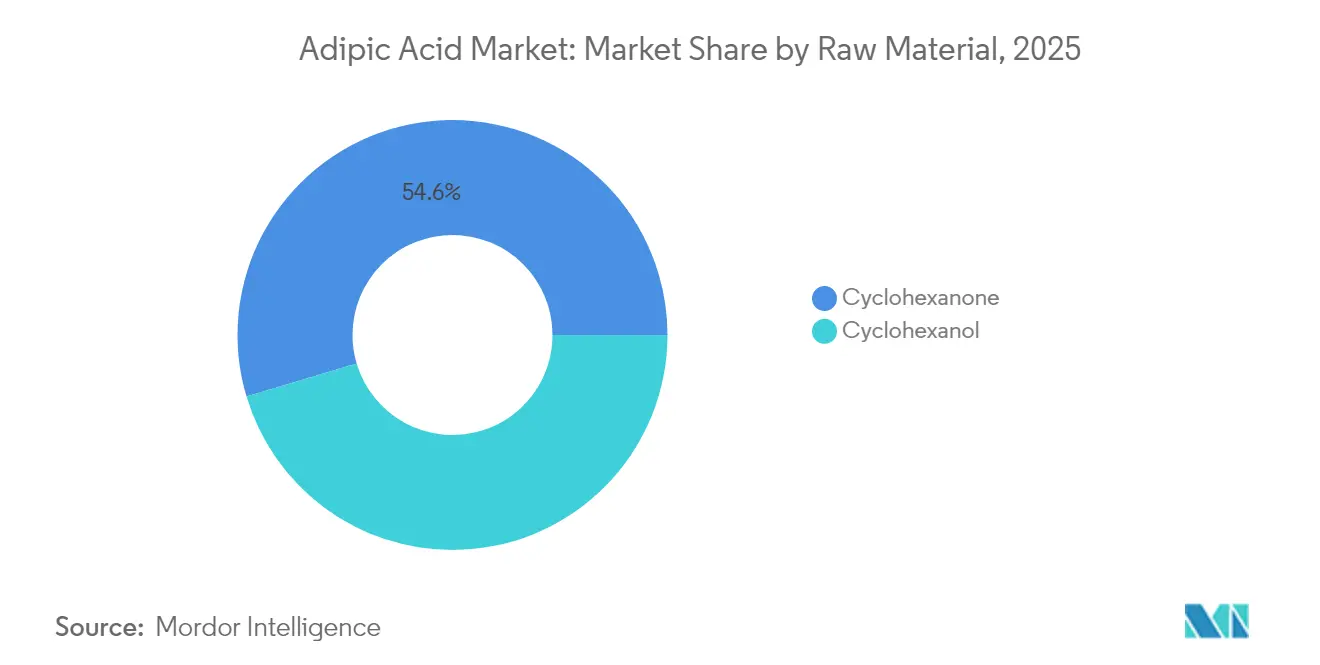
Cyclohexanone Dominance Faces Bio-Based DisruptionCyclohexanone controlled 54.62% adipic acid market share in 2025, confirming its entrenched role in nitric-acid oxidation. The adipic acid market size tied to cyclohexanone represents roughly half of global output, reinforcing the importance of stable supply chains. Cyclohexanol, however, is rising at 4.78% CAGR as producers deploy greener oxidation catalysts that slash nitrous oxide emissions. Catalyst designs featuring hydrogen peroxide achieve 92.3% conversion and 29.4% selectivity to adipic acid, reflecting substantial efficiency gains. Faradaic-efficient electrocatalysis that co-generates hydrogen gas at 93% efficiency presents an additional revenue stream and aligns with decarbonization targets.
Bio-aromatic concepts that valorize lignin can remove crude-derived intermediates from the chain altogether. Engineered Pseudomonas putida strains deliver 2.5 g/L adipic acid from lignin fragments and point toward future integration of biorefinery side-streams. Lifecycle assessments suggest a 58% CO2 reduction and 23% lower energy demand versus petrochemical routes, positioning such pathways as compliance tools under evolving carbon-pricing regimes. Although volumes remain small, successful commercialization could redraw raw-material economics within the adipic acid market.

By Production Process:
Nitric-Acid Oxidation Maintains Control Despite Environmental PressureNitric-acid oxidation constituted 90.98% of the adipic acid market in 2025 due to mature technology and sunk capital. The adipic acid market size linked to this process benefits from economies of scale but endures scrutiny over nitrous oxide emissions. Texas regulations limit NOx to 2.5 lb per ton, illustrating regional compliance burdens.
Bio-fermentation, despite holding only 4.82% CAGR momentum, is gathering commercial trials that run on glucose and xylose. When carbon costs are internalized, economic parity edges closer, particularly in regions with renewable-energy surpluses. Co-location with corn-ethanol plants can secure feedstock and utilities, further compressing variable cost. The competitive narrative hinges on whether fermentation can achieve the scale needed to drop fixed costs below incumbent asset levels.
By End Product:
Polyurethanes Accelerate Past Traditional Nylon ApplicationsNylon 66 fibers held 35.22% of 2025 sales, serving automotive, electronics, and industrial threads where tensile integrity is vital. Yet, polyurethanes are advancing at 5.26% CAGR as construction, refrigeration, and seating applications widen. Commercial builders favor high-density rigid foams with flame retardant and electromagnetic interference shielding, while auto OEMs exploit flexible foams for seating comfort. Mexico, a significant consumer of polyurethane globally, is driving the segment's growth.
Bio-based polyurethane trials using vegetable oils enable drop-in performance with improved carbon footprints. Demonstrated recyclability via chemical depolymerization furthers their circular credentials. Adipate plasticizers remain a niche but profitable offshoot for lubricant and coating applications. The larger product mix expands addressable markets, cushioning demand swings in any single downstream sector.
By Application:
Food Additives Emerge as Unexpected Growth DriverPlasticizers dominated with a 28.66% share in 2025, reinforcing the role of adipate esters in flexible PVC goods. Food additives, however, are gaining at a 4.61% CAGR as clean-label requirements spur the adoption of adipic acid as an acidulant in powdered beverages and desserts. WHO risk assessments confirm safe daily intake, removing regulatory barriers for formulators.
In coatings, adipic acid confers corrosion resistance and heat endurance valued in automotive and industrial finishes. Unsaturated polyester resins and synthetic lubricants contribute steady niche demand anchored by specialised performance needs. The diverse application portfolio broadens revenue channels for participants in the adipic acid market, aligning with resilience strategies that mitigate cyclic exposure.
By End-User Industry:
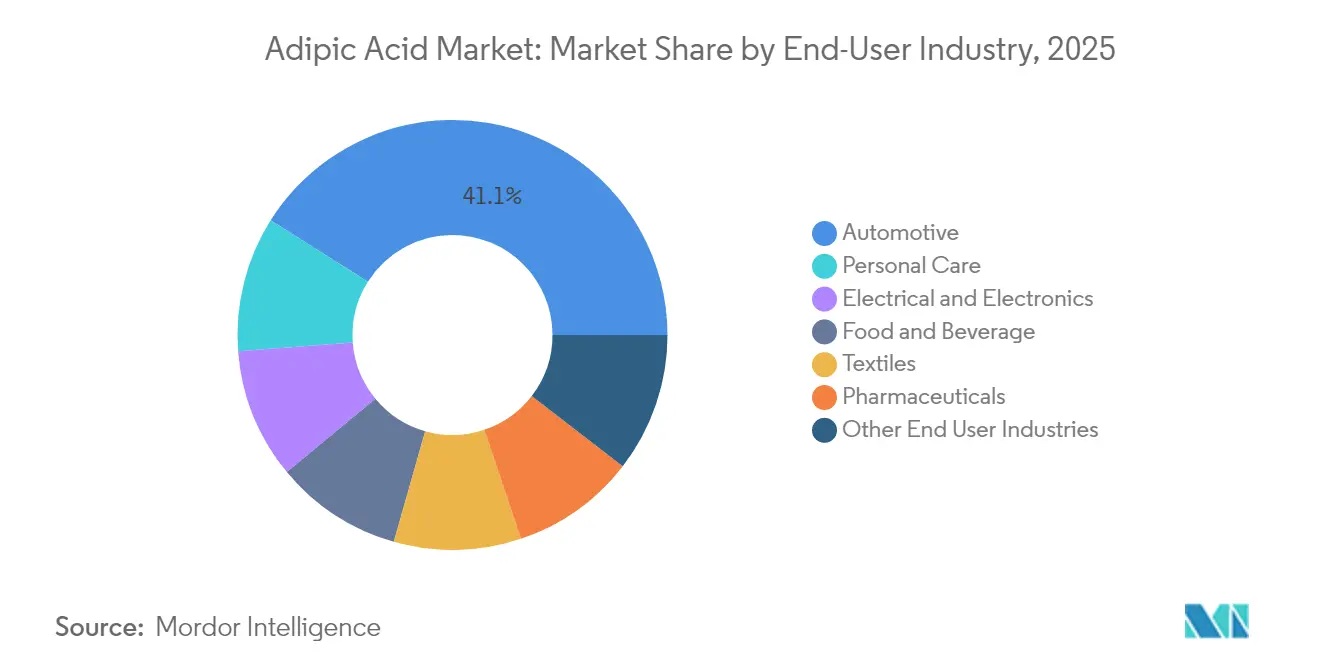
Personal Care Accelerates Beyond Automotive DominanceAutomotive applications retained 41.05% of the 2025 volume on the back of e-mobility adoption and metal-to-plastic substitutions. Yet personal care is the fastest-growing end user with a 4.63% CAGR, propelled by consumer interest in sustainable formulations. Adipic acid esters provide emolliency and pH balance in skincare and hair products, and formulators value the ingredient’s low irritation profile.
Electrical and electronics lean on nylon 66’s insulation prowess, while textiles leverage performance fibers for functional apparel. Pharmaceuticals continue as a stable outlet for adipic acid in API synthesis. The broadened industry spread reduces sensitivity to any single macroeconomic cycle and underlines the strategic depth of the adipic acid market.
Geography Analysis
APAC, the Americas and EMEA Adipic Acid Market
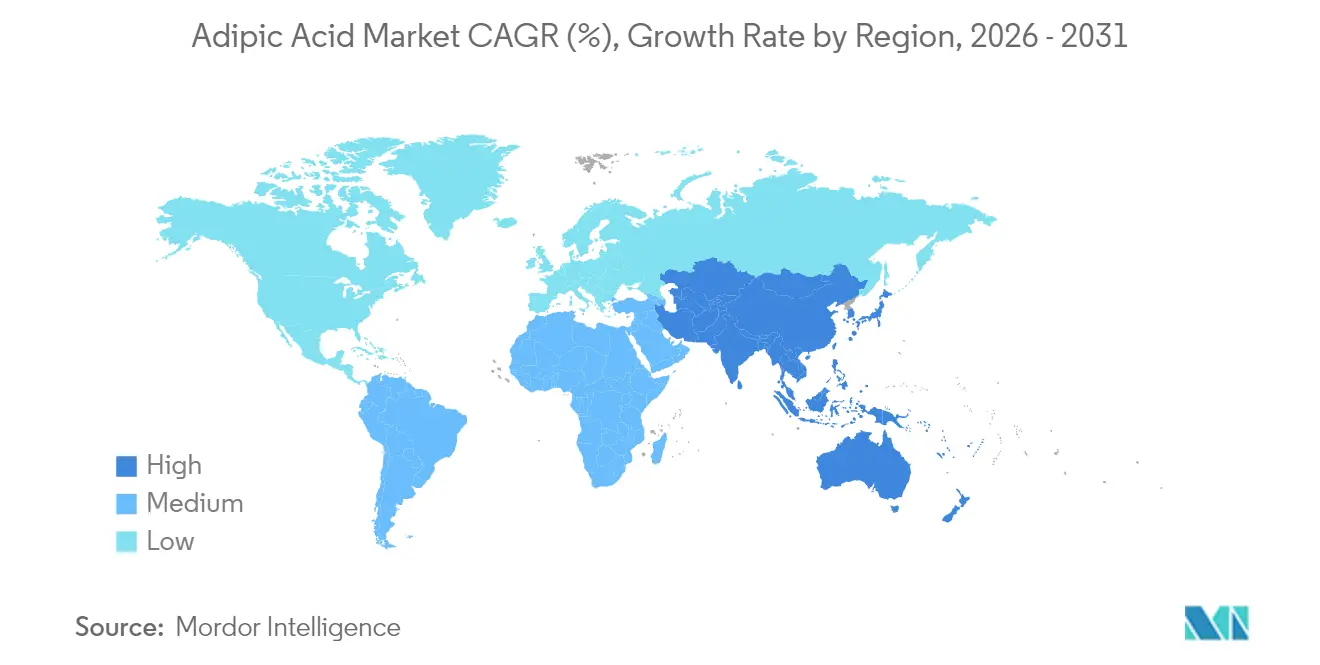
Asia-Pacific held 46.88% of global volume in 2025 and drives the fastest 4.98% CAGR as China scales capacity and India channels petrochemical investment into Gujarat corridors. Rapid adoption of catalytic destruction units has started to narrow the carbon gap between Chinese and Western producers. North America remains a stronghold for food-grade and high-purity grades of adipic acid. Ascend Performance Materials and AdvanSix operate fully integrated chains that benefit from shale-gas economics and strict U.S. emission controls, which favor producers with demonstrated compliance records. Fermentation pilots clustered in the Midwest leverage corn feedstock and renewable electricity from wind corridors. Europe’s policy focus on circularity is driving capital toward integrated assets that couple downstream resin plants with upstream monomers to minimize logistics emissions. BASF’s French hexamethylenediamine investment exemplifies a hub model that embeds sustainability into supply architecture. South America and the Middle East & Africa show emerging interest through infrastructure build-outs, yet political and economic volatility create hurdles that could delay large-scale investments. Together these dynamics illustrate a regionally stratified complexion that continues to shape global supply patterns in the adipic acid market.
Value Chain Analysis
The adipic acid value chain begins with petrochemical feedstocks (benzene to cyclohexane) and the manufacture of KA oil (cyclohexanone/cyclohexanol), then moves to nitric-acid oxidation to adipic acid. Upstream inputs include ammonia for nitric acid and oxidation catalysts, commonly copper- and vanadium-based systems. With cyclohexanone accounting for 54.62% of raw-material share in 2025 and nitric-acid oxidation representing 90.98% of production, the chain remains closely tied to benzene, cyclohexane, and nitric-acid availability, while tightening emissions scrutiny (notably for NOx/N2O) elevates the role of abatement equipment and compliance capabilities in cost competitiveness.
Downstream, adipic acid feeds into nylon 66 fibers and engineering resins, polyurethanes, adipate esters (plasticizers), coatings, and food-grade applications. This creates different logistics and quality requirements between commodity volumes and higher-purity or food-grade material. The supplier base spans large integrated players (including BASF, Ascend Performance Materials, INVISTA, and AdvanSix) and major Chinese producers such as Huafeng Group. Trade policy and logistics can add friction points, and EU anti-dumping scrutiny on Chinese imports during 2024-2025, along with U.S. import and customs delays that stretched delivery lead times (reported up to six months in April 2025), underscores how midstream distribution and cross-border compliance can become binding constraints alongside feedstock volatility.
Competitive Landscape
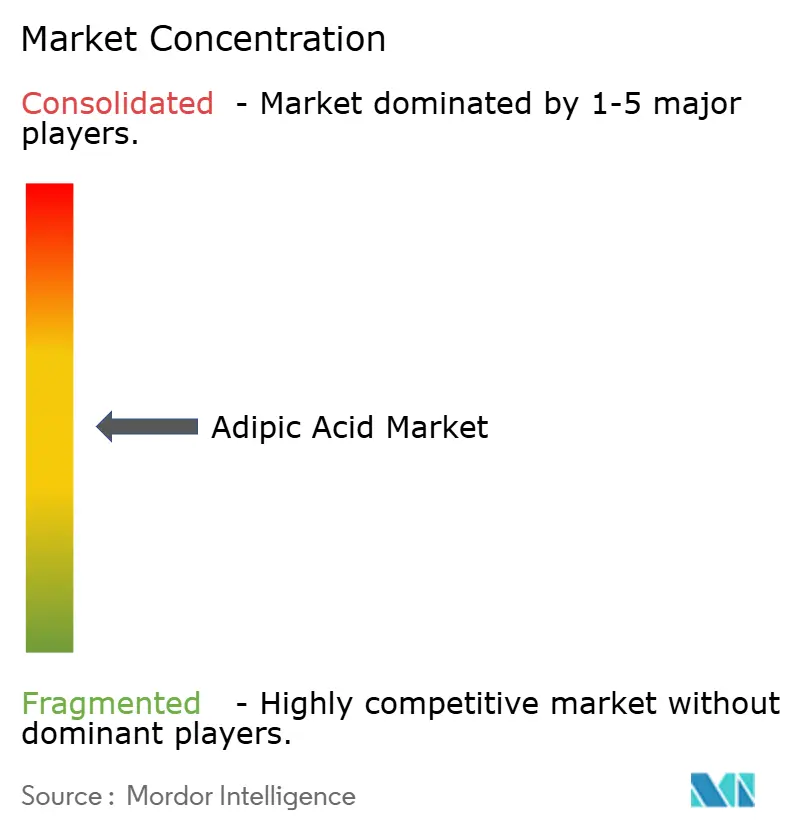
The adipic acid market shows moderate concentration with BASF, Ascend Performance Materials, and INVISTA accounting for a sizable installed capacity share. BASF’s decision to close Ludwigshafen adipic acid operations by end-2025 signals realignment toward higher-margin units and modern plants with lower emissions. INVISTA’s expanded Shanghai nylon 66 complex ties monomer and polymer production under one roof, harvesting economies of scope. Ascend capitalizes on feedstock integration to navigate cyclohexanone price volatility.
Bio-based challengers are partnering with established firms and fermentation tollers to commercialize organisms engineered for adipic acid production. Cost-curve parity depends on scaling above 50,000 t per year, a threshold that current pilot projects target before 2030. Intellectual-property filings reveal aggressive research into electrocatalytic oxidation catalysts and high-tolerance microbial strains, with patent races intensifying across China, the United States, and Europe.
Consolidation is underway as Lone Star Funds moves to acquire RadiciGroup’s specialty chemicals branch, signaling that private equity sees untapped synergies in a market transitioning toward higher specialty volumes. Market participants increasingly benchmark environmental performance in tender processes, so early adopters of low-emission technologies gain bidding advantages. Competitive intensity will likely hinge on the execution of scalable, cost-effective decarbonization strategies rather than capacity alone.
Adipic Acid Industry Leaders
-
BASF SE
-
Ascend Performance Materials
-
INVISTA
-
AdvanSix Inc.
-
Radici Partecipazioni SpA
- *Disclaimer: Major Players sorted in no particular order
Adipic Acid Market Companies Covered in this Report
- AdvanSix Inc.
- Asahi Kasei Corp.
- Ascend Performance Materials
- BASF SE
- CJ CheilJedang
- Domo Chemicals
- Huafeng Group
- INVISTA
- Lanxess AG
- Radici Partecipazioni SpA
- Shandong Hualu-Hengsheng Chemical
- Shenma Industrial
- Solvay SA
- Sumitomo Chemical Co., Ltd.
- Tangshan Zhonghao Chemical
- TORAY INDUSTRIES, INC.
Market Opportunities and Future Outlook
Decarbonization and fossil-feedstock risk management are opening room for certified circular and bio-based adipic acid offerings, especially where downstream buyers in automotive polymers and textiles increasingly ask for traceable sustainability attributes. INVISTA’s certification and Ascend’s feedstock claims reinforce this direction: INVISTA expanded its ISCC PLUS certification program (including renewable and bio-circular claims) for its Victoria, Texas site in April 2025, and Ascend Performance Materials reported production of bio-circular adipic acid and nylon 6,6 using used cooking oil feedstocks under an ISCC Plus mass-balance approach in December 2024. Together, these efforts support premium-grade positioning and help suppliers compete on verified chain-of-custody rather than commodity pricing alone.
Technology development is also broadening the feedstock option set beyond glucose routes, including waste and lignin-derived aromatics, which can reduce dependence on benzene-cyclohexane economics and shift cost floors (including benzene price increases reported in early 2026). On the research side, Universitat Leipzig in March 2026 highlighted biofunneling using Pseudomonas taiwanensis VLB120 to convert wood-waste-derived phenols into adipic acid. In parallel, Toray Industries and PTT Global Chemical reported progress in June 2026 on manufacturing technologies for bio-based adipic acid from starch-residue-derived bio-muconic acid, with an aim to link into textile product sales by FY2028. At the same time, early 2026 commercial focus is shifting toward higher-value niches, given traditional-chain oversupply and low operating rates. Regional supply changes, including BASF discontinuing adipic acid production at Ludwigshafen by end-2025, are also feeding into procurement strategy adjustments in Europe.
Recent Industry Developments in Adipic Acid Market
- June 2026: Toray Industries and PTT Global Chemical reported progress demonstrating manufacturing technologies for bio-based adipic acid from starch-residue-derived bio-muconic acid. The update ties bio-based adipic acid directly to downstream textile commercialization plans (targeting product sales by FY2028), strengthening the case for scaled pathways beyond pilot-stage chemistry.
- December 2025: Ascend Performance Materials completed its financial restructuring and emerged from Chapter 11 on December 19, 2025, after confirming its reorganization plan. The recapitalization supports continuity of supply and capital access for its nylon 6,6 and intermediates chain, which includes adipic acid-related products in performance and specialty chemicals.
- December 2024: Ascend Performance Materials announced production of bio-circular adipic acid and nylon 6,6 using feedstocks derived from used cooking oil via an ISCC Plus-certified mass-balance approach. This positioned mass-balance, waste-derived inputs as a commercially produced option for buyers seeking lower-carbon polyamide value chains without requiring immediate changes to existing processing equipment.
Adipic Acid Market Report Scope and Research Methodology
Market Definition and Coverage
For this study, the adipic acid market is defined as the global demand and supply of adipic acid (reported in volume) across major producing regions, covering traded and domestically consumed material that is used downstream in chemical and polymer manufacturing.
Scope exclusions: The model does not treat downstream nylon or polyurethane product revenues as adipic acid market value, and it avoids double counting internal transfers inside integrated chemical chains.
Segments Covered in This Report
- By Raw Material
- Cyclohexanol
- Cyclohexanone
- By Production Process
- Nitric-acid Oxidation
- Bio-fermentation
- By End Product
- Nylon 66 Fibers
- Nylon 66 Engineering Resins
- Polyurethanes
- Adipate Esters
- Other End Products
- By Application
- Plasticizers
- Unsaturated Polyester Resins
- Wet Paper Resins
- Coatings
- Synthetic Lubricants
- Food Additives
- Other Applications
- By End-user Industry
- Automotive
- Electrical and Electronics
- Textiles
- Food and Beverage
- Personal Care
- Pharmaceuticals
- Other End User Industries
- By Geography
- Asia-Pacific
- China
- India
- Japan
- South Korea
- Rest of Asia-Pacific
- North America
- United States
- Canada
- Mexico
- Europe
- Germany
- United Kingdom
- Italy
- France
- Rest of Europe
- South America
- Brazil
- Argentina
- Rest of South America
- Middle East and Africa
- Saudi Arabia
- South Africa
- Rest of Middle East and Africa
- Asia-Pacific
Data Sources, Market Sizing, and Validation
Desk Research
Desk work starts with building the global supply and demand picture in physical terms, since adipic acid is a commodity chemical that is commonly discussed in tons. We reviewed public and official sources such as UN Comtrade trade statistics, USGS and other national geological and industrial statistics portals, OECD and World Bank macro series, and environmental agency publications that describe operating constraints and emission-related compliance.
Alongside that, we used company annual reports, investor presentations, and plant announcements to map capacity changes, planned turnarounds, and regional trade flows. Patent databases were also checked to understand the direction of process changes, including shifts in oxidation routes and lower emission pathways. We used paid subscriptions for company financials and intelligence, and an import-export shipment-level database to sanity check trade intensity, while treating it as supporting evidence rather than the only input. The desk sources listed here are illustrative only, and we also consulted other public documents and datasets for data collection, validation, and clarification.
Primary Interviews and Surveys
Primary work was used to pressure-test the tonnage model using real operating and buying behavior, especially where public data is delayed or not fully comparable across countries. We spoke with a mix of producers, distributors, and large downstream users to validate utilization ranges, typical contract structures, and substitution limits in key applications, and we ensured coverage across the main consuming regions to avoid a single-region bias.
Distribution of primary research fieldwork respondents
| Company type | Respondent position | Region |
|---|---|---|
| Top tier: 36% | CXOs: 13% | APAC: 49% |
| Mid tier: 48% | Functional/Unit leaders: 29% | EMEA: 31% |
| Smaller Players: 16% | Managers: 58% | Americas: 20% |
Market-Sizing & Forecasting
Sizing is built using a top-down structure where production, capacity, and trade data are used to reconstruct the addressable consumption pool in each region, and then regional totals are summed to a global number in tons. To keep the model realistic, we corroborate it with selective bottom-up approximations like supplier capacity rollups, sampled shipment patterns, and application-level volume checks shared by interviewees, and then we adjust totals only when the signals align.
Key inputs that shape the annual numbers include nylon 6,6 and engineering plastics production direction, polyurethane and plasticizer related pull, plant capacity additions and shutdowns, utilization and turnaround cycles, and net import or export positioning by region. Where a specific country has reporting gaps, the missing pieces are filled using nearby proxy indicators such as consistent trade partners, known plant nameplate capacity, and typical operating rate ranges obtained through primary checks.
For forecasting, we mainly use scenario analysis supported by a light multivariate regression on a few stable drivers like industrial output, downstream polymer production, and trade balance shifts, and then the forecast path is reviewed against expert expectations on capacity tightness and demand recovery timing. The final outlook is created after assumptions are iterated, because the main drivers usually do not move in a straight line year to year.
Data Validation & Update Cycle
Outputs are validated through a set of cross checks that look for inconsistencies between capacity-implied supply, trade-implied availability, and demand implied by downstream activity. When an unusual jump appears, it is traced back to the driver level, and the underlying assumption is revisited, followed by a second analyst review before sign-off.
The model is also compared against independent signals like major plant event timelines, regional price direction versus tightness, and whether the implied utilization looks reasonable for a commodity chemical. Reports are refreshed annually, and interim updates are triggered when material events occur such as large capacity start-ups, prolonged outages, or major policy changes. Before delivery, a final pass is completed so the published view reflects the latest available information.
Mordor Intelligence's Adipic Acid Market Size Measured Against Other Published Estimates
Published adipic acid market estimates can look far apart even when they describe the same product, because the unit of measurement and what is being counted can change from one study to another. Some figures are revenue based and tied to price assumptions, and others are volume based and tied to physical supply and demand, which naturally leads to different looking results.
Trade flow checks, capacity additions and utilization sanity tests are the evidence points that keep Mordor Intelligence's estimate anchored to a volume-defined adipic acid demand pool, instead of being driven by short-term price swings or downstream product values. Differences also show up when a study blends standard and specialty grades differently, applies aggressive versus conservative operating rates, or converts currencies using different timing and assumptions.
Benchmark comparison
| Source | Market Size | Gaps in Research Methodology |
|---|---|---|
| Mordor Intelligence | USD 4.69 M (2026) | |
| Global Consultancy A | USD 5.79 B (2025) | Reported as a revenue market size, so the total can move mainly due to assumed price levels and currency timing, even if physical tons change only slightly. |
| Industry Publisher B | USD 6.34 B (2023) | Uses an earlier base year and a value-based scope that can include broader commercial assumptions around grade mix and realized pricing, which are not directly comparable to a tonnage model. |
Taken together, the spread is largely explained by volume versus value reporting, the year chosen as the reference point, and how pricing and grade mix are treated. By keeping the inputs tied to observable physical indicators and then checking them with market participants, the final number stays traceable and easier to reproduce when assumptions are updated.
Key Questions Answered in the Report
What is the current size of the adipic acid market?
The adipic acid market reached 4.69 million tons in 2026 and is projected to grow to 5.55 million tons by 2031.
Which region dominates the adipic acid market?
Asia-Pacific leads with 46.88% share and also posts the fastest 4.98% CAGR through 2031.
Why are polyurethanes the fastest-growing end product?
Rising demand for high-performance insulation and automotive interior foams is pushing polyurethane consumption at a 5.26% CAGR.
How are bio-fermentation routes impacting market dynamics?
Fermentation technologies growing at 4.82% CAGR promise lower emissions and comparable costs, challenging nitric-acid oxidation’s dominance.
What are the main restraints to market growth?
Cyclohexanone price volatility and technical scale-up challenges in bio-fermentation remain the key hurdles.