
Market Overview
| Study Period | 2020 - 2031 |
|---|---|
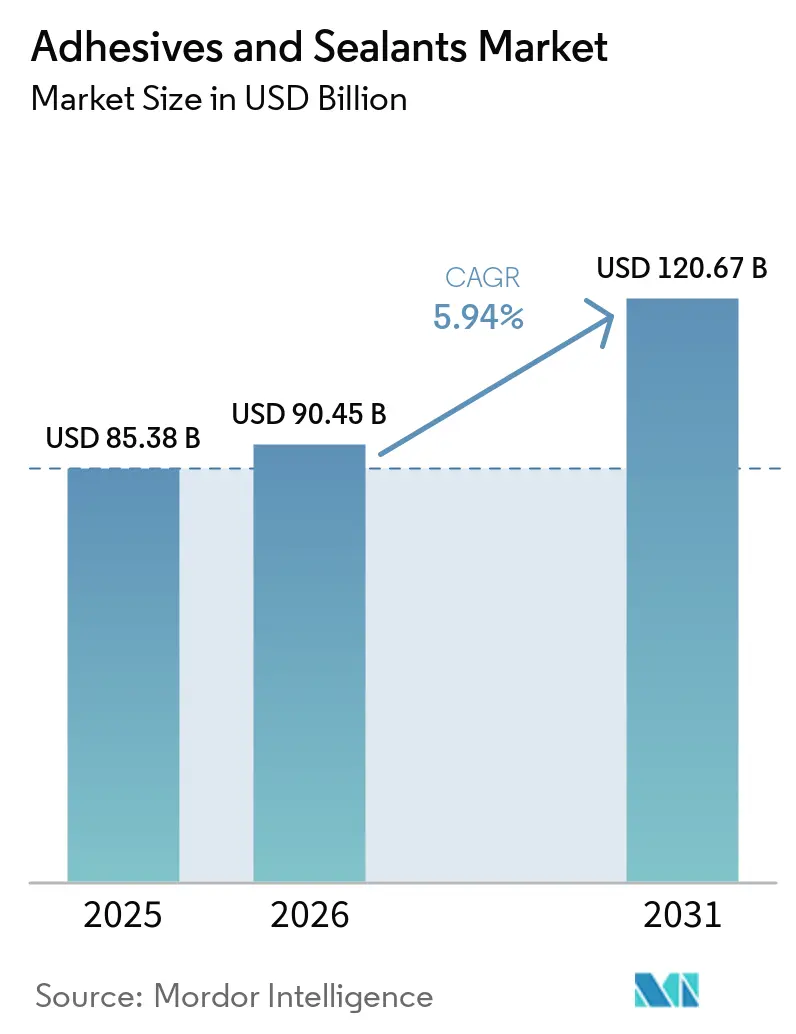
| Market Size (2026) | USD 90.45 Billion |
| Market Size (2031) | USD 120.67 Billion |
| Growth Rate (2026 - 2031) | 5.94 % |
| Fastest Growing Market | Asia Pacific |
| Largest Market | Asia Pacific |
| Market Concentration | Low |
Major Players *Disclaimer: Major Players sorted in no particular order Image © Mordor Intelligence. Reuse requires attribution under CC BY 4.0. | |
Adhesives and Sealants Market Analysis by Mordor Intelligence
Adhesives And Sealants Market size in 2026 is estimated at USD 90.45 billion, growing from 2025 value of USD 85.38 billion with 2031 projections showing USD 120.67 billion, growing at 5.94% CAGR over 2026-2031. Strong gains stem from rising demand for high-performance bonding solutions that support light-weighting in vehicles, automated e-commerce packaging, and modular construction. Regulatory pressure for lower-emission chemistries, especially under the EU Green Deal, is accelerating the shift toward bio-based and low-VOC formulations. Asia-Pacific remains the growth engine, supported by industrial expansion and infrastructure spending, while North America and Europe focus on technology upgrades that meet strict sustainability rules. Supply chain fragility for isocyanates and acrylic monomers continues to influence pricing, prompting producers to diversify feedstocks and invest in bio-based routes. Competitive dynamics are increasingly shaped by silicone and reactive technologies, which promise superior durability, higher temperature resistance, and improved processing speeds.
Key Report Takeaways
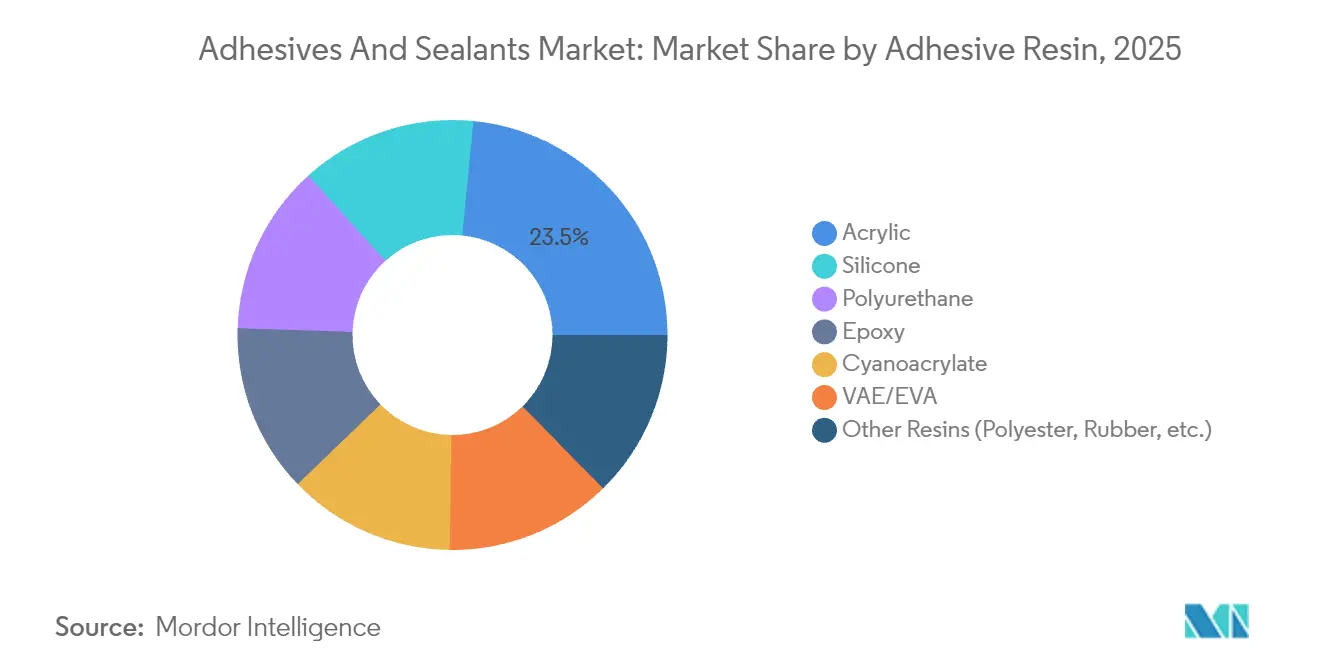
- By resin, acrylics held 23.45% of the adhesives and sealants market in 2025, while silicone resins are expected to expand at 8.23% CAGR over 2026-2031.
- By technology, water-based solutions accounted for 41.70% revenue in 2025, while the adhesives and sealants industry sees reactive systems forecasted to post the fastest 7.98% CAGR to 2031.
- By sealant resin, silicone captured 44.35% revenue in 2025, while the adhesives and sealants industry sees polyurethane sealants on track for a 5.58% CAGR over the outlook.
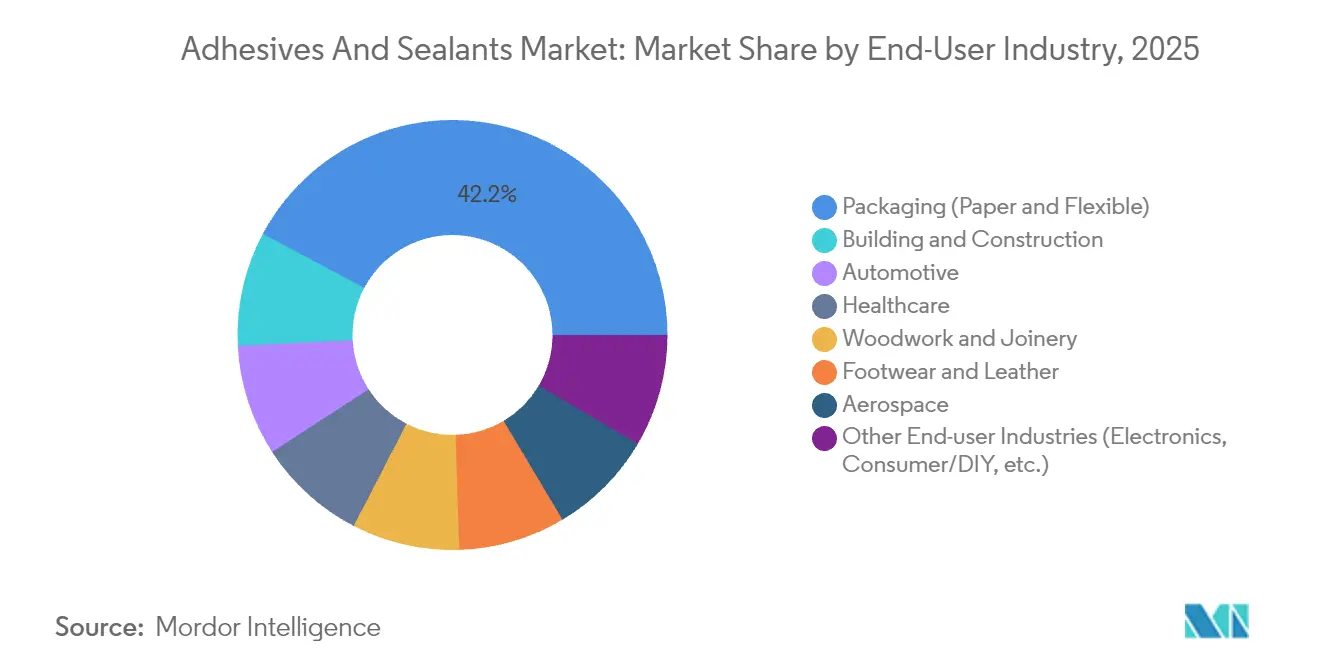
- By end-user, packaging led with 42.20% of the adhesives and sealants market share in 2025; building and construction is projected to grow at 6.32% CAGR through 2031.
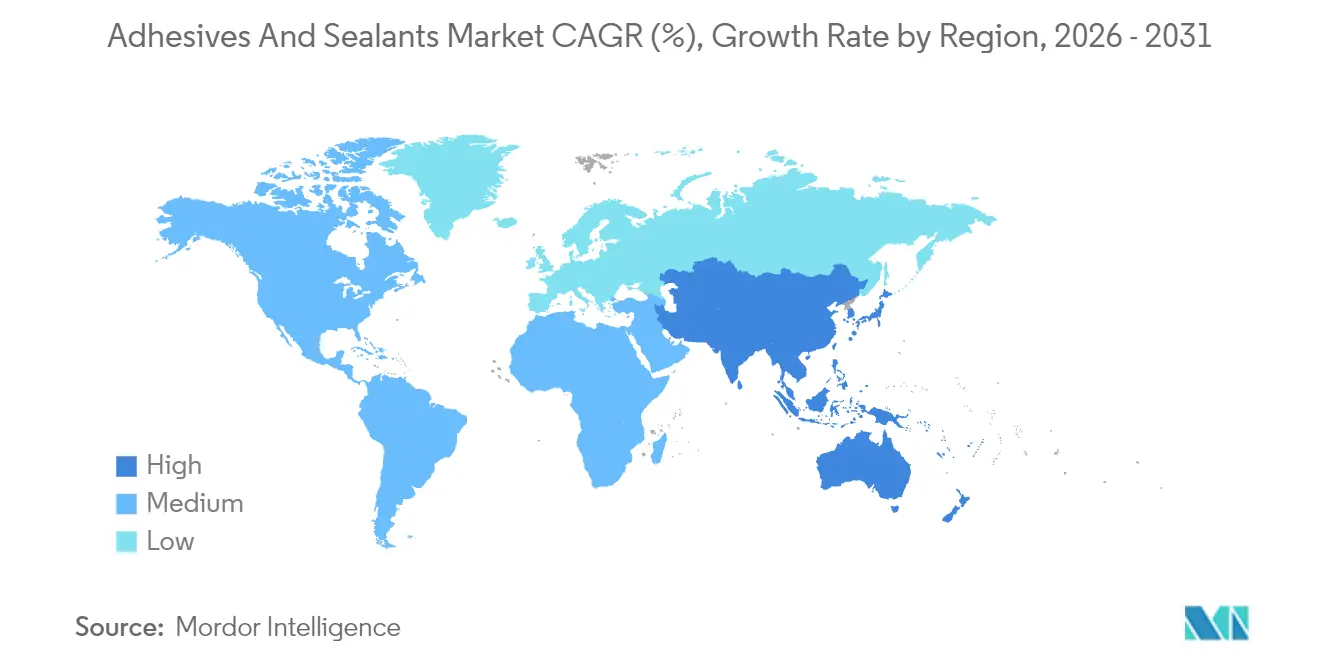
- By geography, Asia-Pacific commanded a 36.70% adhesives and sealants market share in 2025 and is growing at 6.44% CAGR.
Note: Market size and forecast figures in this report are generated using Mordor Intelligence’s proprietary estimation framework, updated with the latest available data and insights as of 2026.
Market Trends and Insights
Drivers Impact Analysis of Adhesives and Sealants Market*
| Driver | (~) % Impact on CAGR Forecast | Geographic Relevance | Impact Timeline |
|---|---|---|---|
| Surge in Lightweight Multi-material Vehicle Assemblies Boosting Structural Adhesive Uptake | +1.40% | North America, Europe, Asia-Pacific | Medium term (2-4 years) |
| Explosive Growth of E-commerce Requiring High-Performance Packaging Adhesive Solutions Globally | +1.10% | Global | Short term (≤ 2 years) |
| Rapid Expansion of Modular & Prefabricated Construction Methods in Asia-Pacific | +0.90% | Asia-Pacific | Medium term (2-4 years) |
| EU Green Deal & Global Regulatory Push Accelerating Bio-based, Low-VOC Adhesives | +1.20% | Europe, North America | Long term (≥ 4 years) |
| Healthcare Wearables Adoption Driving Medical-grade Reactive Hot-Melt Adhesives | +0.60% | North America, Europe, Asia-Pacific | Medium term (2-4 years) |
| Source: Mordor Intelligence | |||
Surge in Lightweight Multi-material Vehicle Assemblies Boosting Structural Adhesive Uptake
Electric-vehicle makers are replacing welds and rivets with structural adhesives to save weight, improve crash performance, and enable joining of aluminum, composites, and high-strength steel[1]. Adhesives also secure battery housings, where they manage heat and provide electrical insulation. Thermal interface materials inside packs prevent runaway and extend battery life, creating a specialized niche within the adhesives and sealants market. Automakers expect bonding technologies to remain dimensionally stable across wide temperature swings and resist fluid exposure for the entire vehicle lifespan. Such stringent requirements are pushing formulators toward reactive polyurethane hot-melts and modified epoxies that combine strength with flexibility. Growing EV penetration therefore acts as a structural demand catalyst for the adhesives and sealants market.
Explosive Growth of E-commerce Requiring High-Performance Packaging Adhesive Solutions Globally
Direct-to-consumer shipping exposes cartons to vibration, humidity, and temperature extremes, prompting brand owners to adopt high-tack hot-melt and water-based systems that keep packages sealed throughout complex logistics chains. Packaging represents 43% of the adhesives and sealants market and continues to expand as e-commerce volumes rise. Sustainability standards now require adhesives compatible with recycling streams; Henkel and Packsize introduced Eco-Pax, a bio-based hot-melt that can cut greenhouse gas emissions by 32% per 340 million boxes produced annually. Automated case-erection lines also demand low-viscosity grades that flow at reduced temperatures to save energy. Innovation in this driver underpins steady volume growth in the adhesives and sealants market.
Rapid Expansion of Modular & Prefabricated Construction Methods in Asia-Pacific
Urbanization and labor shortages are accelerating prefabrication, which relies on fast-curing adhesives for factory-built wall panels, façade elements, and flooring systems. Building and construction is the fastest-growing end-use at 6.50% CAGR, and silicone-based products dominate exterior joints due to superior UV and moisture resistance. Polyurethane and hybrid sealants bond dissimilar materials like glass fiber reinforced concrete and engineered timber, providing structural integrity during transport and installation. As governments in China, India, and Southeast Asia fund large housing schemes, demand for resilient bonding solutions increases in tandem. This development strengthens regional consumption within the adhesives and sealants market.
EU Green Deal & Global Regulatory Push Accelerating Bio-based, Low-VOC Adhesives
The forthcoming 2025 REACH revision will introduce stricter chemical rules, including PFAS bans and essential-use criteria that compel manufacturers to reformulate. Formaldehyde emission limits effective August 2026 further squeeze solvent-borne chemistries[2]. Producers answer with starch, lignin, and captured-CO₂-based polymers, as shown by Henkel and Celanese’s carbon-reuse partnership. Bio-based silicone sealants certified under REDcert2, such as ELASTOSIL eco, also illustrate regulatory-driven innovation. Compliance costs are significant, yet early movers gain competitive advantage, reinforcing sustainability as a core growth driver for the adhesives and sealants market.
Restraints Impact Analysis of Adhesives and Sealants Market*
| Restraint | (~) % Impact on CAGR Forecast | Geographic Relevance | Impact Timeline |
|---|---|---|---|
| Volatile Isocyanate & Acrylic Monomer Supply Chains Creating Cost Pressures | -0.80% | Global | Short term (≤ 2 years) |
| Stringent Environmental Regulations Regarding VOC Emissions | -0.60% | North America, Europe | Medium term (2-4 years) |
| Low Substitution Cost of Mechanical Fasteners in Emerging Markets Limiting Penetration | -0.40% | Latin America, Africa, South-East Asia | Short term (≤ 2 years) |
| Source: Mordor Intelligence | |||
Volatile Isocyanate & Acrylic Monomer Supply Chains Creating Cost Pressures
New EU rules require special training for anyone handling polyurethane systems with greater than 0.1% free isocyanate, adding administrative cost and limiting smaller converters’ access. Parallel tightness in acrylic acid supply elevates price volatility, prompting end users to renegotiate contracts quarterly. Producers hedge by localizing feedstock procurement and adopting bio-routes from vegetable oils, yet these measures involve capital outlays that weigh on margins. Sudden spikes in raw-material indices ripple through downstream prices, delaying project approvals in construction and automotive. The adhesives and sealants market must therefore navigate cost inflation while maintaining performance, a balancing act that tempers the growth outlook.
Stringent Environmental Regulations Regarding VOC Emissions
The District of Columbia caps VOC content in a wide range of adhesive categories, mirroring similar rules across U.S. states[3]. Green Seal’s 2025 prohibition of PFAS in adhesives tightens compliance further, forcing reformulation and added testing expense. Solvent-borne products, valued for fast-setting and high-strength attributes, face declining acceptance in favor of water-borne or reactive alternatives. Manufacturers invest in R&D to retain performance without exceeding emission thresholds, yet technology transitions take time and resources. These constraints moderate demand expansion for solvent-heavy lines, placing a structural cap on part of the adhesives and sealants market.
*Our forecasts treat driver/restraint impacts as directional, not additive. The impact forecasts reflect baseline growth, mix effects, and variable interactions.
Adhesives and Sealants Market Segment Analysis
By Adhesive Resin:
Acrylic Dominance Challenged by Silicone InnovationAcrylic resins generated 23.45% of the adhesives and sealants market revenue in 2025, favored for broad substrate compatibility and moderate cost. Nevertheless, silicone’s 8.23% CAGR over 2026-2031 signals a pivot toward high-temperature, weather-resistant applications, notably in automotive electronics and building facades. Performance differentiation drives this shift. Silicone adhesives retain elasticity from −50 °C to 200 °C, remain electrically insulating, and resist UV degradation, making them fit for LED assemblies and 5G antenna modules. Acrylics respond with next-generation formulations that cure faster and bond low-surface-energy plastics through functional monomer modifications. Polyurethane remains the choice for structural joints exposed to dynamic loads, while cyanoacrylates serve precision medical and consumer electronics uses. Bio-based epoxies produced from glycerol and lignin showcase early-stage potential, signaling a gradual decarbonization of the adhesives and sealants industry.

By Adhesive Technology:
Water-based Solutions Lead Environmental TransitionWater-based systems held 41.70% revenue in 2025, aided by compliance with regional VOC caps and robust adhesion on porous substrates. They dominate corrugated box sealing, label lamination, and furniture assembly, all critical subsegments of the adhesives and sealants market. Product advances in polymer dispersion lower drying times, addressing historical speed constraints on automated lines.
Reactive technologies deliver the fastest 7.98% CAGR in the adhesives and sealants industry because they crosslink into thermoset networks, achieving structural strength once considered exclusive to epoxies. Reactive polyurethane hot-melts supply instant green strength plus final chemical bonding after moisture exposure, reducing assembly time for appliance and transportation manufacturers. UV-cured acrylates address electronics and medical devices where solvent elimination and rapid throughput are essential. Solvent-borne and rubber-based systems persist in niche uses, such as automotive interior trim and footwear, where their unique balance of tack and peel strength offsets regulatory hurdles.
By Sealant Resin:
Silicone’s Versatility Drives Market LeadershipSilicone sealants captured 44.35% revenue in 2025 through unrivaled flexibility and 25-year durability, especially in exterior glazing, curtain walls, and solar module framing. New carbon-balanced offerings, including ELASTOSIL eco, substitute conventional methanol with plant-based biomethanol and lower cradle-to-gate emissions by up to 40%. Polyurethane sealants follow with a 5.58% CAGR, propelled by expansion-joint applications in highways and rail. Acrylic latex sealants cater to interior finishing where paintability and low shrinkage are valued. Hybrid silane-terminated polyether chemistries blend silicone flexibility with polyurethane toughness, rising quickly in transportation and renewable-energy structures. Tightening LEED and BREEAM criteria on VOC emissions further favor low-odor formulations, directing a sizable portion of future spending toward greener sealant chemistries within the broader adhesives and sealants market.
By End-user Industry:
Packaging Dominance Reflects E-commerce RevolutionPackaging retained a 42.20% adhesives and sealants market share in 2025, supported by omnichannel retail growth and the drive for tamper-evident closures. Formulators are commercializing hot-melts like Tecbond 214B, the first fully certified biodegradable grade made with 44% bio-content.
Building and construction will post the fastest 6.32% CAGR as green building codes mandate durable, low-emission bonding solutions. Automotive electrification demands thermal-conductive adhesives for battery assemblies, while the healthcare segment looks to reactive hot-melts that replace sutures and staples in wound closure. Footwear, woodworking, and electronics round out demand, each requiring tailored chemistries to balance flexibility, speed, and environmental profile.
Geography Analysis
APAC Adhesives and Sealants Market
Asia-Pacific generated 36.70% of global revenue in 2025 and is growing at 6.44% CAGR, driven by infrastructure megaprojects and the relocation of electronics supply chains into ASEAN nations. China continues large-scale high-speed rail and renewable-energy investments, stimulating demand for structural adhesives, structural sealants, and wind blade bonding systems. India’s USD 1.4 trillion National Infrastructure Pipeline channels adhesive consumption into roads, airports, and affordable housing. Electronics manufacturing in Vietnam and South Korea deepens regional requirements for low-void, high-thermal-conductivity adhesives used in semiconductors and display panels. Silicone products benefit most, given relentless pursuit of temperature stability in these sectors, ensuring Asia-Pacific retains primacy within the adhesives and sealants market.
North America Adhesives and Sealants Market
North America represents a mature arena emphasizing technology differentiation and rapid regulatory alignment. U.S. electric-vehicle output surpassed 1 million units in 2024, raising consumption of structural, crash-durable adhesives for battery packs and body-in-white assemblies. Federal funding for bridges and broadband further elevates demand for civil-engineering sealants that remain flexible under extreme climates. Canadian wood-frame construction accelerates adoption of polyurethane adhesives that improve energy efficiency through airtight assemblies. The adhesives and sealants market shows steady mid-single-digit growth as producers offer drop-in water-borne alternatives conforming to CARB and EPA VOC limits.
Europe Adhesives and Sealants Market
Europe is shaped by the EU Green Deal’s call for carbon-neutral products by 2050. Manufacturers accelerate the transition to lignin-based phenolic alternatives and bio-renewable epoxies to retain market access. German and Nordic prefabrication plants rely on certified low-VOC adhesives in cross-laminated timber modules, reinforcing silicone demand for window and façade sealing. The adhesives and sealants market in Europe benefits from stringent quality expectations, though compliance costs lower EBIT margins. Eastern European vehicle plants broaden production footprints, amplifying regional adhesive requirements.
South America Adhesives and Sealants Market
South America remains a small but vibrant arena. Brazil’s housing deficit spurs government-funded social programs that channel silicone and acrylic sealants into low-cost housing. Argentina’s agricultural packaging sector benefits from hot-melt upgrades to address prolonged storage and export routes. Chilean miners apply hybrid sealants that withstand acid exposure, adding niche growth pockets inside the adhesives and sealants market.
MEA Adhesives and Sealants Market
The Middle East & Africa lean on infrastructure ambitions such as Saudi Arabia’s NEOM city and Nigeria’s Lagos-Ibadan railway. Harsh climates reward silicone and polysulfide sealants with elevated UV and sand-abrasion resistance. Import substitution policies in the Gulf encourage local adhesive plants, reducing freight costs and delivery times. Overall, diverse climatic and regulatory landscapes shape differentiated product lineups for regional players in the adhesives and sealants market.
Regulatory Landscape
Regulation continues to push formulations toward lower-emission and lower-concern chemistries, with Europe and the United States shaping many of the practical constraints for global adhesive and sealant portfolios. In the European Union, a REACH amendment adopted on July 14, 2026 (EU 2026/1289) introduced a 0.1% combined limit for D4 and D5 content in silicone sealants, effective January 1, 2027. This tightens compliance and testing requirements for silicone-based sealant producers and private-label fillers.
In North America, air-quality and product labeling rules reinforce the shift away from higher-VOC categories. South Coast Air Quality Management District (SCAQMD) Rule 1168 requires display of percent VOC by weight for foam sealants from January 1, 2026, while U.S. air-plan approvals tied to ozone ambient air quality standards continue to influence state-level controls for adhesives and sealants. Voluntary ecolabel and procurement standards also act as a gatekeeper for select channels, including Green Seal GS-36 (Edition 2.2, March 11, 2025) for commercial adhesives, which adds pressure to substantiate environmental attributes and screen restricted substances.
Value Chain Analysis
The value chain starts with upstream petrochemical and specialty intermediates, including acrylic monomers and isocyanates, then moves into formulation and compounding by global and regional producers. Materials are packaged into cartridges, pails, drums, and specialty formats such as tapes, before distribution through direct key-account supply, industrial distributors, and retail/DIY channels. Downstream demand is anchored by high-throughput converters in packaging (42.20% share in 2025) and by project-based consumption in building and construction, where OEM qualification and application engineering often sit between formulation and adoption in automotive, electronics, and infrastructure.
Industry bodies such as FEICA in Europe and the Adhesives and Sealants Council (ASC) in North America shape day-to-day practices through guidance on sustainability, safe use, and harmonization. This influence is more pronounced in a fragmented supplier base that includes many SMEs. Raw-material risk management and circular-economy requirements are also increasingly central, pushing producers and end users toward lower-VOC technologies such as water-borne and reactive systems, while requiring documentation for recyclability and chemical compliance, particularly for silicone sealants and polyurethane systems where training obligations and restrictions are tighter.
Competitive Landscape
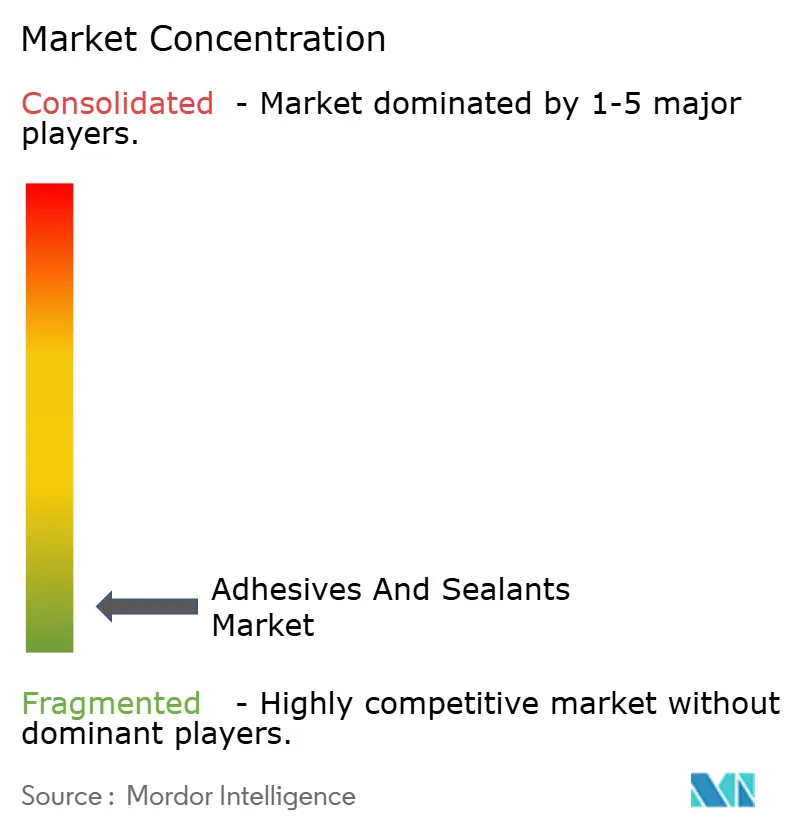
The adhesives and sealants exhibits highly fragmented concentration. The top 10 players hold less than 45% of global revenue. Henkel’s Adhesive Technologies unit posted EUR 10.79 billion sales in 2023 and EUR 5.48 billion during H1 2024, powered by customer-centric formulations and sustainability branding. H.B. Fuller expanded into wound-closure and tissue-bonding through Medifill and GEM acquisitions in December 2024, strengthening exposure to the fast-growing medical segment.
Strategic alliances target low-carbon innovation. Henkel and Covestro co-develop polyurethane encapsulants using renewable polyols, seeking to shrink construction’s 40% global emissions contribution. Similarly, Celanese supplies captured-CO₂-based acetic acid to Henkel for bio-adhesives that reduce fossil content by 20%. Smaller specialists carve high-margin niches: DELO invests 15% of revenue in R&D, focusing on optical-grade adhesives for camera modules.
Mergers and acquisitions remains active. Saint-Gobain agreed to acquire Dubai-based Fosroc, enhancing construction chemical portfolios in the Middle East. Private equity interest persists, evidenced by Onex acquiring a majority stake in cartridge manufacturer Fischbach, signaling confidence in infrastructure-related sealant demand. Collectively, these moves model a landscape where scale, sustainability, and specialization co-exist in shaping the adhesives and sealants market.
Adhesives and Sealants Industry Leaders
-
Henkel AG & Co. KGaA
-
3M
-
Sika AG
-
H.B. Fuller Company
-
Arkema S.A. (Bostik)
- *Disclaimer: Major Players sorted in no particular order
Adhesives and Sealants Market Companies Covered in this Report
- 3M
- Aica Kogyo Co. Ltd.
- Akzo Nobel N.V.
- Arkema S.A. (Bostik)
- Avery Dennison Corporation
- DELO Industrial Adhesives
- DIC Corporation
- Dow
- DuPont
- Dymax
- H.B. Fuller Company
- Henkel AG & Co. KGaA
- Illinois Tool Works Inc.
- MAPEI S.p.A.
- Nanpao Resins Chemical Group
- Parker Hannifin
- Permabond LLC
- Pidilite Industries Ltd.
- RPM International Inc.
- Sika AG
- Soudal Group
- Wacker Chemie AG
Market Opportunities and Future Outlook
Regulatory pressure and customer substitution away from higher-concern inputs create whitespace for silane-modified polymer (SMP) and other low-emission technologies that provide comparable performance across transportation and construction use cases. In 2026, Henkel has been commercializing this shift through launches such as TEROSON MS 9381 HPT (tin-free adhesive-sealant for heavy equipment) and TEROSON MS 949 FR (rail-focused fire-retardant adhesive-sealant positioned to avoid substances of concern). Together, these product moves show where reformulation budgets are being deployed and how compliance-led differentiation is being used to win specification positions.
Circular-economy programs also offer growth avenues via debonding and disassembly-enabling solutions that support mechanical and chemical recycling pathways, a theme promoted by FEICA through its circular economy work. On the supply side, geographic expansion and localization of production and distribution remain a practical lever to shorten service lead times and improve access in fast-growing regional construction and manufacturing corridors. For instance, Sika’s February 2026 announcement to acquire Akkim strengthens its footprint in Turkey and surrounding markets, aligning capacity and route-to-market with infrastructure and industrial end uses that consume sealants and construction adhesives at scale.
Recent Industry Developments in Adhesives and Sealants Market
- July 2026: Sika Corporation launched Sikalastic Rapid PMMA for flashing and roofing/waterproofing applications. The launch targets roofing/waterproofing segment within adhesives/sealants. The consolidation of Sika’s roofing/waterproofing branding under a unified Rapid PMMA family aims to capture project-based demand.
- June 2026: Henkel technology supported completion of the Sagrada Familia central towers using Loctite or related adhesive systems. The milestone provides a high-visibility structural bonding reference. It signals Henkel’s capability in high-end structural bonding markets.
- April 2026: Henkel launched Teroson MS 9381 HPT tin-free adhesive-sealant for heavy equipment applications. The product expands availability for heavy equipment applications. It supports the sustainability push with a nickel-free formulation and broader end-market reach.
Adhesives and Sealants Market Report Scope and Research Methodology
Market Definition and Coverage
For this study, the market covers revenues generated from adhesives and sealants sold for bonding, joining, sealing, and gap-filling across industrial and consumer end uses, captured at the point of sale in the value chain and reported in USD.
Scope exclusions: We exclude non-adhesive binder resins used in engineered wood products and other adjacent chemicals that are not sold as adhesives or sealants.
Segments Covered in This Report
- By Adhesive Resin
- Polyurethane
- Epoxy
- Acrylic
- Silicone
- Cyanoacrylate
- VAE / EVA
- Other Resins (Polyester, Rubber, etc.)
- By Adhesive Technology
- Solvent-borne
- Reactive
- Hot Melt
- UV-cured
- Water-borne
- By Sealant Resin
- Silicone
- Polyurethane
- Acrylic
- Epoxy
- Other Resins (Bituminous, Polysulfide UV-curable, etc.)
- By End-user Industry
- Aerospace
- Automotive
- Building and Construction
- Footwear and Leather
- Healthcare
- Packaging (Paper and Flexible)
- Woodwork and Joinery
- Other End-user Industries (Electronics, Consumer/DIY, etc.)
- By Geography
- Asia-Pacific
- China
- India
- Japan
- South Korea
- Indonesia
- Malaysia
- Thailand
- Vietnam
- Rest of Asia-Pacific
- North America
- United States
- Canada
- Mexico
- Europe
- Germany
- United Kingdom
- France
- Italy
- Spain
- Russia
- Turkey
- Nordic Countries
- Rest of Europe
- South America
- Brazil
- Argentina
- Colombia
- Rest of South America
- Middle East and Africa
- Saudi Arabia
- United Arab Emirates
- Qatar
- Egypt
- South Africa
- Algeria
- Rest of Middle and Africa
- Asia-Pacific
Data Sources, Market Sizing, and Validation
Desk Research
Desk work starts with mapping demand pools and macro indicators that explain where adhesives and sealants are consumed, and then tying those signals to what is produced and traded. We mainly use public, repeatable sources such as UN Comtrade trade statistics, USGS minerals and materials data, the US Census Bureau manufacturing series, Eurostat industrial output series, and IEA energy and industry indicators, depending on regional relevance.
From there, we cross-check industry specifics using sources such as patent databases, company annual reports and investor presentations, and technical publications that track resin and formulation trends. For pricing and volume guardrails, we also reference paid subscriptions that compile company financials, track shipment-level import and export movements, and screen patent activity. This helps us spot breaks in trend before the model is finalized. The desk sources listed here are illustrative, and other public and paid references were used for data collection, validation, and clarification.
Primary Interviews and Surveys
Primary work is used to turn desk signals into usable assumptions, especially where product mix and pricing move differently across regions and end uses. We spoke with a mix of manufacturers, distributors, formulators, and downstream users in packaging, construction, automotive, woodworking, and electronics, and then reconciled differences when views did not align.
To keep the model grounded, the interviews focused on practical items such as average pricing direction by chemistry, substitution between technologies (for example, solvent to water-based), regional demand pacing, and how raw material volatility flows into selling prices.
Distribution of primary research fieldwork respondents
| Company type | Respondent position | Region |
|---|---|---|
| Top tier: 37% | CXOs: 15% | APAC: 44% |
| Mid tier: 43% | Functional/Unit leaders: 42% | EMEA: 31% |
| Smaller Players: 20% | Managers: 43% | Americas: 25% |
Market-Sizing & Forecasting
Sizing starts with a top-down build where production and trade data, end-use activity, and penetration rates are used to reconstruct the addressable consumption pool by region. Before the final totals are locked, we corroborate outputs using selective bottom-up approximations, such as sampled volume by application multiplied by observed price ranges, and supplier and channel checks that test whether the implied demand looks realistic.
Key inputs used in the model include construction output and housing starts (as a proxy for sealant and flooring demand), packaging and paperboard activity (to anchor carton sealing and labeling needs), vehicle production trends (to reflect structural bonding and lightweighting), industrial production indices, and observed shifts in resin and technology mix that affect average selling prices. When country-level coverage leaves gaps, we fill missing pieces using proxy ratios from comparable economies, then adjust after primary feedback, so the roll-up does not overstate small markets.
For the forecast, we apply scenario analysis supported by short time-series smoothing for stable end uses, and then layer expert views on cycle timing where construction or automotive is volatile. The assumptions are kept explicit so a change in demand growth or pricing can be re-run quickly and traced back to the same inputs.
Data Validation & Update Cycle
Validation is done through multiple checks so the final number is not dependent on one data stream. Model outputs are compared against independent signals such as regional chemical output trends, trade direction changes, and end-use activity indicators. If we see large variances, we investigate until the cause is clear.
Before sign-off, the work goes through step-by-step analyst review, including unit consistency checks, currency conversion timing checks, and year-over-year movement tests to catch unusual jumps. If a mismatch is material, we re-contact sources to confirm whether it is driven by mix changes, pricing resets, or temporary destocking. Reports are refreshed annually, and interim updates are made when major events shift demand, feedstock pricing, or regulations, followed by a final pre-delivery pass to reflect the latest available information.
Mordor Intelligence's Adhesives and Sealants Market Size Compared With Other Published Estimates
Published market sizes for adhesives and sealants can look far apart because each estimate draws the scope line differently, and each also handles price and mix changes in its own way. Differences usually come from what gets counted as an adhesive or sealant versus an adjacent binder, which end uses are treated as in-scope, and whether figures are shown as demand value or broader industry revenue.
A second set of gap drivers comes from the math behind average selling prices and the timing of currency conversion, especially when feedstocks swing and regional inflation differs. Some publishers anchor totals to an older base year and carry forward a single growth rate, while others update resin mix, end-user weights, and regional split assumptions more frequently, which changes the starting point and the slope.
Benchmark comparison
| Source | Market Size | Gaps in Research Methodology |
|---|---|---|
| Mordor Intelligence | USD 90.45 B (2026) | |
| Industry Publisher A | USD 81.00 B (2025) | This figure is presented as demand value in current dollars and can exclude adjacent items like engineered wood binder resins and some starch-related uses, which typically pulls totals down versus broader revenue-based market accounting. |
| Industry Publisher B | USD 102.50 B (2024) | This estimate appears to use a wider application and product inclusion approach and can also be more sensitive to near-term price spikes, so the implied ASP and mix uplift can push the value higher in the base year. |
The spread across sources mostly reflects scope choices and how pricing and mix are refreshed when end uses and chemistries shift quickly. When end-user pacing, resin mix, and price progression are rechecked with trade and production signals and then revalidated through interviews, the market total becomes easier to explain and reproduce. This is the approach applied here by Mordor Intelligence.
Key Questions Answered in the Report
What is the current size of the adhesives and sealants market?
The adhesives and sealants market is valued at USD 90.45 billion in 2026 and is projected to reach USD 120.67 billion by 2031.
Which region shows the fastest growth in the adhesives and sealants market?
Asia-Pacific leads with a 36.70% revenue share in 2025 and a forecast 6.44% CAGR, driven by industrial and infrastructure expansion.
Which end-user industry dominates adhesive and sealant market demand?
Packaging commands 42.20% of 2025 revenue due to rising e-commerce volumes and demand for sustainable sealing solutions.
What technology segment is growing the fastest?
Reactive adhesive technologies are expected to register a 7.98% CAGR between 2026 and 2031, outpacing other chemistries.
How are regulations affecting product development in adhesive and sealant market?
Stricter EU and U.S. VOC and PFAS limits push manufacturers toward bio-based, low-emission formulations, reshaping R&D priorities.
Who are the key players in the adhesives and sealants market?
Henkel AG & Co. KGaA, 3M, Sika AG, H.B. Fuller Company, and Arkema are the key players in the adhesives and sealants market.