
Adhesive Tapes Market Size and Share
Market Overview
| Study Period | 2021 - 2031 |
|---|---|
| Market Volume (2026) | 60.98 Billion square meters |
| Market Volume (2031) | 74.73 Billion square meters |
| Growth Rate (2026 - 2031) | 4.15 % |
| Fastest Growing Market | Asia Pacific |
| Largest Market | Asia Pacific |
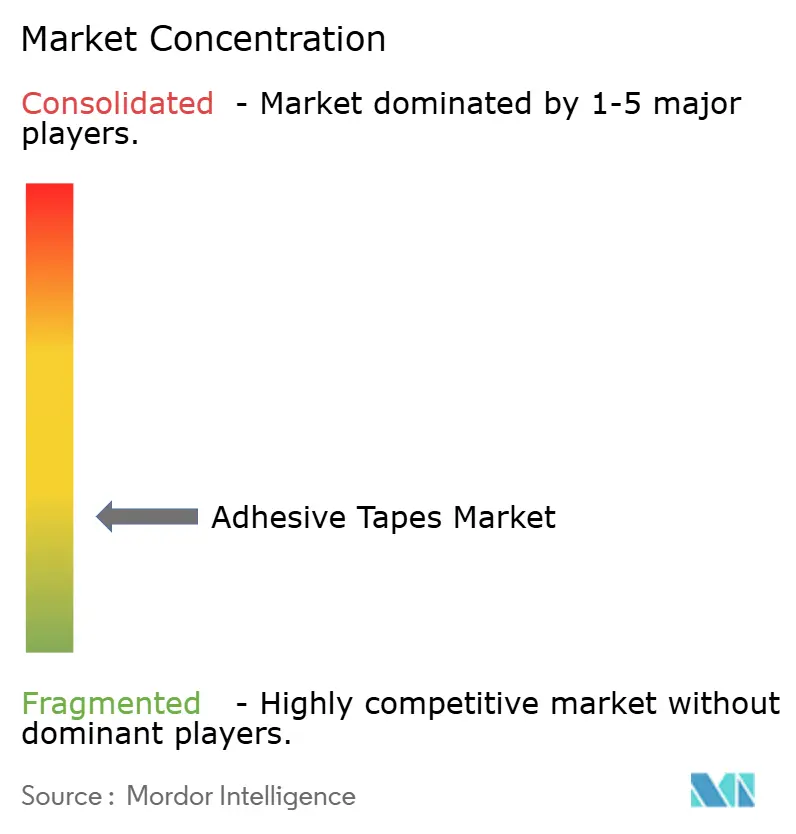
| Market Concentration | Low |
Major Players *Disclaimer: Major Players sorted in no particular order Image © Mordor Intelligence. Reuse requires attribution under CC BY 4.0. | |
Adhesive Tapes Market Analysis by Mordor Intelligence
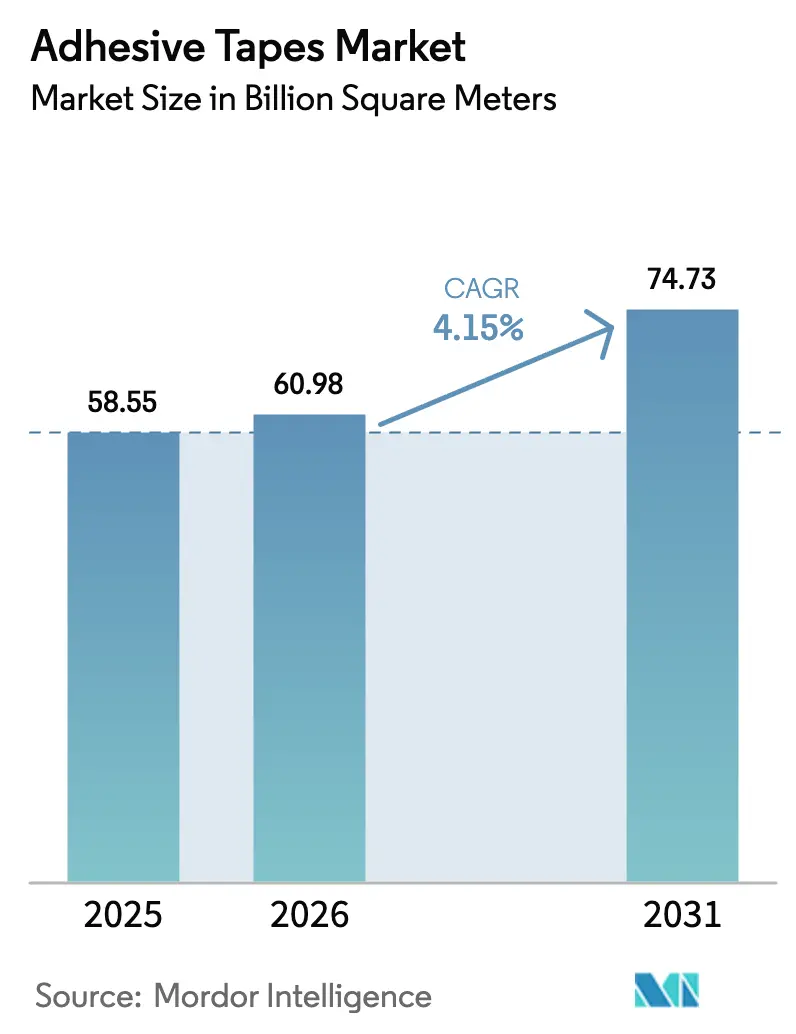
The Adhesive Tapes Market size is expected to grow from 58.55 Billion square meters in 2025 to 60.98 Billion square meters in 2026 and is forecast to reach 74.73 Billion square meters by 2031 at 4.15% CAGR over 2026-2031. This performance mirrors structural shifts—most notably e-commerce automation, vehicle electrification, and electronics miniaturization—that are redefining tape specifications and usage intensity. Fulfillment centers now run pressure-sensitive carton-sealing lines at more than 60 cartons per minute, which has multiplied demand for instant-tack, tamper-evident closures across North America, Europe, and Asia. OEMs are simultaneously replacing heavier PVC harness wraps with acrylic-backed cloth tapes that shave weight from each vehicle to meet fleet-average fuel-efficiency targets. On the formulation side, water-based and PFAS-free chemistries are gaining share as regulators tighten VOC and fluorochemical limits, while converters accelerate patent filings for conductive, stretchable, and bio-based systems that bring functional integration to commodity formats.
Key Report Takeaways
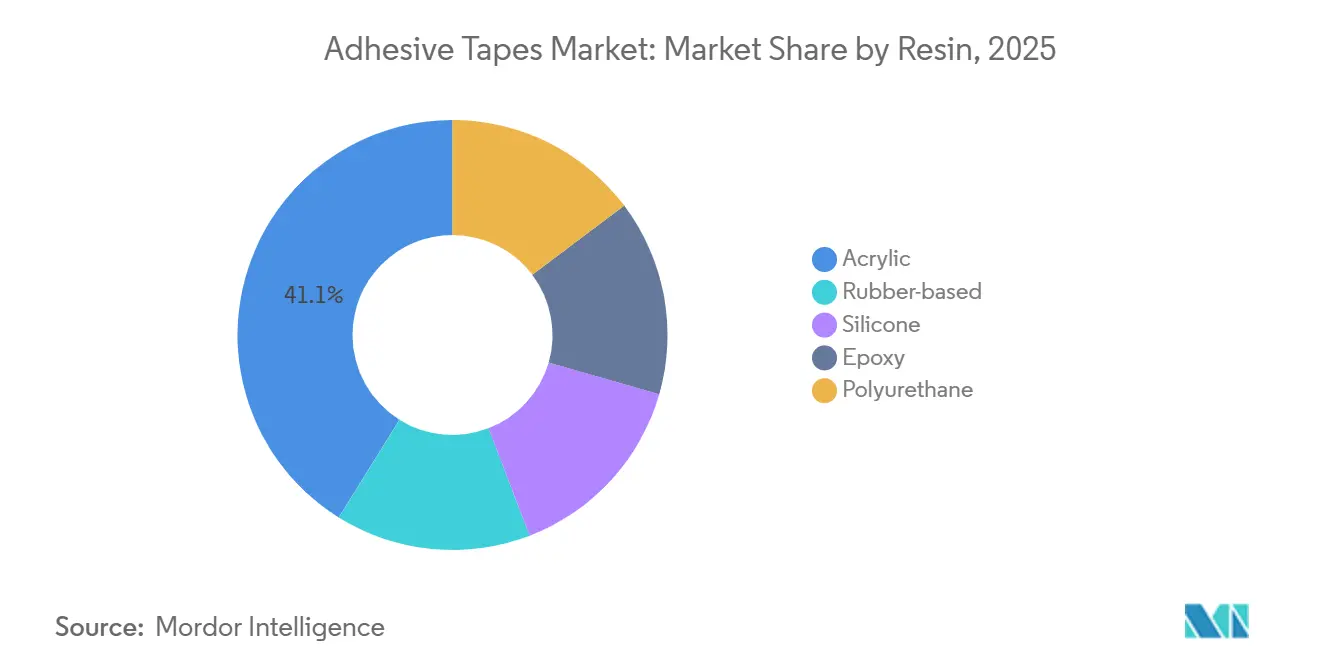
- By resin, acrylic led with 41.12% of 2025 volume, while rubber-based systems are advancing at a 4.29% CAGR through 2031.
- By technology, water-based chemistry captured a 45.19% share in 2025 and is forecast to post the fastest 4.51% CAGR.
- By product type, pressure-sensitive tapes held 61.12% share in 2025; heat-sensitive variants are pacing the category with a 4.58% CAGR.
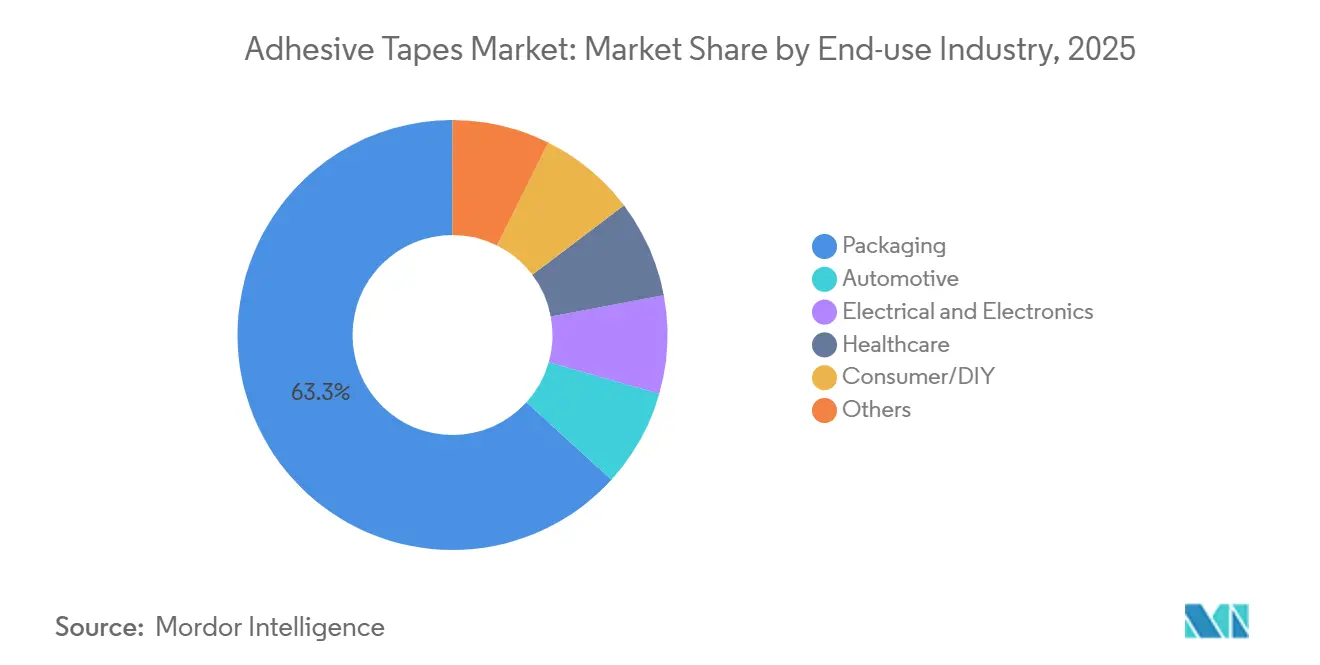
- By end use, packaging accounted for 63.26% of 2025 consumption, whereas healthcare is projected to grow at a 4.67% CAGR to 2031.
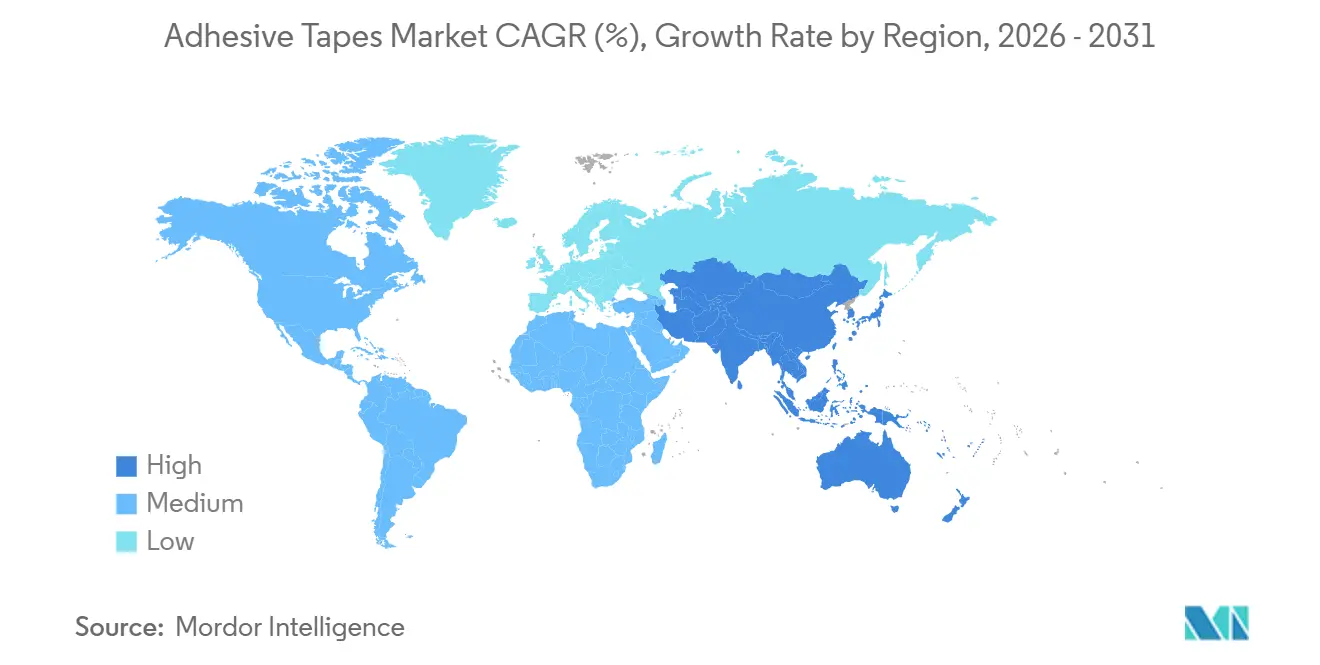
- By geography, Asia-Pacific dominated with a 58.91% share in 2025 and is set to expand at a 5.15% CAGR through 2031.
Note: Market size and forecast figures in this report are generated using Mordor Intelligence’s proprietary estimation framework, updated with the latest available data and insights as of January 2026.
Market Trends and Insights
Drivers Impact Analysis of Adhesive Tapes Market*
| Drivers | (~) % Impact on CAGR Forecast | Geographic Relevance | Impact Timeline |
|---|---|---|---|
| E-commerce packaging boom boosting adhesive tapes demand | +0.9% | Global, with concentration in North America, Europe, China, India | Medium term (2-4 years) |
| OEM shift to lightweight wire-harness tapes | +0.7% | APAC core (China, Japan, South Korea), spill-over to North America and Europe | Long term (≥ 4 years) |
| Wearable and flexible electronics adoption increasing tapes usage | +0.6% | Global, led by North America, Japan, South Korea | Medium term (2-4 years) |
| Construction boom in ASEAN and the Middle East boosting adhesive tape usage | +0.8% | ASEAN (Vietnam, Malaysia, Thailand), Middle East (Saudi Arabia, UAE, Qatar) | Short term (≤ 2 years) |
| EV battery-pack thermal/EMI tape integration | +0.5% | China, Europe, North America | Long term (≥ 4 years) |
| Source: Mordor Intelligence | |||
E-commerce Packaging Boom Boosting Adhesive Tapes Demand
Fulfillment giants like Amazon consumed significant volumes of pressure-sensitive packaging tape in 2025, a volume much higher than that of traditional retail distribution. Branded pre-printed rolls saw strong year-on-year growth, as converters reduced minimum order quantities to levels that empowered smaller sellers to utilize both tamper-evident and marketing features in a single closure. Legislative bodies are influencing material choices; for instance, the European Union's waste-packaging regulations favor water-activated kraft tapes, which are less likely to contaminate fiber recycling streams. Meanwhile, in humid logistics hubs across India and Southeast Asia, there is a shift towards synthetic-rubber hot-melt tapes. These tapes maintain tack at relative humidity above 80%, ensuring cartons are sealed without adhesive bleed. Collectively, these dynamics are not only increasing the penetration of carton-sealing tape in each shipped parcel but also bolstering the long-term growth of the adhesive tapes market.
OEM Shift to Lightweight Wire-Harness Tapes
Automakers are turning to acrylic cloth tapes, which are lighter than traditional PVC electrical wraps but offer the same dielectric strength. This switch results in a weight reduction per vehicle, translating to significant savings. These savings are crucial as they help automakers sidestep penalties for excess CO₂, in compliance with EU fleet regulations. Tesla’s Model Y, a testament to this trend, incorporates the new tape in its harness. In 2025, Japanese suppliers introduced flame-retardant polyester tapes that not only meet the stringent ISO 6722 Class D abrasion resistance standards but also do so without halogens, ensuring alignment with recyclability mandates. In 2025, China rolled out new-energy vehicles, each requiring harness tapes. This demand surge is attributed to battery platforms accommodating more cables than their combustion counterparts. The automotive industry's focus on lightweighting and safety propels the adhesive tapes market forward in automotive wiring.
Wearable and Flexible Electronics Adoption Increasing Tapes Usage
In 2025, Abbott shipped its FreeStyle Libre 3 glucose monitors. Each monitor utilized a medical-grade acrylic tape, designed to adhere for 14 days and successfully passed ISO 10993 tests. Foldable OLED displays required optically clear adhesive tape, boasting a haze level below 1% and proven durability for multiple fold cycles. In early 2025, the FDA granted clearance to Avery Dennison’s MED 5610 silicone tape, unlocking a lucrative opportunity in the wearable-pump market. Furthermore, patent filings for stretchable conductive adhesives saw a notable increase, highlighting a shift towards functional and skin-compatible bonding solutions. Such advancements firmly establish healthcare and consumer electronics as burgeoning leaders in the adhesive tapes market.
Construction Boom in ASEAN and Middle East Region Boosting Adhesive Tape Usage
In 2025, Saudi Arabia's ambitious NEOM project mandated the use of aluminum-foil acrylic tapes for its modular wall insulation, spurring additional demand. Meanwhile, Malaysia's East Coast Rail Link opted for halogen-free polyester harness tapes, ensuring compliance with the IEC 60332-3 fire safety standards. In Vietnam, a surge in manufacturing FDI heightened the demand for clean-room masking tapes, specifically those with particle counts under 100 per cubic foot. In Dubai, work on the Creek Tower resumed in 2025, utilizing high-bond acrylic foam tapes. These tapes not only replaced traditional mechanical fasteners but also slashed façade labor requirements. Such fast-tracked infrastructure projects are propelling a notable uptick in the regional adhesive tapes market.
Restraints Impact Analysis of Adhesive Tapes Market*
| Restraints | (~) % Impact on CAGR Forecast | Geographic Relevance | Impact Timeline |
|---|---|---|---|
| Petro-derived raw-material price volatility | -0.6% | Global, acute in regions dependent on imported feedstocks | Short term (≤ 2 years) |
| VOC and hazardous-solvent regulations | -0.4% | North America, Europe, South Korea, Japan | Medium term (2-4 years) |
| PFAS-free reformulation disrupting fluoropolymer tapes | -0.3% | North America, Europe | Long term (≥ 4 years) |
| Source: Mordor Intelligence | |||
Petro-Derived Raw-Material Price Volatility
Between 2024 and 2025, acrylic acid spot prices fluctuated significantly, which in turn squeezed converter margins. Butadiene prices were influenced by supply constraints due to cracker maintenance. A 2025 report from Henkel highlighted that raw-material inflation contributed to increased costs. However, this was somewhat mitigated by a reduction in acrylic polymer loadings. The exit of smaller converters from commodity segments, due to feedstock volatility and without hedging, underscores the challenges in short-term expansion within the adhesive tapes market.
VOC and Hazardous-Solvent Regulations
California’s South Coast district lowered the VOC cap for pressure-sensitive adhesives, compelling a reformulation of toluene-based duct and masking tapes[1]. The EU added N-methyl-2-pyrrolidone to the REACH Candidate List, triggering a phase-out in coating lines. South Korea ordered VOC cuts at adhesive plants, prompting investments in thermal oxidizers or shifts to hot-melt lines. These mandates accelerate technology migration yet raise compliance costs, tightening near-term margins across the adhesive tapes market.
*Our forecasts treat driver/restraint impacts as directional, not additive. The impact forecasts reflect baseline growth, mix effects, and variable interactions.
Adhesive Tapes Market Segment Analysis
By Resin:
Rubber-Based Formulations Secure Fastest GrowthRubber-based chemistries are projected to compound at 4.29% between 2026 and 2031, the highest rate in the resin spectrum, even though acrylic maintained 41.12% adhesive tapes market share in 2025. For high-speed logistics, natural and styrene-butadiene rubbers are crucial, achieving instant tack even on dusty surfaces. On the other hand, silicone resins, though smaller in volume than acrylic and rubber-based systems, are favored in the medical field and for high-temperature applications, prioritizing clarity and biocompatibility over cost. There's also a rising interest in epoxy-based structural tapes, a niche known for providing high shear strength, making them ideal for aerospace applications and wind blades. While bio-based tall-oil and soy chemistries face a hurdle with cost premiums, pilot projects suggest a potential gradual market entry in the coming years.
Acrylic continues to own premium automotive and electronics slots thanks to UV stability and low outgassing, anchoring its large slice of the adhesive tapes market. Still, price-sensitive sectors lean toward rubber formulations that tolerate irregular cartons and dusty worksites. Silicone approvals for 30-day skin contact under ISO 10993-10 protocols widen medical use cases, while reactive polyurethane hot-melts bridge processing ease and structural strength in flexible packaging. Collectively, resin diversification supports steady value creation even as commodity pricing stays volatile.

By Technology:
Water-Based Lines Accelerate Under Regulatory TailwindsWater-based technology held 45.19% of the 2025 volume and is forecast to clock the fastest 4.51% CAGR, reflecting tightening VOC norms and brand sustainability pledges. Modern acrylic emulsions now match solvent grades on peel and shear at lower coat weights, enabling converters to shut down solvent ovens and cut energy use. Ultra-fast packaging lines favor hot-melt systems due to their instant bonding capabilities. When factoring in energy costs, these systems prove to be more economical than their water-based counterparts. Meanwhile, solvent-based technology continues to dominate the automotive and aerospace sectors. Here, the emphasis on drying speed and low-surface-energy adhesion outweighs any regulatory challenges.
Reactive platforms—UV-curable acrylics and moisture-cure polyurethanes—collect a small share yet command premium prices in electronics and medical devices. Hybrids that co-package water-based carriers with UV crosslinkers are emerging, promising one-part processing with structural final properties. As these camps converge, the total adhesive tapes market size attached to water-based and hot-melt lines will expand most rapidly across the forecast window.
By Product Type:
Heat-Sensitive Tapes Ride Electronics MiniaturizationPressure-sensitive formats contributed 61.12% of the 2025 volume, yet heat-sensitive tapes are poised for a 4.58% CAGR, the best among product types. Thermally activated bonding eliminates liquid adhesives in flexible circuit assembly and wafer processing, reducing contamination risk. Water-activated kraft tapes enjoy renewed traction in e-commerce because they integrate with paper recycling loops. Specialty constructions—conductive, magnetic, and optically clear—are small in tonnage but vital for high-value electronics and 5G infrastructure.
Nitto’s Revalpha heat-release line underscores how debond-on-demand designs shorten semiconductor tool time. Rogers Corporation’s 6 W/m-K silicone tape underpins 5G power amplifiers, evidencing functional integration over classical bonding. The adhesive tapes market size for such specialty categories is still modest, yet it climbs faster than commodity segments as miniaturization intensifies.
By End-Use Industry:
Healthcare Emerges as Fastest-Growing ConsumerPackaging consumed 63.26% of 2025 tonnage, driven by global parcel growth and automation intensity, but healthcare is set to outpace all categories at a 4.67% CAGR to 2031. Each continuous glucose monitor uses about 0.15 m² of medical-grade tape per 14-day sensor. Automotive uses pivot from emblem mounting to wire-harness bundling and battery-module bonding as electrification reshapes material bills. Electrical and electronics segments expand on 5G rollout and data-center construction, boosting demand for thermal-management and EMI-shielding tapes.
Consumer DIY and building-and-construction applications add steady, region-specific volume. In each vertical, commoditized carton-sealing tapes yield slim margins, while medical wearables and EV battery packs allow increased price realization, underscoring how end-use mix lifts average revenue in the adhesive tapes market.
Geography Analysis
APAC Adhesive Tapes Market
Asia-Pacific held 58.91% of global volume in 2025 and is projected to expand at a 5.15% CAGR, the fastest of any region. China, a significant player, saw major demand driven by the provinces of Guangdong, Jiangsu, and Zhejiang—home to major electronics clusters and auto hubs. Meanwhile, India's market witnessed robust growth, fueled by a strong vehicle output and a booming e-commerce sector, leading to a surge in carton-sealing tape usage[2].
East Asia and ASEAN Adhesive Tapes Market
Japan continues to spearhead the market for optical and semiconductor tapes, exporting premium rolls throughout East Asia. South Korea's demand, closely tied to the display fabs of Samsung and LG, remained significant for specialty tapes. ASEAN countries, notably Vietnam, Thailand, and Malaysia, experienced strong annual growth as foreign direct investment shifted assembly lines from China, solidifying the region's dominance in the adhesive tapes market.
The Americas and EMEA Adhesive Tapes Market
North America accounted for a notable share of global consumption in 2025, buoyed by the rise of electric vehicle production and a surge in parcel logistics, even as traditional packaging faced maturity. Europe adapted to recycling mandates, transitioning from PP-backed tapes to kraft paper alternatives in mono-material laminates. South America saw Brazil's robust automotive sector driving demand, albeit constrained by Argentina's currency challenges, limiting imports. The Middle East and Africa reaped benefits from mega projects in Saudi Arabia and the UAE, alongside South Africa's automotive output, maintaining a steady medium-term growth rate.
Regulatory Landscape
Adhesive tape formulations and coated constructions fall under chemical controls that increasingly target solvents, monomers, and substances of concern used in adhesive manufacturing. In the European Union, REACH (Regulation (EC) No 1907/2006) continues to drive restrictions and documentation, including the formaldehyde-related REACH update (Commission Regulation (EU) 2023/1464), which affects raw-material selection and emissions control on coating and converting lines. In the United States, TSCA risk-management activity and EPA actions such as new Significant New Use Rules (SNURs), with an effective date in July 2026, reinforce the need for continuous chemical inventory and use-condition tracking for adhesive ingredients.
Hazard communication and packaging rules also shape downstream labeling, transport, and compliance workflows for tapes and adhesive products, especially for converters serving regulated end uses. In Europe, Regulation (EU) 2025/2439 adjusted application dates tied to mandatory label formatting and packaging requirements, changing compliance timelines for manufacturers selling into the region. In the United Kingdom, the REACH (Amendment) Regulations 2026 entered into force on April 1, 2026, underscoring divergence between EU REACH and UK REACH that global tape suppliers must manage through product stewardship, labeling, and customer documentation.
Value Chain Analysis
The adhesive tapes value chain begins with upstream petrochemical and bio-based feedstocks, which are converted into monomers, tackifiers, elastomers, films, papers, foams, and release liners. These inputs are then compounded into adhesive systems and coated onto backings, before converting (slitting, die-cutting, spooling) into finished rolls and parts. The midstream is shaped by integrated producers and specialist coaters and converters that adjust coat weight, cure, and surface treatments for applications in packaging, automotive harnessing, electronics, and healthcare, with qualification gates such as ISO 9001/14001 and sector-specific approvals influencing supplier selection.
Distribution typically splits between direct OEM supply for automotive and electronics programs, regional converters for customized widths and short runs, and industrial and retail channels for commodity packaging and DIY tapes. Supply reliability and cost remain sensitive to feedstock and logistics disruptions, and 2026 risk signals around petroleum-linked intermediates have pushed companies toward multi-sourcing and higher upstream transparency. Large tape and adhesive players also emphasize end-to-end planning and data integration across regional manufacturing and customer service functions, aligning procurement, production scheduling, and service levels to reduce lead times and manage volatility.
Competitive Landscape
The adhesive tapes market remains fragmented. Strategic focus has moved from square-meter capacity to formulation science. Incumbents funnel research and development toward PFAS-free fluoropolymers and low-VOC water-based emulsions, while smaller players gain packaging share with short-run, pre-printed rolls that bypass distributors. Digital printing speeds on-demand branding, and sensor-embedded tapes introduce track-and-trace without separate RFID tags. Emerging startups pursue reversible adhesives that debond via heat or light, aligning with circular-economy goals in electronics remanufacturing. Competitive intensity is highest in commodity cartons, where Chinese plants run at low margins. ISO 9001 and 14001 compliance is now standard; UL 94, FDA 21 CFR 175.105, and IEC 60454 approvals act as entry gates in regulated sectors, consolidating premium pockets within the adhesive tapes market.
Adhesive Tapes Industry Leaders
-
3M
-
tesa SE – A Beiersdorf Company
-
Nitto Denko Corporation
-
Avery Dennison Corporation
-
LINTEC Corporation
- *Disclaimer: Major Players sorted in no particular order
Adhesive Tapes Market Companies Covered in this Report
- 3M
- Adchem Corporation
- Amcor
- Avery Dennison Corporation
- CCT (Coating and Converting Technologies, LLC)
- DuPont
- H.B. Fuller Company
- Henkel AG and Co. KGaA
- IPG
- LINTEC Corporation
- Lohmann
- Mativ
- Nitto Denko Corporation
- Oji Holdings Corporation
- Rogers Corporation
- Saint-Gobain
- Scapa Group Ltd
- Sekisui Chemical Co., Ltd.
- Shurtape Technologies, LLC
- Sika AG
- tesa SE – A Beiersdorf Company
Market Opportunities and Future Outlook
The clearest opportunity is in performance tapes that replace mechanical fastening or liquid adhesives, while meeting tighter process-control, recyclability, and low-emissions requirements. In Europe, packaging design-for-recycling initiatives and chemical controls under REACH continue to shift demand toward water-based, low-VOC systems and paper-compatible formats such as water-activated kraft tapes, creating room for converters that can deliver compliant constructions without compromising line speed. In high-value electronics, miniaturization and semiconductor process demands expand use of specialty tapes, including optically clear, heat-release, and clean-room grades, where qualification and consistency support defensible margins.
Manufacturing localization and capability upgrades offer a practical route to capture demand in fast-growing hubs and reduce lead times for customized specifications. tesa held a topping-out ceremony for a new 4,500-square-meter production building at its Offenburg, Germany, site in May 2026, pointing to additional European capacity and process modernization for advanced adhesive solutions. In Southeast Asia, UPM Adhesive Materials is bringing a new coating line online around mid-2026 at its Johor Bahru, Malaysia, factory to support regional label-material demand, while multiple Asia-based producers are upgrading coating, slitting, and laminating automation to raise output and consistency for industrial and electronics customers. These investments track the broader shift toward tighter tolerances, traceability, and application-specific tape designs across packaging automation, EV assembly processes, and electronics manufacturing.
Recent Industry Developments in Adhesive Tapes Market
- July 2026: 3M launched Scotch Kids Tape, extending its Scotch brand portfolio with a product designed for creative use cases. While consumer-facing, it supports channel breadth and retail shelf presence that can reinforce baseline volume in general-purpose tape categories.
- May 2026: LINTEC was reported to be planning a JPY 7 billion investment to begin mass production of carbon nanotube-based EUV lithography pellicles in 2026. This move highlights tape and film makers pushing deeper into semiconductor-adjacent specialty materials where qualification barriers and performance requirements differ from commodity adhesive tapes.
- November 2024: tesa opened new offices in Mumbai and Bengaluru to strengthen its footprint in India. The added local presence supports faster technical service and customer access in manufacturing clusters, aiding specification-driven sales in automotive, electronics, and industrial applications.
Adhesive Tapes Market Report Scope and Research Methodology
Market Definition and Coverage
For this study, the adhesive tapes market covers manufactured pressure-sensitive and specialty tapes sold in roll, sheet, die-cut, or label formats, where a backing and adhesive layer are used for bonding, masking, protection, electrical insulation, or packaging use.
Scope exclusions: We exclude liquid adhesives, sealants, and non-adhesive fastening products, and we also avoid double counting in-house tape consumption that is not sold into the market.
Segments Covered in This Report
- By Resin
- Acrylic
- Rubber-based
- Silicone
- Epoxy
- Polyurethane
- By Technology
- Water-based
- Solvent-based
- Hot-melt
- Reactive
- By Product Type
- Pressure-Sensitive Tapes
- Water-Activated Tapes
- Heat-Sensitive Tapes
- Specialty Tapes
- By End-use Industry
- Packaging
- Automotive
- Electrical and Electronics
- Healthcare
- Consumer/DIY
- Others (Building and Construction, etc.)
- By Geography
- Asia-Pacific
- China
- India
- Japan
- South Korea
- ASEAN Countries
- Rest of Asia-Pacific
- North America
- United States
- Canada
- Mexico
- Europe
- Germany
- United Kingdom
- France
- Italy
- Russia
- Rest of Europe
- South America
- Brazil
- Argentina
- Rest of South America
- Middle-East and Africa
- Saudi Arabia
- South Africa
- Rest of Middle-East and Africa
- Asia-Pacific
Data Sources, Market Sizing, and Validation
Desk Research
Desk work starts with building a clean demand map by end-use and by region, then linking it with trade and production indicators that can be checked each year. We typically refer to public sources such as UN Comtrade for HS-coded trade flows, US International Trade Commission and US Census data for import patterns, Eurostat for regional industrial output signals, and the World Bank for macro indicators used in normalization.
To keep definitions consistent, we also review standards and safety references (such as ASTM documentation summaries and OSHA guidance where relevant) and scan peer-reviewed materials science journals for shifts in tape backings and adhesive chemistries. Company annual reports, investor presentations, and press releases are used to confirm capacity additions, plant start-ups, and application focus. In parallel, we use paid subscriptions for company financials and intelligence, plus shipment-level import and export databases where available, to cross-check unusual country-level movements. These examples are not exhaustive, and many other public and paid sources were also used for data collection, validation, and clarification.
Primary Interviews and Surveys
Primary work focuses on validating what is actually being bought and used, then stress-testing the assumptions behind volume, pricing, and mix. We speak with tape converters, raw material suppliers, distributors, and procurement and engineering contacts from key end users across APAC, EMEA, and the Americas, so gaps from desk findings can be closed before finalizing the model.
Distribution of primary research fieldwork respondents
| Company type | Respondent position | Region |
|---|---|---|
| Top tier: 31% | CXOs: 20% | APAC: 49% |
| Mid tier: 47% | Functional/Unit leaders: 23% | EMEA: 29% |
| Smaller Players: 22% | Managers: 57% | Americas: 22% |
Market-Sizing & Forecasting
Sizing is built using a top-down approach where industrial output, packaging throughput, and manufacturing activity signals are translated into tape demand pools, then converted into market totals using usage rates and product mix. We corroborate these results with selective bottom-up approximations, such as sampled supplier and converter revenue splits, channel checks for high-run tape categories, and a simple volume times average selling price test for major end uses.
Key inputs that typically move the model include corrugated box shipments and e-commerce parcel volumes, automotive and electronics production indices, construction activity indicators, and the observed mix shift between commodity packaging tapes and higher value specialty formats. Pricing is handled through a blended ASP logic that reflects backing material changes, adhesive technology shifts (for example, solvent-free adoption), and regional currency timing, and then it is sanity-checked with trade unit values where they are meaningful. For forecasting, we use scenario analysis supported by a light multivariate regression view on the strongest demand drivers, and assumptions are adjusted when primary respondents flag a different ramp rate in a region or end-use. Where bottom-up evidence is incomplete, gaps are handled through conservative proxy ratios tied to nearby end uses and import dependency patterns, and then totals are re-checked for consistency.
Data Validation & Update Cycle
Validation is done in steps so large swings are caught early and explained clearly. Model outputs are compared with independent signals, such as trade direction, major end-use output trends, and announced capacity changes, and then outliers are reviewed to confirm whether they are real shifts or data noise.
Before sign-off, assumptions and calculations go through analyst reviews that check unit consistency, price logic, and country roll-ups, followed by re-contact triggers when a key input moves beyond a normal range. Reports are refreshed annually, and interim updates are made when material events occur that can change pricing, demand, or supply. Right before delivery, a final pass is completed so clients receive the most current view available.
Mordor Intelligence's Adhesive Tapes Market Estimate Compared With Other Published Estimates
Published market sizes for adhesive tapes do not always match because the scope can be set differently and the chosen sizing unit can change the entire output. Variations also come from how pricing is blended across commodity packaging tapes versus specialty formats, and from how often assumptions are refreshed when end-use demand shifts.
Some published figures focus on a value-only view that can bundle adjacent adhesive products and rely on broad average prices across applications. In Mordor Intelligence's model, the core tape market is sized and forecast in square meters (60.98 B in 2026), and value is not shown on the study page, which is why a straight USD comparison can look far apart even when demand direction is similar.
Benchmark comparison
| Source | Market Size | Gaps in Research Methodology |
|---|---|---|
| Mordor Intelligence | USD 60.98 B (2026) | |
| Global Consultancy A | USD 84.03 B (2025) | Uses a value-based definition and applies blended ASPs across diverse tape types and end uses, which can inflate totals when specialty pricing assumptions are extended to larger packaging volumes. |
| Industry Publisher B | USD 78.60 B (2025) | Reports USD value for a broad tape set by resin, backing, and technology, and the estimate is sensitive to what is counted as industrial versus medical and how regional currency conversion timing is handled. |
The table shows that the spread is mainly driven by unit choice and pricing treatment rather than disagreement on the direction of growth. When the scope is kept consistent and the inputs are tied back to observable production, trade, and end-use activity, the resulting market size becomes easier to explain and repeat in future updates.
Key Questions Answered in the Report
What is the projected volume for the adhesive tapes market in 2031?
The adhesive tapes market is forecast to reach 74.73 billion square meters by 2031 from 60.98 billion square meters in 2026, registering a CAGR of 4.15%.
Which region leads demand growth?
Asia-Pacific tops both share and growth, holding 58.91% of 2025 volume and expanding at a 5.15% CAGR.
Which product category is growing fastest?
Heat-sensitive tapes are the fastest, advancing at a 4.58% CAGR through 2031.
How are VOC rules shaping technology choices?
Tightened VOC limits are steering converters from solvent-based lines toward water-based and hot-melt systems.
Why is healthcare an attractive end use?
Wearable glucose monitors and drug-delivery patches need skin-friendly tapes, driving healthcare demand at a 4.67% CAGR.