
Active Implantable Medical Devices Market Size and Share
Market Overview
| Study Period | 2020 - 2031 |
|---|---|
| Market Size (2026) | USD 35.95 Billion |
| Market Size (2031) | USD 51.18 Billion |
| Growth Rate (2026 - 2031) | 7.32 % |
| Fastest Growing Market | Asia Pacific |
| Largest Market | North America |
| Market Concentration | Medium |
Major Players *Disclaimer: Major Players sorted in no particular order Image © Mordor Intelligence. Reuse requires attribution under CC BY 4.0. | |
Active Implantable Medical Devices Market Analysis by Mordor Intelligence
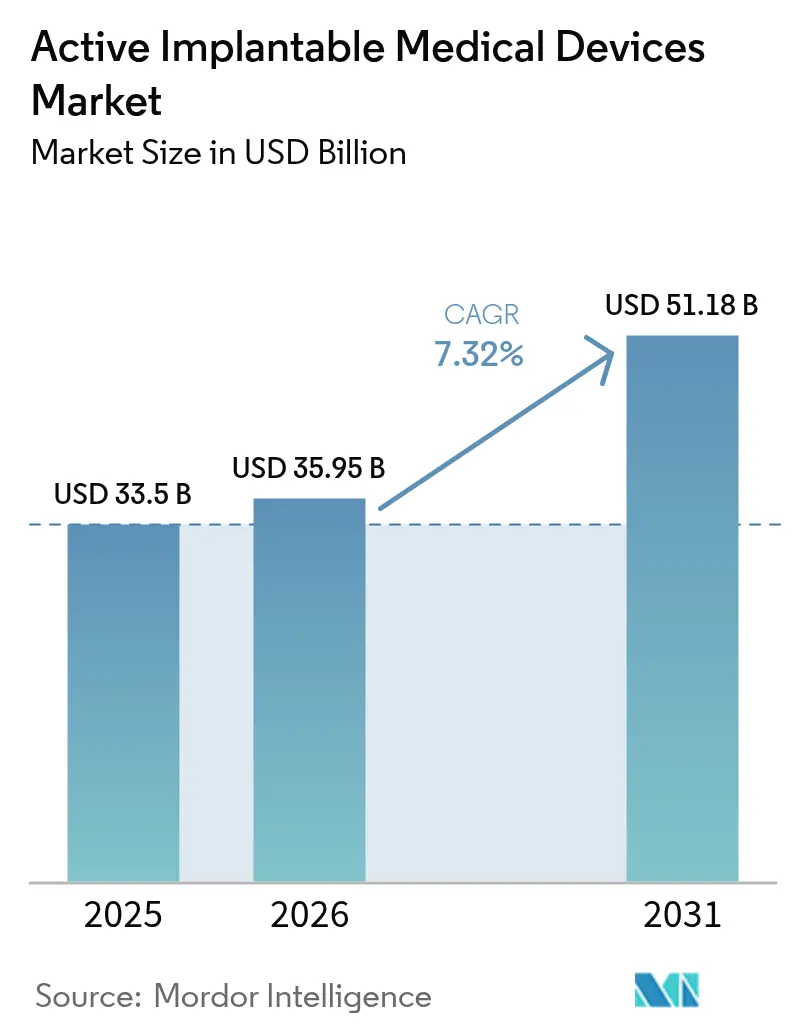
Active implantable medical devices market size in 2026 is estimated at USD 35.95 billion, growing from 2025 value of USD 33.50 billion with 2031 projections showing USD 51.18 billion, growing at 7.32% CAGR over 2026-2031. Rising life expectancy, rapid miniaturization of electronics, and expanding reimbursement frameworks are widening patient eligibility while shortening technology-adoption cycles. The uptake of AI-enabled remote monitoring has cut false cardiac alerts by up to 85%, easing clinician workload and increasing confidence in long-term device use. In parallel, the EU Medical Device Regulation (MDR) has extended transition deadlines to December 2027 for Class III implants, channeling demand toward manufacturers with strong quality systems[1]. Stabilization of the semiconductor supply chain after 2024 shortages is restoring production of sub-centimeter components essential for leadless and wireless architectures[2]. Together, these dynamics reinforce a steady scale-up trajectory for the Active implantable medical devices market through 2030.
Key Report Takeaways
- By product type, implantable cardioverter-defibrillators led with 30.85% of the Active implantable medical devices market share in 2025, while implantable hearing devices are forecast to post a 9.05% CAGR to 2031.
- By application, cardiovascular disorders accounted for 54.90% of the Active implantable medical devices market size in 2025, and hearing-loss therapies are projected to advance at a 10.15% CAGR through 2031.
- By end user, hospitals controlled 63.10% revenue in 2025, yet specialty and ENT clinics are expected to expand at a 9.92% CAGR during 2026-2031.
- By technology, MRI-compatible devices captured 40.10% of the Active implantable medical devices market size in 2025, whereas leadless and wireless systems should rise at a 9.18% CAGR to 2031.
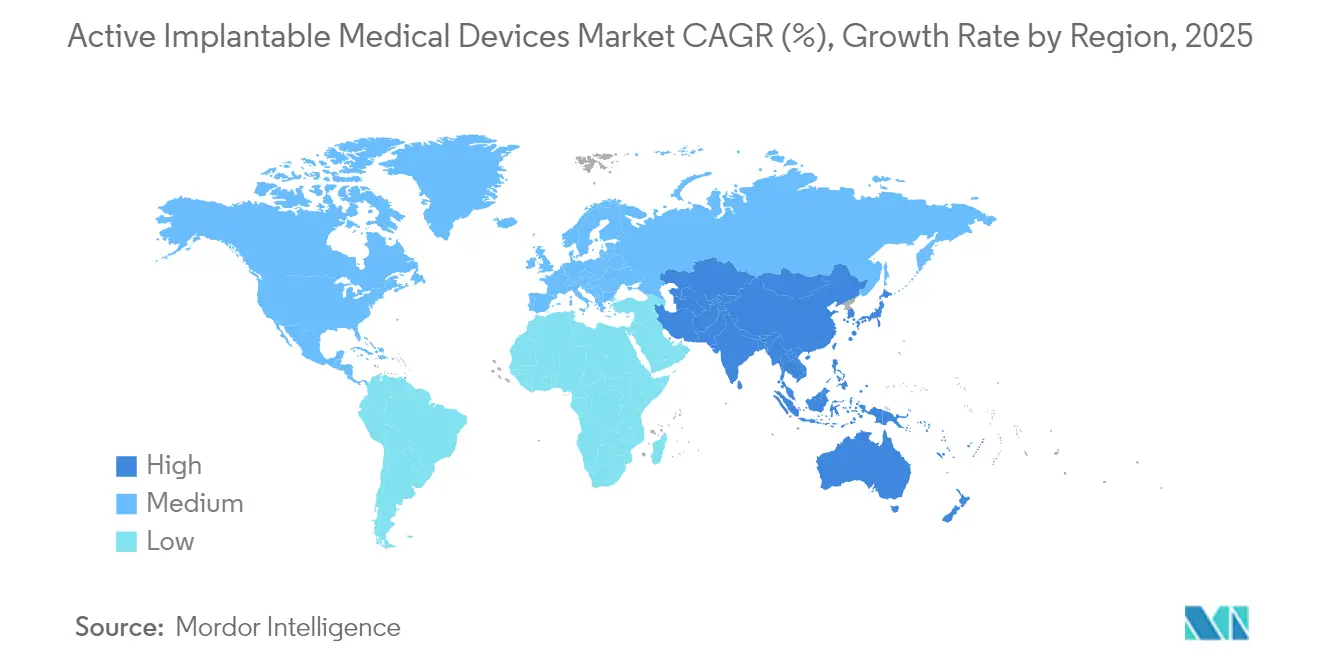
- By geography, North America dominated with 38.10% share in 2025, and Asia-Pacific is on track for an 8.32% CAGR, reflecting China’s volume-based procurement and Japan’s super-aged demographics.
Note: Market size and forecast figures in this report are generated using Mordor Intelligence’s proprietary estimation framework, updated with the latest available data and insights as of 2026.
Market Trends and Insights
Drivers Impact Analysis of Active Implantable Medical Devices Market*
| Driver | % Impact on CAGR Forecast | Geographic Relevance | Impact Timeline |
|---|---|---|---|
| Rising Prevalence Of Cardio-, Neuro- & Otologic Disorders | +1.8% | Global, concentrated in aging OECD markets | Long term (≥ 4 years) |
| Rapid Miniaturisation & MRI-Safe / Lead-Less Design Innovations | +1.5% | North America & EU leadership, accelerating APAC adoption | Medium term (2-4 years) |
| Ageing Population Expanding Implant-Eligible Pool | +1.2% | Japan, Germany, Italy, global ripple | Long term (≥ 4 years) |
| Favourable Reimbursement Expansion In OECD & China | +1.0% | OECD countries and China | Medium term (2-4 years) |
| AI-Enabled Remote Monitoring Algorithms Improving Real-World Outcomes | +0.9% | Early uptake in North America & EU, APAC following | Short term (≤ 2 years) |
| Breakthrough Bio-Resorbable Electronics Eliminating Explant Surgeries | +0.4% | Research hubs in US, EU, selected APAC centers | Long term (≥ 4 years) |
| Source: Mordor Intelligence | |||
Rising Prevalence of Cardio-, Neuro- & Otologic Disorders
Heart failure impacts more than 64 million people worldwide and atrial fibrillation is expected to reach 17.9 million cases in developed markets by 2030, intensifying demand for implantable cardioverter-defibrillators and resynchronization devices. Parkinson’s disease affects around 10 million patients globally, spurring adoption of adaptive deep-brain stimulation systems that modulate therapy in real time. WHO forecasts that hearing loss will affect 700 million people by 2050, a trend accelerating cochlear-implant usage as fully implantable designs erase cosmetic barriers. Co-morbid disease profiles are also becoming more common, prompting multi-device implantation and underpinning sustained growth in the Active implantable medical devices market.
Rapid Miniaturization & MRI-Safe Leadless Design Innovations
Leadless pacemakers have shrunk to volumes below 1 cm³ while retaining 10-year battery life, and devices like Abbott’s AVEIR dual-chamber system synchronize atrioventricular pacing without transvenous leads. MRI protocols have progressed from conditional to fully unrestricted scanning at 3 Tesla, removing long-standing imaging barriers for device patients. Precision Neuroscience’s Layer 7 cortical interface, hosting 1,024 hair-thin electrodes, exemplifies the fine-scale fabrication now achievable. Bio-resorbable pacemakers that dissolve after therapy completion have completed first-in-human feasibility trials, hinting at a future where explant surgery becomes unnecessary. These advances lower infection risks, simplify procedures, and widen patient selection, strengthening momentum in the Active implantable medical devices market.
Ageing Population Expanding Implant-Eligible Pool
By 2030 the global population aged 65 years and older will reach 771 million, putting Japan at 29% senior share and Europe not far behind[3]. Age-related arrythmias, neurodegenerative diseases, and sensory deficits collectively raise implant demand across cardiology, neurology, and otology specialties. Transcatheter techniques now allow minimally invasive ventricular assist device placement in frail patients who previously were not surgical candidates. Candidate criteria for cochlear implants have widened to include single-sided deafness and moderate hearing loss, boosting potential volume in an otherwise under-penetrated indication. Governments and insurers encourage such therapies to maintain older adults’ independence, cementing a demand floor for the Active implantable medical devices market.
Favourable Reimbursement Expansion in OECD & China
China’s volume-based procurement (VoBP) program has slashed cochlear-implant prices from 200,000 RMB to 50,000 RMB, quadrupling coverage eligibility under the National Medical Security Fund[4]. In the United States, the FDA Breakthrough Device pathway shortens review cycles for novel implants and triggers parallel Medicare coverage, exemplified by recent approvals in adaptive DBS and conduction system pacing. The EU MDR, despite early backlogs, ultimately standardizes evidence requirements and reduces multi-country duplication costs, benefitting large-scale launches across Europe. Value-based payer contracts reward devices that cut hospital readmissions, aligning fiscal incentives with technology that improves outcomes. Collectively these policy shifts underpin predictable reimbursement flows for the Active implantable medical devices market.
Restraints Impact Analysis of Active Implantable Medical Devices Market*
| Restraints Impact Analysis | (~) % Impact on CAGR Forecast | Geographic Relevance | Impact Timeline |
|---|---|---|---|
| High Device & Procedure Cost In Emerging Markets | −1.1% | Latin America, Southeast Asia, Sub-Saharan Africa | Medium term (2-4 years) |
| Stringent Cyber-Security / Regulatory Hurdles Lengthen Approvals | −0.8% | Global, notably EU & US | Short term (≤ 2 years) |
| Semiconductor Supply Bottlenecks For Ultra-Miniature Components | −0.6% | Global electronics value chain | Short term (≤ 2 years) |
| Battery-Material Sustainability Pressures On Lithium-Iodine Chemistry | −0.4% | Global, with emphasis on EU sustainability mandates | Long term (≥ 4 years) |
| Source: Mordor Intelligence | |||
High Device & Procedure Cost in Emerging Markets
In many low- and middle-income regions, implant prices still exceed annual household income, limiting penetration to wealthy urban populations. Only 19% of residents in these economies have access even to basic diagnostics, highlighting systemic care gaps. Currency depreciation further inflates import costs for devices priced in hard currencies, while fragmented insurance coverage pushes most payments out of pocket. Local manufacturing policies in India and Brazil offer tax incentives, yet high-risk implant categories require specialized cleanroom production and intellectual property portfolios that few domestic firms possess. Training deficits compound the barrier, as implant procedures demand electrophysiologists and otologic surgeons who remain concentrated in flagship hospitals. Until financing models mature, cost will continue to cap the Active implantable medical devices market in numerous emerging territories.
Stringent Cybersecurity & Regulatory Hurdles Lengthen Approvals
The 2025 US PATCH Act obliges companies to embed real-time threat monitoring and software patching into all network-connected implants, increasing design complexity and audit requirements. In Europe, only 43 notified bodies handle roughly half a million device dossiers, stretching certification timelines for Class III implants to 24 months. Software-as-a-medical-device rules now require stand-alone clinical trials for embedded AI algorithms, a financial load that smaller innovators struggle to absorb. Post-market surveillance mandates 100% complaint trending and annual performance updates, compelling firms to invest in dedicated vigilance teams. These layers consolidate share toward multinationals capable of absorbing compliance overhead, tempering new-entry velocity into the Active implantable medical devices market.
*Our forecasts treat driver/restraint impacts as directional, not additive. The impact forecasts reflect baseline growth, mix effects, and variable interactions.
Active Implantable Medical Devices Market Segment Analysis
By Product Type:
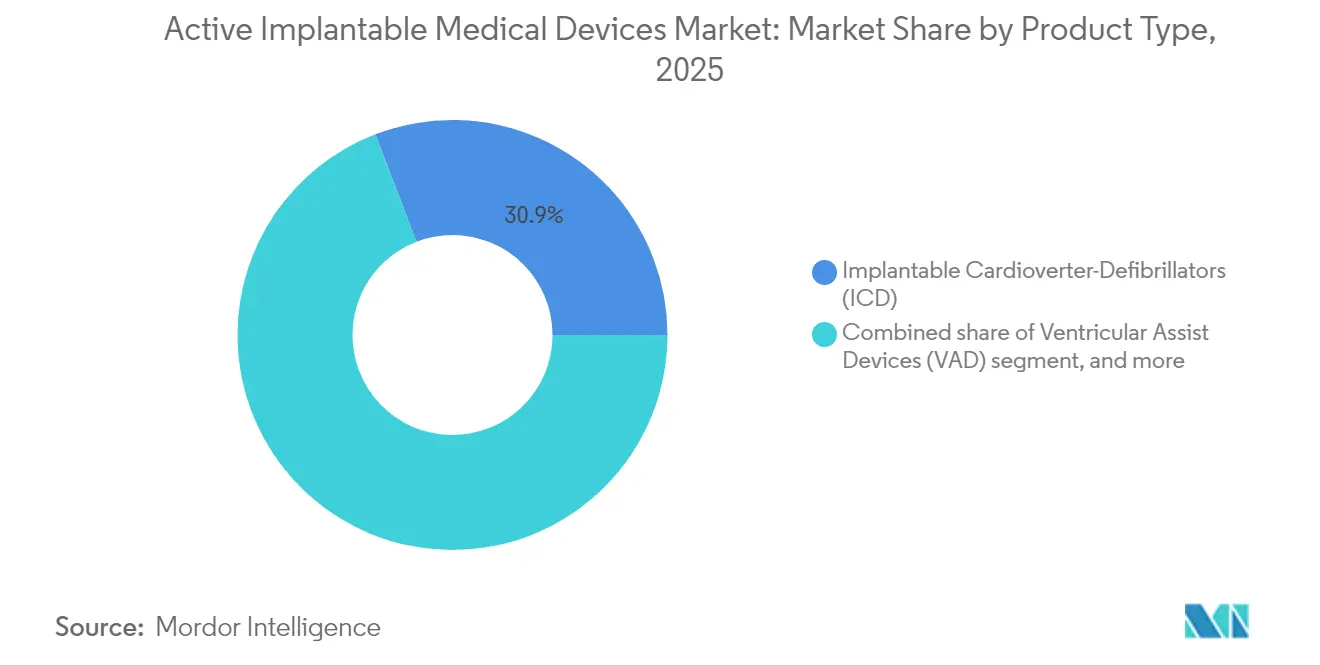
Defibrillators Maintain Lead, Hearing Devices AccelerateImplantable cardioverter-defibrillators captured a 30.85% slice of the Active implantable medical devices market size in 2025 thanks to their life-saving role in sudden-cardiac-death prevention among roughly 6 million US heart-failure patients. Subcutaneous and leadless formats reduce infection risk and enable MRI access, sustaining steady replacement cycles. Pacemakers stay relevant because dual-chamber leadless designs now correct complex arrhythmias without transvenous leads. Ventricular assist devices profit from magnetically levitated pumps that cut thrombosis, doubling two-year survival compared with previous generations.
Implantable hearing devices post the fastest trajectory at a 9.05% CAGR through 2031 as totally implantable cochlear implants enter pivotal trials and promise round-the-clock sound without external processors. Early data from MED-EL’s TICI feasibility study showed speech-recognition parity with standard models and higher patient satisfaction. Neurostimulators also benefit from closed-loop capabilities that cut overstimulation by 89%, while insertable loop recorders and drug-infusion pumps gain from personalized chronic-disease management. These dynamics collectively deepen product diversity and future-proof the Active implantable medical devices market.

By Application:
Cardiovascular Dominance Faces Hearing-Loss DisruptionCardiovascular disorders retained 54.90% of the Active implantable medical devices market size in 2025 driven by escalating heart-failure prevalence and broadening indications for conduction-system pacing and resynchronization. Abbott’s TriClip device reduced moderate-or-greater tricuspid regurgitation by 84% and improved Kansas City Cardiomyopathy Questionnaire scores, highlighting structural-heart opportunities. Neurological applications remain steady because adaptive deep-brain stimulation widens clinical benefit to previously refractory Parkinson’s subtypes.
Hearing-loss treatment is growing at a 10.15% CAGR to 2031 as WHO projects 700 million affected individuals, and fully implantable solutions erase long-standing stigma. Chronic pain management sees rising adoption of AI-driven spinal cord stimulators that auto-calibrate dosing, reducing opioid reliance. Endocrine use cases, such as closed-loop insulin delivery, represent an emerging adjacency that could inject fresh volume into the Active implantable medical devices market.
By End User:
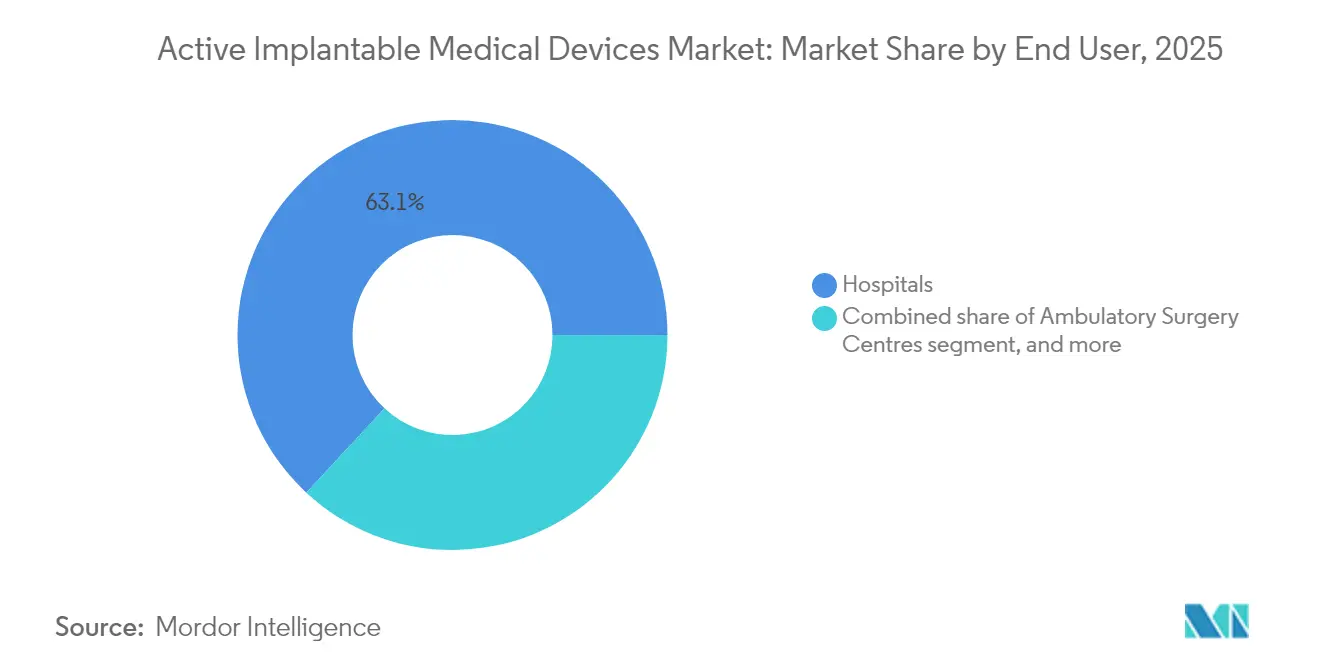
Hospitals Hold Scale, Specialty Centers OutpaceHospitals controlled 63.10% revenue in 2025 due to broad infrastructure, intensive-care support, and teaching affiliations that accommodate complex ventricular assist or dual-chamber leadless implants. Academic medical centers serve as early-adopter hubs, accelerating diffusion to community facilities once procedural learning curves flatten.
Specialty and ENT clinics are projected to rise at 9.92% CAGR as minimally invasive techniques permit same-day discharge for pacemaker and cochlear-implant placements. Ambulatory surgery centers now manage straightforward battery replacements and loop-recorder insertions safely under local anesthesia. The home-care frontier is opening through connected cardiac monitors and cloud analytics, creating decentralised follow-up pathways that shrink hospital footprints yet enlarge the Active implantable medical devices market.
By Technology:
MRI-Compatible Devices Dominate, Wireless Approaches SurgeMRI-compatible platforms commanded 40.10% share in 2025 because unrestricted imaging removes a critical treatment barrier for patients needing oncology or musculoskeletal scans. Abbott’s no-wait technology eliminated the traditional 6-week post-implant hold, enhancing patient throughput.
Leadless and wireless systems are forecast for a 9.18% CAGR, spurred by freedom from lead fractures that occur in 2-3% of conventional implants and require costly revisions. Abbott’s AVEIR dual-device communication proves multi-point pacing without physical leads, while rechargeable or bio-resorbable power sources promise to reduce future explants. Conventional devices persist in price-sensitive regions but face gradual substitution as economies of scale push premium-technology costs downward, broadening the worldwide Active implantable medical devices market.
Geography Analysis
North America Active Implantable Medical Devices Market
North America held 38.10% of 2025 sales, fueled by Medicare coverage of breakthrough devices and a dense ecosystem linking academia, industry, and venture capital. The FDA Breakthrough Device pathway has compressed cardiac and neuro device approvals to under 150 days on average, allowing rapid clinician adoption. Robust reimbursement and established referral networks support high procedural volumes for leadless pacing and adaptive DBS systems. Yet value-based payment initiatives are pressuring suppliers to evidence longitudinal cost offsets, ushering in risk-sharing contracts that could reshape the Active implantable medical devices market’s pricing structure.
APAC Active Implantable Medical Devices Market
Asia-Pacific is set to grow at 8.32% CAGR between 2026 and 2031 thanks to China’s VoBP cost resets and accelerated National Medical Products Administration approvals of 270 innovative implants since 2017. Japan’s super-aged society fuels demand for small, long-life devices, while South Korea’s advanced fabrication capacity positions it as a leading export hub. India’s Production Linked Incentive scheme is drawing global OEMs to set up local final assembly, trimming logistics costs and supporting broader regional access. These shifts elevate Asia-Pacific’s weighting in the Active implantable medical devices market and create scale efficiencies for global suppliers.
Europe Active Implantable Medical Devices Market
Europe is navigating MDR transition bottlenecks that delay certification yet ultimately harmonize evidence standards. Germany remains a powerhouse in electrophysiology, and France’s digital-health reimbursement framework incentivizes AI-linked implants. Brexit adds a parallel UK approval pathway, raising planning complexity for dual-region launches. Nonetheless, the continent’s ageing demographic and universal coverage still assure steady device demand. Once notified-body capacity normalises, pent-up approvals could yield a release of new products and reinforce Europe’s place within the Active implantable medical devices market.
Regulatory Landscape
In the United States, active implantable medical devices are regulated by the FDA under the medical device framework, with heightened attention on quality-system controls and software governance for connected implants. The FDA Quality Management System Regulation (QMSR) became effective in February 2026, bringing quality requirements more closely in line with international quality-management principles, and requiring manufacturers to update procedures for design controls, supplier management, and lifecycle documentation for implantable platforms.
In Europe, the EU Medical Device Regulation (MDR, Regulation (EU) 2017/745) continues to shape market access for Class III and implantable devices through notified-body capacity and evolving implementing acts. In March 2026, the European Commission adopted Delegated Regulation (EU) 2026/1451, updating lists of implantable and Class III devices exempted from mandatory clinical investigations for certain established technologies, and Delegated Regulation (EU) 2026/1359, updating the list of Class IIb implantable devices exempted from assessment of technical documentation for every device. Transitional timelines also tightened, with the May 2026 deadline lapse for Class III custom-made implantable devices to be placed on the market without a full conformity certificate, increasing the need for earlier conformity-assessment engagement.
Competitive Landscape
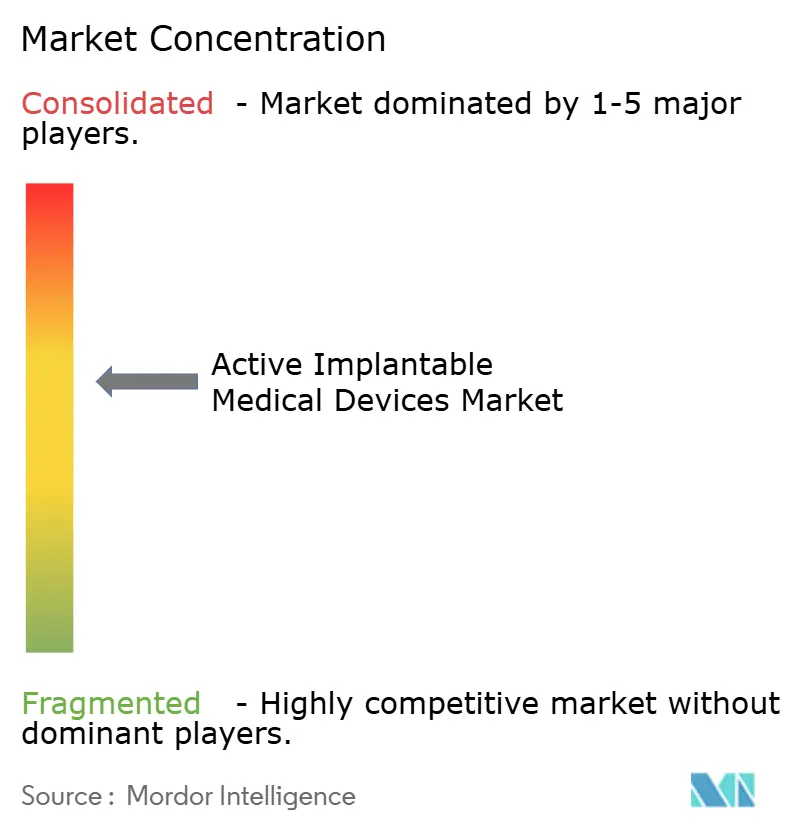
The active implantable medical devices market is moderately concentrated, with Medtronic, Abbott, and Boston Scientific collectively approaching 55% global revenue. These multinationals deploy USD 2 billion-plus annual R&D budgets and operate vertically integrated manufacturing that secures microelectronic supply. AI-augmented therapy is a core differentiator: Medtronic’s BrainSense adaptive DBS is the first closed-loop Parkinson’s implant to adjust stimulation based on sensed neural activity, improving symptom control without manual reprogramming.
Strategic acquisitions are reshaping portfolios. Stryker’s USD 4.9 billion bid for Inari Medical extends its implant reach into mechanical thrombectomy and peripheral intervention. Globus Medical’s USD 250 million purchase of Nevro brings high-frequency neuromodulation assets into its spine franchise. Boston Scientific’s buyout of Silk Road Medical strengthens its presence in transcarotid access for stroke prevention, enhancing cross-selling depth.
Emerging firms are pushing new frontiers such as fully implantable cochlear devices, bio-resorbable scaffolds, and wireless brain-computer interfaces. However, tightening cybersecurity, MDR compliance, and capital intensity raise entry barriers, giving incumbents time to integrate these approaches before disruptive scale is achieved. The convergence of software, power-management, and biocompatible materials will likely dictate competitive reshuffling within the Active implantable medical devices market over the coming decade.
Active Implantable Medical Devices Industry Leaders
-
Medtronic plc
-
Abbott Laboratories
-
Boston Scientific Corporation
-
Cochlear Limited
-
BIOTRONIK SE & Co. KG
- *Disclaimer: Major Players sorted in no particular order
Active Implantable Medical Devices Market Companies Covered in this Report
- Medtronic
- Abbott Laboratories
- Boston Scientific
- Cochlear
- BIOTRONIK
- LivaNova
- Nevro
- Axonics Inc.
- Inspire Medical Systems
- Sonova (Advanced Bionics)
- MED-EL
- MicroPort CRM
- Terumo
- Abiomed
- Jarvik Heart
- Biotronik Neuro
- BlueWind Medical
- CVRx Inc.
- Mindray
- Lepu Medical
Read Analysis of Active Implantable Medical Devices Companies
Market Opportunities and Future Outlook
Physiology-driven cardiac rhythm management is a near-term whitespace where product and procedural changes are showing up in 2026 approvals. In March 2026, the FDA approval for an expanded indication of Medtronic's OmniaSecure defibrillation lead for placement in the left bundle branch area underlined clinical momentum behind conduction system pacing, and the need for implant systems that support precise placement, durable lead performance, and compatible software workflows across electrophysiology labs. At the same time, BIOTRONIK's 2026 FDA approvals for Acticor Sky and Rivacor Sky ICD and CRT-D systems reinforced competitive activity in next-generation defibrillation and resynchronization platforms, keeping pressure on replacement cycles tied to MRI-conditionality, remote monitoring, and therapy optimization.
Beyond established cardiac and neuro indications, new implant modalities under pivotal evaluation create additional adjacency opportunities for manufacturers and service providers. In July 2026, VisCardia initiated the pivotal RECOVER-HF trial for the VisOne synchronized diaphragmatic stimulation system, extending the active-implant concept into cardiopulmonary support pathways that can shift new referral patterns and implant-center capabilities. Work on implant power and miniaturized bioelectronics, including multimodal energy harvesting approaches, supports the next wave of longer-life, smaller-form-factor devices, while cybersecurity and quality requirements (including the QMSR in the United States and MDR obligations in Europe) raise demand for scalable compliant software-update, vigilance, and post-market data infrastructure.
Recent Industry Developments in Active Implantable Medical Devices Market
- May 2026: Abbott informed clinicians of a potential software malfunction that could occur during in-person Pacing Capture Threshold (PCT) tests for AVEIR leadless pacemakers. The notice emphasized validated programming workflows and software maintenance for leadless systems, where follow-up and interrogation are central to ongoing therapy management.
- April 2026: The Heart Rhythm Society communicated a device-device interaction observed between Medtronic Sphere-9 ablation catheters and BIOTRONIK ICD/CRT-D systems during RF energy delivery. The interaction highlighted cross-vendor interoperability risks in electrophysiology procedures and increased emphasis on procedure protocols that account for implanted device behavior during ablation.
- March 2026: Boston Scientific issued an updated medical device correction for the ACCOLADE family pacemakers and CRT-Ps, introducing Brady software maintenance release 6 (SMR6) to mitigate risks related to high battery impedance-induced safety mode behavior and ZIP telemetry disablement. The update underscored how software remediation and post-market surveillance actions can affect device uptime, clinic workload, and replacement decisions.
Active Implantable Medical Devices Market Report Scope and Research Methodology
Market Definition and Coverage
This market covers revenues from active implantable medical devices that are placed wholly or partly inside a patient for 30 days or more, and that use an internal power source to deliver therapy or monitoring. Sizing is tracked at the manufacturer selling price level for original implants and replacement units.
Scope exclusions: Excludes passive orthopedic, dental, and contraceptive implants, and also excludes all external or wearable stimulators.
Segments Covered in This Report
- By Product Type
- Pacemakers
- Implantable Cardioverter-Defibrillators (ICD)
- Ventricular Assist Devices (VAD)
- Neurostimulators
- Spinal Cord Stimulators
- Deep Brain Stimulators
- Vagus Nerve Stimulators
- Sacral Nerve Stimulators
- Implantable Hearing Devices
- Cochlear Implants
- Bone-Anchored Hearing Systems
- Insertable Loop Recorders
- Implantable Drug-Infusion Pumps
- By Application
- Cardiovascular Disorders
- Neurological Disorders
- Hearing Loss
- Chronic Pain Management
- Endocrine & Metabolic (e.g., Diabetes)
- By End User
- Hospitals
- Ambulatory Surgery Centres
- Specialty & ENT Clinics
- Home-Care Settings
- By Technology
- MRI-Compatible Devices
- Conventional Devices
- Leadless / Wireless Implants
- Rechargeable / Bio-resorbable Power Systems
- Geography
- North America
- United States
- Canada
- Mexico
- Europe
- Germany
- United Kingdom
- France
- Italy
- Spain
- Rest of Europe
- Asia-Pacific
- China
- Japan
- India
- Australia
- South Korea
- Rest of Asia-Pacific
- Middle East & Africa
- GCC
- South Africa
- Rest of Middle East & Africa
- South America
- Brazil
- Argentina
- Rest of South America
- North America
Data Sources, Market Sizing, and Validation
Desk Research
Desk research helps build the base structure of the market and align terminology across countries and clinical settings. We rely on public health and device references such as the US FDA device databases and related safety communications, alongside CDC and OECD health statistics, to understand procedure volumes, disease burden, and care-access trends. For international comparability, we also review sources such as the World Health Organization and World Bank indicators to normalize population and health-spend context.
Once the data backbone is in place, we add inputs from company annual reports, investor presentations, and public announcements to map product mix and replacement cycles. Where available, we also use paid subscriptions for company financials and intelligence, patent databases, and shipment-level import and export records to cross-check manufacturing footprint and trade flows. The desk sources listed here are illustrative, and we used many other public references to collect and validate data points through the study.
Primary Interviews and Surveys
Primary interviews and surveys are used to pressure test the desk assumptions and close gaps where public sources do not give clear answers, especially around pricing bands, replacement rates, and demand shifts by care setting. We spoke with a mix of device manufacturers, distributors, clinicians, and procurement stakeholders across major regions, so the model reflects how adoption is happening in practice rather than only reported procedure counts.
Distribution of primary research fieldwork respondents
| Company type | Respondent position | Region |
|---|---|---|
| Top tier: 26% | CXOs: 15% | APAC: 44% |
| Mid tier: 58% | Functional/Unit leaders: 34% | EMEA: 31% |
| Smaller Players: 16% | Managers: 51% | Americas: 25% |
Market-Sizing & Forecasting
We start with a top-down build where procedure volumes, treated patient pools, and implant penetration rates are used to reconstruct demand for key active implants by major country groupings, then values are translated using typical selling prices. To keep the totals grounded, we corroborate with selective bottom-up checks, such as supplier revenue rollups from public filings, channel conversations on unit flow, and sampled price-times-volume sanity checks in high-volume device classes.
A few practical model inputs in this market include pacemaker and ICD implant rates, neurostimulation therapy adoption, cochlear implant candidacy and uptake, replacement timing for battery-driven devices, and country-level reimbursement and tender behavior that can shift mix within a year. For forecasting, we use scenario analysis so changes in procedure recovery, reimbursement updates, and technology refresh cycles can be represented without forcing a single straight-line trend. When bottom-up data is not complete for smaller countries, we apply share-based extrapolations from comparable healthcare systems and then re-check results against per-capita procedure indicators.
Data Validation & Update Cycle
Validation is done through triangulation across independent signals, followed by step-by-step variance checks at country and regional levels. If a modeled output moves too far from known anchors, such as procedure trends, public revenue disclosures, or trade flow direction, we revisit the underlying assumptions and re-engage relevant primary contacts for clarification.
Before sign-off, the work is reviewed by another analyst to confirm definitions, arithmetic, and year alignment, then a final consistency check is completed across segments and geographies. Reports are refreshed annually, and interim updates are completed when material events occur, including major regulatory actions, reimbursement shifts, or sharp procedure disruptions. Right before delivery, we run a final pass so clients receive the most current view available at that time.
Mordor Intelligence's Active Implantable Medical Devices Market Size Compared With Other Published Estimates
Published market sizes for active implantable medical devices rarely match perfectly because firms do not always count the same device universe, pricing layer, and country coverage in the same way. Differences also come from how replacement units are treated, whether values are reported at manufacturer selling price or at downstream selling price, and how quickly assumptions are refreshed when procedure patterns change.
Passive orthopedic and dental implants sit outside Mordor Intelligence's scope, which can pull the total away from studies that use a broader implant definition, even when the growth rate looks similar. The spread can also widen when one estimate leans on aggressive pricing progression, or when another uses limited country coverage and scales up with a simple multiplier rather than procedure-based demand checks.
Benchmark comparison
| Source | Market Size | Gaps in Research Methodology |
|---|---|---|
| Mordor Intelligence | USD 35.95 B (2026) | |
| Clinical Insights Publisher A | USD 26.86 B (2024) | Uses an earlier base year and a different forecast window, and the scope presentation is less clear on whether values reflect manufacturer selling price versus downstream pricing in all regions. |
| Global Publisher B | USD 30.17 B (2024) | Often groups device types at a high level and may apply broad growth assumptions across regions, which can understate replacement-cycle effects and country-level reimbursement differences. |
Overall, the gap across published numbers is mainly explained by what gets counted as an active implant, the year used for the starting point, and whether pricing is measured at the factory gate or later in the channel. By keeping the model tied to procedure-linked demand signals and cross-checking with revenue and trade indicators, the resulting market size stays traceable to simple inputs that can be re-tested as conditions change.
Key Questions Answered in the Report
What is the current size of the active implantable medical devices market?
The active implantable medical devices market generated USD 35.95 billion in 2026 and is forecast to reach USD 51.18 billion by 2031.
Which product segment holds the largest share of the market?
Implantable cardioverter-defibrillators led with 30.85% of the active implantable medical devices market share in 2025.
Which region is growing the fastest for active implantable medical devices?
Asia-Pacific is projected to expand at an 8.32% CAGR between 2026 and 2031, driven by China’s volume-based procurement and Japan’s aging population.
How are AI-enabled features influencing the market?
AI-driven remote monitoring has reduced false cardiac alerts by up to 85% and is spurring broader adoption of next-generation implants across cardiology and neurology.
What technological trend is most disrupting traditional implant designs?
Leadless and wireless implants, which eliminate transvenous leads and related complications, are advancing at a 9.18% CAGR and reshaping device selection criteria.
Why do specialty and ENT clinics show rapid growth in device implantation?
Minimally invasive techniques now allow same-day discharge for many procedures, letting specialty clinics perform high-volume implantations efficiently and fueling a 9.92% CAGR in this setting.