
Active And Passive Electronic Components Market Size and Share
Market Overview
| Study Period | 2020 - 2031 |
|---|---|
| Market Size (2026) | USD 0.82 Trillion |
| Market Size (2031) | USD 1.19 Trillion |
| Growth Rate (2026 - 2031) | 7.73% CAGR |
| Fastest Growing Market | Asia-Pacific |
| Largest Market | Asia-Pacific |
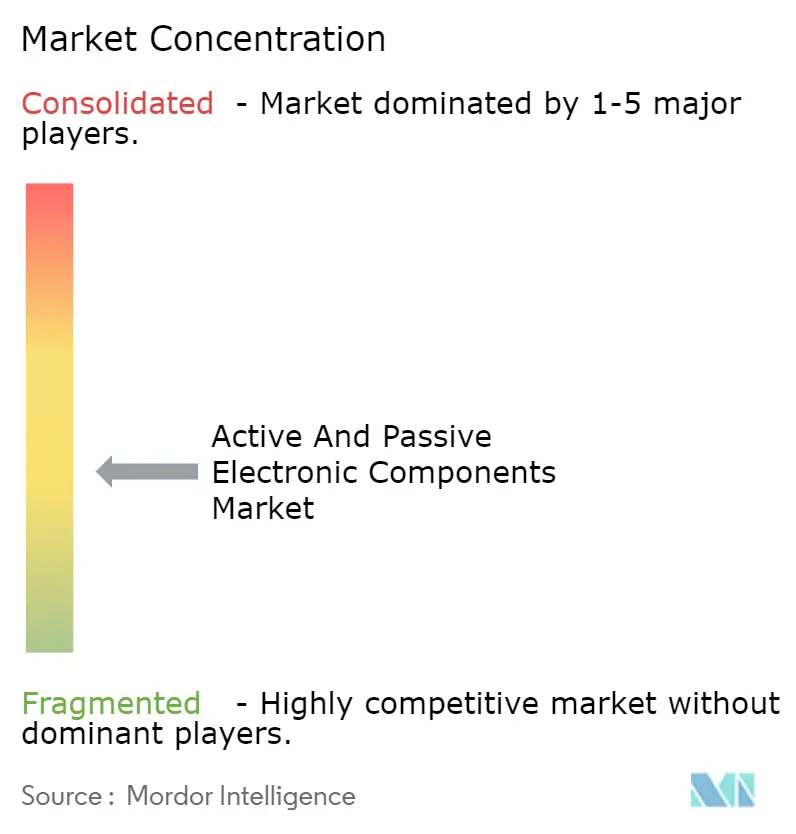
| Market Concentration | Medium |
Major Players *Disclaimer: Major Players sorted in no particular order Image © Mordor Intelligence. Reuse requires attribution under CC BY 4.0. | |
Active And Passive Electronic Components Market Analysis by Mordor Intelligence
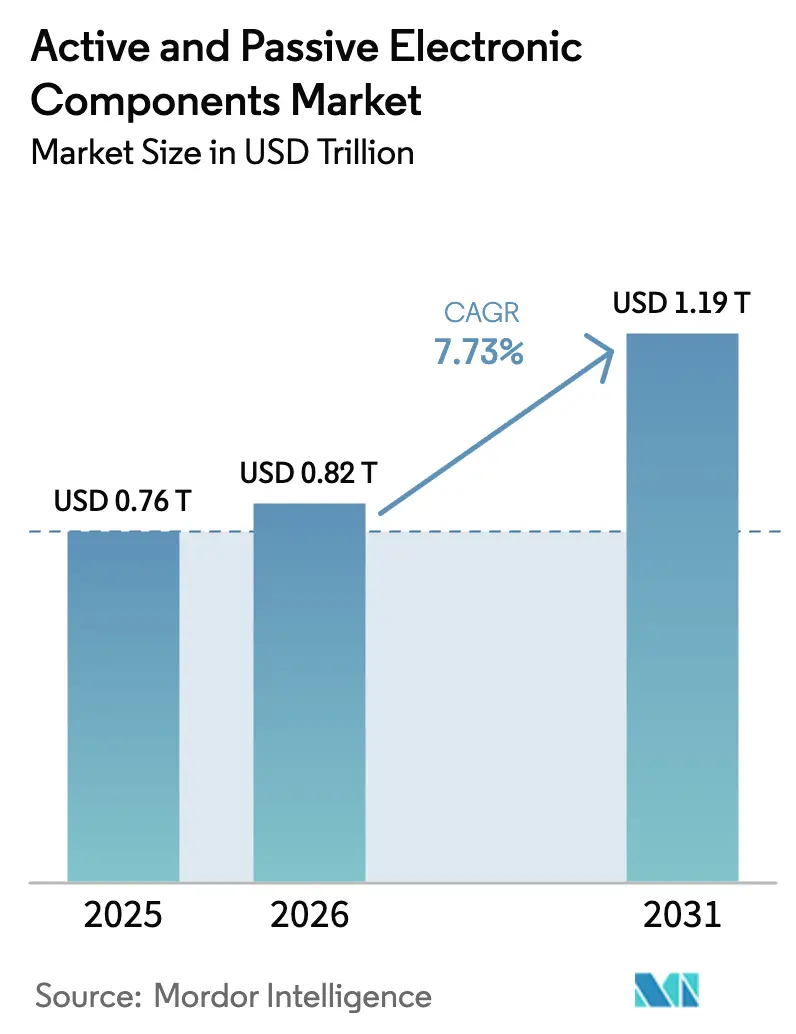
The Active And Passive Electronic Components Market size is projected to be USD 0.76 trillion in 2025, USD 0.82 trillion in 2026, and reach USD 1.19 trillion by 2031, growing at a CAGR of 7.73% from 2026 to 2031.
Energy-transition spending on battery-electric vehicles, surging AI server power density, and the densification of 5G radio units are creating secular demand that decouples the cycle from traditional smartphone refresh rates. Surface-mount automation is stabilizing labour costs for contract manufacturers, but heterogeneous 3D packaging is gaining share as chiplet ecosystems mature. Vertical integration by integrated-device manufacturers is concentrating multi-layer ceramic capacitor supply, while government incentives are tilting new wafer-fab investment toward North America, Europe, and India. Materials substitution is accelerating, with wide-bandgap substrates commanding premiums as automotive original equipment manufacturers (OEMs) and wireless-equipment vendors chase higher efficiency targets.
Key Report Takeaways
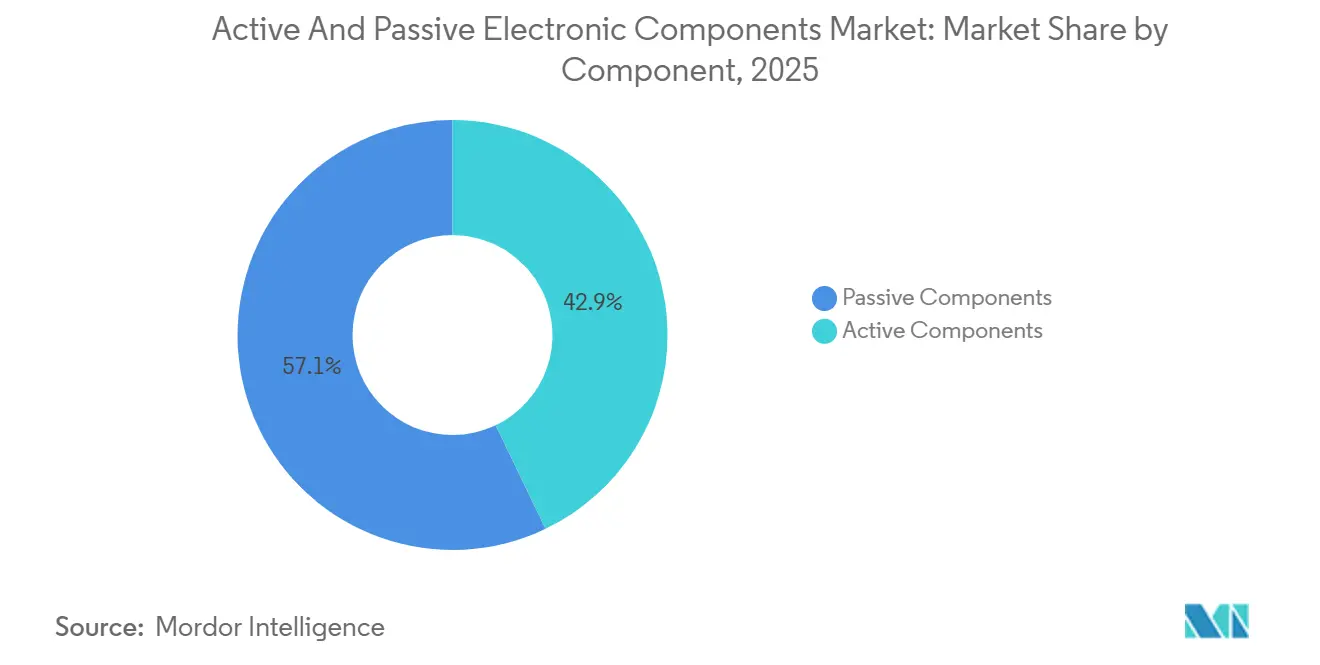
- By component, passive devices retained 57.12% of the active and passive electronic components market share in 2025, whereas active devices are forecast to expand at an 8.24% CAGR through 2031.
- By mounting technology, surface-mount solutions commanded 63.06% of revenue in 2025, while 3D integrated packaging is projected to grow at an 8.88% CAGR to 2031.
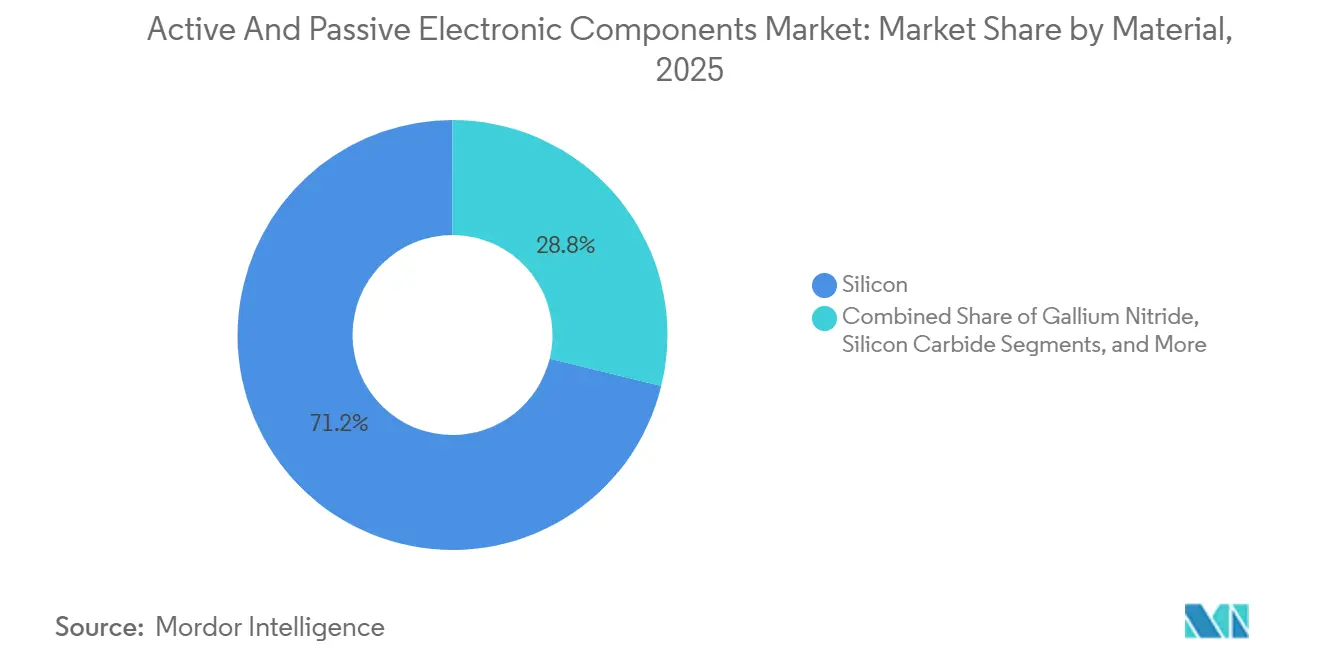
- By material, silicon captured 71.18% share in 2025, yet gallium nitride is expected to post an 8.51% CAGR between 2026 and 2031.
- By end-user industry, consumer electronics and computing accounted for 38.23% of demand in 2025, while automotive applications are set to register the fastest 8.94% CAGR through 2031.
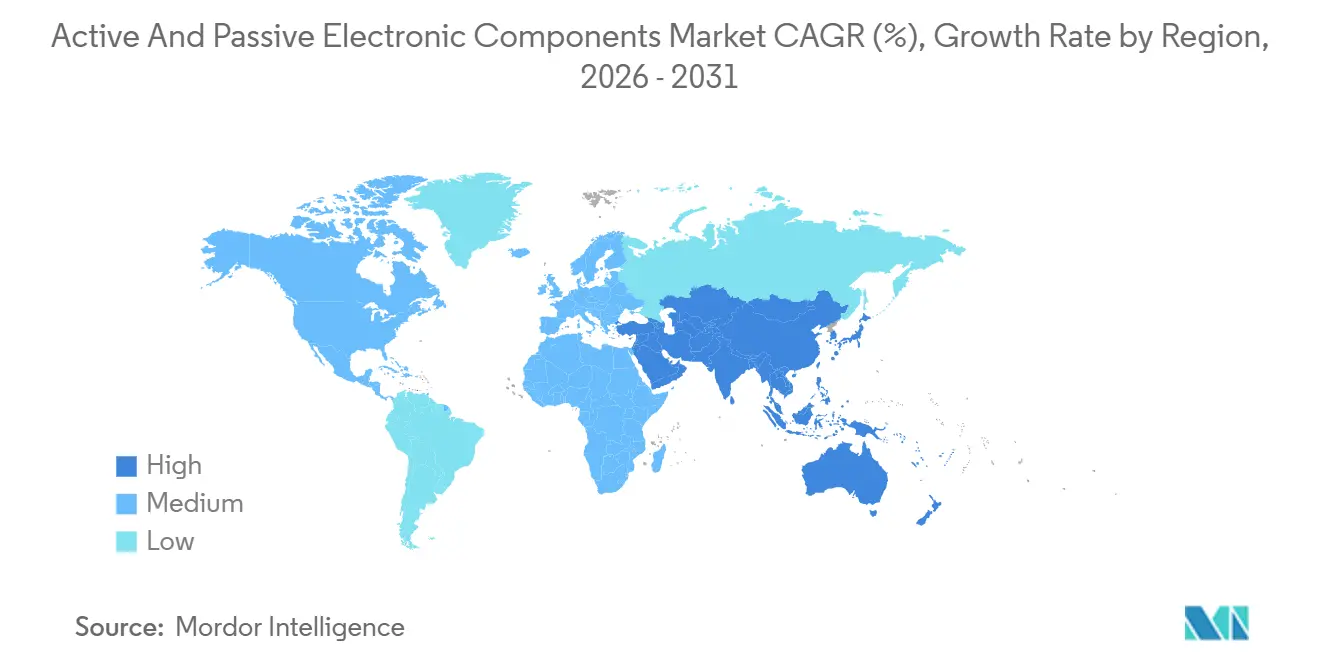
- By geography, Asia Pacific led with a 46.14% share in 2025, whereas the Middle East is forecast to record the fastest CAGR of 8.35% during 2026-2031.
Note: Market size and forecast figures in this report are generated using Mordor Intelligence’s proprietary estimation framework, updated with the latest available data and insights as of January 2026.
Global Active And Passive Electronic Components Market Trends and Insights
Drivers Impact Analysis*
| Driver | (~) % Impact on CAGR Forecast | Geographic Relevance | Impact Timeline |
|---|---|---|---|
| Accelerated Adoption of 5G Infrastructure | +1.20% | Global, with early density in China, South Korea, United States urban corridors | Medium term (2-4 years) |
| Shrinking Form-Factor Requirements in Wearables and IoT Devices | +0.80% | Global, led by Asia Pacific consumer-electronics hubs and North America wearables brands | Short term (≤ 2 years) |
| Surge in Automotive Electronics (EVs, ADAS) | +1.50% | North America, Europe, China; spillover to India and Southeast Asia | Long term (≥ 4 years) |
| Rapid Expansion of Data Centers and Cloud Workloads | +1.30% | North America, Europe, Asia Pacific hyperscale clusters | Medium term (2-4 years) |
| Government Incentives for On-Shore Semiconductor Manufacturing | +1.00% | United States, European Union, India, Japan | Long term (≥ 4 years) |
| Emerging Demand for Quantum-Ready Cryogenic Components | +0.30% | North America, Europe research corridors | Long term (≥ 4 years) |
| Source: Mordor Intelligence | |||
Accelerated Adoption of 5G Infrastructure
Radio-frequency front-end modules for 5G macro cells increasingly rely on gallium-nitride power amplifiers above 3.5 GHz where silicon lateral transistors lose more than 20% efficiency. China deployed 3.68 million 5G base stations by 2024 and targets 4.5 million by 2027, sustaining demand for GaN-on-SiC discrete transistors and monolithic microwave integrated circuits. Millimeter-wave spectrum auctions in the United States and Europe opened 24-29 GHz bands and quadrupled antenna-array element counts, inflating passive-component content per radio unit. Ericsson reported an 18% year-over-year increase in radio-unit bill-of-materials costs because of GaN die tightness and organic-substrate shortages.[1]Ericsson AB, “Ericsson Mobility Report 2025,” ericsson.com Open-RAN architectures fragment procurement, raising interface-component demand and interoperability risk. To compress lead times, telecom equipment manufacturers colocate GaN epitaxy and module assembly, mirroring the supply-chain strategies adopted in automotive power electronics.
Surge in Automotive Electronics (EVs, ADAS)
Battery-electric vehicles reached 17% of global light-vehicle sales in 2025, and each platform embeds USD 2,000-USD 3,000 worth of semiconductors versus USD 600 in internal-combustion vehicles, according to the Semiconductor Industry Association.[2]Semiconductor Industry Association, “Global Semiconductor Sales Increase 16% Year-to-Year in November,” semiconductors.org Silicon-carbide MOSFETs support 800-V battery packs that cut charging time from 45 minutes to 18 minutes, elevating OEM demand for wide-bandgap substrates. Infineon Technologies posted 23% automotive-segment growth in fiscal 2025 but cited 150-mm wafer bottlenecks that capped shipments. Advanced driver-assistance systems generate 4 TB of data daily, necessitating high-throughput domain controllers and ceramic capacitors rated from −40 °C to 150 °C. European regulations mandating automated emergency braking from 2024 embed a baseline ADAS content per vehicle, anchoring multi-year supply agreements.
Rapid Expansion of Data Centers and Cloud Workloads
Hyperscale facilities consumed 460 TWh in 2024, and AI training clusters are pushing rack power density toward 120 kW, which in turn drives adoption of liquid-cooling hardware and corrosion-resistant passives. Graphics-processing-unit clusters integrate 25,000-35,000 GPUs, each drawing 700 W, demanding voltage-regulator modules with up to 24 power stages. TSMC confirmed that high-performance computing revenue surpassed smartphone processors for the first time in 2025 as cloud service providers ordered custom AI accelerators on 3-nm nodes.[3]Taiwan Semiconductor Manufacturing Company, “Investor Conference Presentation 2025,” tsmc.com Chiplet-based processors, typified by AMD’s EPYC and Intel’s Sapphire Rapids, necessitate ultra-low-inductance capacitors within 500 µm of die bumps, increasing passive-component value per server blade.
Government Incentives for On-Shore Semiconductor Manufacturing
The United States CHIPS and Science Act earmarked USD 52.7 billion in subsidies, with USD 8.5 billion committed to Intel and USD 6.6 billion to the TSMC Arizona project. The European Union’s Chips Act mobilized EUR 43 billion (USD 47 billion) to double Europe’s manufacturing share by 2030. India approved USD 15 billion for fabrication and test incentives, with Micron breaking ground on a USD 2.75 billion assembly plant in 2024. These programs diversify geographic risk but face 24-36-month tool lead times, limiting near-term wafer output.
Restraints Impact Analysis*
| Restraint | (~) % Impact on CAGR Forecast | Geographic Relevance | Impact Timeline |
|---|---|---|---|
| Persistent Supply Chain Volatility of Rare-Earth Metals | -0.90% | Global, acute in regions dependent on Chinese refined gallium, germanium, and rare-earth oxides | Medium term (2-4 years) |
| Rising IP-Related Litigation and Licensing Costs | -0.60% | Global, concentrated in North America and Europe jurisdictions | Short term (≤ 2 years) |
| Environmental Compliance Costs for Lead-Free Soldering | -0.40% | Europe, North America; spillover to Asia Pacific export-oriented manufacturers | Long term (≥ 4 years) |
| Skills Gap in Advanced Packaging Technologies | -0.50% | Global, most acute in United States, Europe, and emerging Asian fabrication hubs | Long term (≥ 4 years) |
| Source: Mordor Intelligence | |||
Persistent Supply Chain Volatility of Rare-Earth Metals
China controls 70% of refined gallium and 60% of germanium output, and August 2023 export licensing tightened supplies for gallium-arsenide and gallium-nitride epitaxy. Gallium prices climbed 28% between July 2023 and March 2024, forcing non-Chinese foundries to qualify alternative sources at a 15-20% cost premium. Germanium shortages cut non-Chinese supply by 35% in 2024, according to the U.S. Geological Survey. Western governments are subsidizing domestic processing, but environmental permitting means new capacity will not reach scale until at least 2027, leaving a multi-year vulnerability window.
Rising IP-Related Litigation and Licensing Costs
Patent litigation intensified in 2024-2025 as non-practicing entities acquired portfolios covering FinFETs, through-silicon vias, and GaN epitaxy. Qualcomm reported that legal expenses jumped USD 340 million year over year in fiscal 2025 because of cases in Texas and the Unified Patent Court. Royalty stacking on 5G and Wi-Fi 7 standards can exceed 15% of a smartphone’s wholesale price, according to the IEEE. Smaller fabless firms lacking cross-licensing leverage allocate up to 5% of revenue to litigation reserves, reducing funds for research and packaging innovation. Recent USPTO guidance on AI-assisted design tools further clouds patent eligibility, delaying prosecution and inflating filing costs by roughly 25%.
*Our forecasts treat driver/restraint impacts as directional, not additive. The impact forecasts reflect baseline growth, mix effects, and variable interactions.
Segment Analysis
By Component: Active Devices Outpace Passive Components
The active and passive electronic components market size attributed to active devices is forecast to rise at an 8.24% CAGR through 2031, outstripping the broader market. Active power-management ICs for 48-V mild-hybrid and 800-V battery-electric vehicles integrate gate drivers, current sensors, and protection logic, shrinking board area by 40% while enhancing electromagnetic compatibility. Gallium-nitride high-electron-mobility transistors switch above 1 MHz in AI server power supplies, enabling 3 kW L-1 densities that liquid-cooling racks require.
Passive devices still dominate value in consumer electronics, holding a 57.12% share in 2025, but supply risk is growing. Multi-layer ceramic capacitor shortages in 2024 forced automotive OEMs to redesign battery-management systems with lower capacitance totals. Murata and TDK lifted X7R and C0G capacity by 15% in 2025, though yield on 0201 capacitors above 100 µF remains below 75%. Consolidation continued when Yageo acquired Chilisin, creating a vertically integrated passive group that can command premiums of 10-15% for assured supply.


By Mounting Technology: 3D Integration Gains Momentum
Surface-mount solutions retained a 63.06% slice of the active and passive electronic components market in 2025 thanks to mature pick-and-place automation. However, 3D integrated packaging is expected to post an 8.88% CAGR through 2031 as chiplet frameworks lower design risk. Intel’s Foveros and TSMC’s system-on-integrated-chips platforms bond dies at 10 µm pitch, cutting latency by 30% compared with interposer-based 2.5D alternatives.
Through-hole technology lingers in aerospace and industrial controls where mechanical shock remains high, but IPC-6012 Class 3 boards now qualify 0.4 mm-pitch BGAs that approach the robustness of old-style pins. Chip-scale packages under 0.5 mm height are popular in wearables, yet thermal constraints limit power to 500 mW, restricting adoption for processors. The migration from wire bonding to flip-chip bumping improved electrical performance but added moisture sensitivity, increasing assembly cycle time by up to six hours.
By Material: Wide-Bandgap Substrates Command Price Premiums
Silicon collected 71.18% of material revenue in 2025, but gallium nitride is expected to achieve an 8.51% CAGR from 2026 to 2031. GaN-on-SiC wafers raise base-station drain efficiency to 65% at 3.5 GHz, surpassing gallium-arsenide equivalents by 20 points and trimming radio-unit operating cost by USD 1,200 annually. Silicon-carbide MOSFETs halve switching losses in 800-V drivetrains, extending electric-vehicle range by up to 7% and justifying USD 300-USD 500 inverter premiums.
Gallium arsenide still underpins smartphone power amplifiers, but its brittleness and toxicity are pushing OEMs toward GaN-on-Si for cost savings. Supply tightness persists, defect densities above one per cm² keep 200-mm silicon-carbide wafer yield near 60%, forcing inverter suppliers to design redundancy. Indium phosphide and diamond remain niche substrates for terahertz and ultra-high-power switches until epitaxy scales.

By End-User Industry: Automotive Leads Growth Pace
Consumer electronics and computing retained 38.23% of the active and passive electronic components market in 2025, but automotive demand is forecast to grow fastest at 8.94% CAGR. Electric vehicles use 3,500-5,000 passive parts per unit versus 1,200 in combustion models, locking in multi-year commitments with tier-one suppliers. ADAS rollouts add 8-12 radar modules at 77 GHz, each embedding silicon-germanium MMICs and low-temperature co-fired ceramic antennas.
Smartphone replacement cycles extended to 3.2 years by 2025, yet AI-enabled handsets raise bill-of-materials by USD 15-USD 25 for LPDDR memory and neural accelerators. Industrial motor drives and solar inverters are gradually shifting to silicon-carbide and gallium-nitride discrete to reach 99% efficiency. Medical, aerospace, and defense applications command 5-10× pricing for radiation-hardened parts with failure rates below 10 FIT but contribute modest volume.
Geography Analysis
Asia Pacific captured 46.14% of the active and passive electronic components market in 2025, driven by China’s assembly dominance, South Korea’s memory leadership, and Taiwan’s foundry ecosystem. Yet over-reliance on a single region triggered diversification. The United Arab Emirates, through Mubadala, bought the remaining GlobalFoundries stake in 2024 and pledged USD 10 billion to add 22-nm automotive capacity, positioning the UAE as a regional fabrication hub. Saudi Arabia’s Public Investment Fund formed a semiconductor design center with Arm in 2025, part of a strategy that propels Middle East growth at an 8.35% CAGR.
North America and Europe rely on subsidy programs, but tool delivery and skilled-labour shortages have pushed first-wafer milestones into 2027-2028. China accelerated trailing-edge capacity by 35% in 2024 after U.S. export controls on EUV tools, targeting automotive and industrial nodes at 28-40 nm. Japan’s rebound hinges on TSMC’s Kumamoto fab and Rapidus’s 2-nm partnership with IBM; success depends on talent pipelines and localized chemicals.
South America and Africa remain nascent, focusing on low-complexity assemblies like power supplies and lighting. India’s electronics-manufacturing services expanded 22% in 2025 under smartphone-assembly incentives, yet wafer-fab projects remain under construction and will not yield output until late 2026.

Regulatory Landscape
Trade, environmental, and supply-chain rules are tightening across major electronics hubs. In the United States, semiconductor and derivative-product import duties under Section 232 took effect on January 15, 2026, with carve-outs referenced for data centers, R&D, and startups. The U.S. Trade Representative issued a Section 301 action on Chinese semiconductors on December 23, 2025, setting a framework that escalates beginning June 23, 2027. Taken together, these measures increase compliance and sourcing scrutiny for component OEMs and distributors that sell into US end markets.
In Europe, compliance pressure is rising through substances restrictions and supply-chain coordination policy. The European Commission adopted Regulation (EU) 2026/1347 to amend RoHS (Directive 2011/65/EU), adding restricted phthalates and expanding scope to include PCBs in IoT devices, effective August 1, 2026. That change accelerates material substitution and qualification cycles for passives and PCB-linked assemblies. Separately, the Commission proposed a Chips Act 2.0 framework that introduces a crisis stage to coordinate Member State reporting and response during supply disruptions. Industry bodies such as the Global Electronics Association also issued IPC-1401B (June 2026) to align ESG management and due-diligence practices with ISO and OECD-oriented expectations used by global customers and procurement programs.
Value Chain Analysis
The value chain spans upstream electronic materials (silicon wafers; GaN/SiC substrates and epitaxy inputs; specialty chemicals and gases; ceramic powders and metal foils), capital equipment and process consumables (lithography, deposition/etch, test/inspection, and CMP pads), device manufacturing (IDMs, foundries, and passive-component producers), packaging and assembly (OSATs, advanced packaging houses, and PCB/EMS providers), and downstream distribution and design-in channels (authorized distributors, independent distributors, and direct OEM supply under long-term agreements). Cross-regional technology and capacity linkages are becoming more visible: STMicroelectronics and Innoscience signed a GaN-on-Si development and manufacturing agreement in March 2025 that pairs China-based manufacturing scale with European capacity access. GlobalFoundries and Navitas announced a long-term partnership in November 2025 to manufacture next-generation GaN at GlobalFoundries Burlington, Vermont facility, supporting AI datacenter and critical-power applications.
Bottlenecks are concentrating in advanced nodes and in AI-related power and memory supply chains, with lead-time volatility amplified by trade-policy uncertainty. Supplyframe reported its Commodity IQ Lead Time Index at a record 166.6 in April 2025, reflecting how tariffs and demand surges propagate through procurement and allocation. SEMI/Kearney survey signals also point to perceived shortages in advanced nodes, alongside geopolitical risk as a key stability threat. Regional ecosystem build-out is also visible in India, where Tata Electronics and Merck Electronics signed an MoU in September 2025 covering semiconductor materials, fab infrastructure, and chemical and gas distribution for the Dholera, Gujarat fab, showing how chemical and specialty-material supply is being pulled closer to new fabrication footprints.
Competitive Landscape
The top 10 suppliers command roughly 45% of revenue, indicating a moderately concentrated environment. Infineon, NXP, and STMicroelectronics dominate automotive power semiconductors, leveraging long-term agreements to secure silicon-carbide capacity. Murata and TDK control 55% of automotive-grade multi-layer ceramic capacitor volume, enabling pricing discipline during allocation cycles. White-space opportunities exist in cryogenic passives for quantum computing, where demand for sub-4 K components is unmet.
Start-ups such as Navitas and GaN Systems are disrupting incumbents by shipping integrated GaN power stages with embedded gate drives, halving customer design cycles. USPTO data show a 40% jump in chiplet-interconnect filings in 2024 as consortia race to set standards. Automotive OEMs prize supply assurance over unit cost, allowing established vendors to defend share despite 15-20% premiums, whereas consumer-electronics brands commoditize passives and pressure margins through dual sourcing.
Active And Passive Electronic Components Industry Leaders
Infineon Technologies AG
NXP Semiconductors NV
Texas Instruments, Inc.
Panasonic Corporation
Murata Manufacturing Co. Ltd.
- *Disclaimer: Major Players sorted in no particular order

Market Opportunities and Future Outlook
AI data centers and electrified mobility are pushing component selection toward higher-efficiency power stages and higher-performance passives, creating whitespace for suppliers that can co-optimize devices, packaging, and magnetics for high-frequency conversion. The market already shows technical shifts, including movement toward inductors using nanocrystalline and amorphous alloy cores to support switching frequencies approaching 1 MHz in GaN and SiC power designs. At the same time, placement and performance requirements are tightening for MLCCs and low-inductance decoupling in dense compute platforms.
Capacity and capability investments announced for 2026 are also opening opportunities for localized sourcing, second-sourcing qualification, and design-in alignment with new fabs and packaging lines. In July 2026, Tower Semiconductor disclosed a USD 3 billion dual-track expansion in Japan for 300 mm silicon photonics, SiGe, and advanced packaging, supported by USD 1 billion in government grants. Intel began a EUR 5 billion capital investment at Leixlip, Ireland focused on AI and high-performance computing capacity, and TSMC outlined an additional USD 100 billion US manufacturing investment plan aimed at multiple advanced fabs in Arizona. These moves increase the addressable need for adjacent component ecosystems, including substrates, interconnects, power discretes, and high-reliability passives, located near new manufacturing footprints. Procurement teams are also intensifying qualification efforts to mitigate tariff exposure and materials volatility in wide-bandgap and rare-metal-linked supply chains.
Recent Industry Developments
- July 2026: Infineon opened its EUR 5 billion Smart Power Fab in Dresden to expand power semiconductors and analog/mixed-signal manufacturing. The project adds a major European capacity anchor for automotive and industrial electronics and strengthens regional supply resilience under EU on-shoring programs.
- December 2025: Infineon pledged EUR 5 billion to triple silicon-carbide backend capacity in Kulim, Malaysia by Q4 2027. The investment targets packaging and test constraints that can throttle wide-gangap device shipments even when front-end wafer supply is available.
- October 2025: Murata completed a JPY 150 billion expansion at its Izumo site, adding 25% MLCC capacity for 150 C automotive grades. Higher output of high-temperature capacitors supports EV and ADAS electronics programs that demand extended operating ranges and long qualification cycles.


Research Methodology Framework and Report Scope
Market Definition and Coverage
This market covers the global revenue generated from selling active and passive electronic components used in electronic systems across end users such as automotive, consumer electronics, industrial, communications, medical, aerospace and defense, and energy applications.
Scope exclusions: Services (design, testing, and repair), electronic manufacturing equipment, raw wafers, and discrete materials not sold as finished components are excluded from the market value.
Segmentation Overview
- By Component
- Active Components
- Passive Components
- By Mounting Technology
- Through-Hole Technology
- Surface-Mount Technology
- Chip-Scale Package
- 3D Integrated Packaging
- By Material
- Silicon
- Gallium Arsenide
- Silicon Carbide
- Gallium Nitride
- Other Materials
- By End-User Industry
- Automotive
- Consumer Electronics and Computing
- Industrial
- Communications
- Medical
- Aerospace and Defense
- Energy and Utilities
- By Geography
- North America
- United States
- Canada
- Mexico
- Europe
- United Kingdom
- Germany
- France
- Italy
- Rest of Europe
- Asia-Pacific
- China
- Japan
- India
- South Korea
- Rest of Asia
- Middle East
- Israel
- Saudi Arabia
- United Arab Emirates
- Turkey
- Rest of Middle East
- Africa
- South Africa
- Egypt
- Rest of Africa
- South America
- Brazil
- Argentina
- Rest of South America
- North America
Data Sources, Market Sizing, and Validation
Desk Research
Desk work started with building a clean view of demand signals that move electronic component shipments and pricing. We leaned on public sources such as semiconductor and electronics industry association releases, customs and trade statistics where available, US government datasets (for example, production, trade, and price series), standards and regulatory references for electronics safety, and peer reviewed technical literature that clarifies adoption of packaging and materials.
Company annual reports, investor decks, and earnings call notes were used to sanity check revenue exposure by end market and region, followed by reputable press coverage for capacity adds, supply tightness, and inventory cycles. In a few places, we also used an approved paid subscription for company financials and another for patent lookups to confirm technology direction (for example, packaging shifts and wide bandgap material activity). This list of desk sources is illustrative only, and many other public references were consulted for cross checks and clarification during the work.
Primary Interviews and Surveys
Primary inputs were gathered through expert interviews and structured surveys with component makers, distributors, EMS related contacts, and large buyers across consumer electronics, automotive electronics, and industrial electronics. These discussions helped confirm what is counted as a sellable component versus adjacent hardware, validate how pricing changed during recent cycles, and check how demand varied by region across APAC, EMEA, and the Americas.
Distribution of primary research fieldwork respondents
| Company type | Respondent position | Region |
|---|---|---|
| Top tier: 37% | CXOs: 14% | APAC: 51% |
| Mid tier: 47% | Functional/Unit leaders: 29% | EMEA: 29% |
| Smaller Players: 16% | Managers: 57% | Americas: 20% |
Market-Sizing & Forecasting
Sizing was built using a top-down approach where production and trade signals, electronics output trends, and end market build rates were used to reconstruct the component demand pool by region, which is then translated into value using realistic price ranges. The totals were corroborated with selective bottom-up checks, such as supplier and distributor revenue exposure, sampled ASP times volume for key component families, and channel feedback on inventory digestion, which helped adjust for overcounting during cycle peaks.
A few of the practical inputs we tracked include electronics manufacturing output and shipments, semiconductor and passive component pricing direction, device content growth in vehicles and consumer devices, packaging and mounting mix shifts (surface-mount versus newer form factors), and adoption pace of materials like silicon carbide and gallium nitride where applicable. For forecasting, we relied mainly on scenario analysis supported by simple time series smoothing on core demand indicators, and the final path was aligned to what primary respondents expected for capacity, lead times, and end market ordering behavior. Where bottom-up signals were incomplete in smaller regions or niche applications, we filled gaps using penetration and mix assumptions that were verified in follow-up calls.
Data Validation & Update Cycle
Outputs were validated through several checks that compare the model against independent signals, including regional electronics output trends, trade flows, and the implied revenue intensity per end market. If any region showed a sharp jump that could not be explained by pricing or volume movement, the assumptions were revisited and the relevant interview notes were rechecked before sign-off.
Each report is refreshed annually, and interim updates are made when material events occur, such as major capacity additions, supply disruptions, or large demand shocks in key end markets. Before delivery, an analyst performs a fresh pass on the latest public releases and pricing direction so clients receive an updated view that matches the most recent market conditions.
Mordor Intelligence's Active and Passive Electronic Components Market Size Measured Against Other Published Estimates
Published market sizes for electronic components often vary because the counted product scope can shift, and the timing of price and cycle assumptions can be different across studies. We also see differences when authors mix components with equipment or materials, or when regional coverage is not fully consistent.
For this market, the biggest gap drivers tend to be whether adjacent items like electronics manufacturing equipment are included, how wide bandgap material related value is treated, and which year is used as the anchor for ASP changes during inventory upturns and corrections. Some estimates also report a narrower definition that leans more toward semiconductors, while others use a wider electronics bucket that blends components with upstream inputs.
Benchmark comparison
| Source | Market Size | Gaps in Research Methodology |
|---|---|---|
| Mordor Intelligence | USD 0.82 T (2026) | |
| Trade Distributor Commentary A | USD 0.86 T (2025) | The figure is presented as a SAM that bundles active and passive components with related equipment and materials, which can lift totals versus a components-only count and may also apply a different timing for price levels. |
| Industry Data Publisher B | USD 0.49 T (2024) | The estimate appears to use a narrower revenue definition and a different base year, and it may not fully capture the full mounting, material, and end user coverage that expands the addressable value in a global scope. |
The table shows that most of the spread comes from what is included around components (especially equipment and materials) and which year is used to express pricing and cycle conditions. By separating sellable components from adjacent categories and keeping price timing aligned to the stated current year, the market total remains traceable to clear demand signals, a choice applied by Mordor Intelligence.


Key Questions Answered in the Report
What is the forecast value of the active and passive electronic components market in 2031?
It is projected to reach USD 1.19 trillion, reflecting a 7.75% CAGR over 2026-2031.
Which segment is growing fastest within the market?
Automotive applications lead growth with an expected 8.94% CAGR, driven by electric-vehicle and ADAS penetration.
Why are wide-bandgap materials important?
Gallium nitride and silicon carbide cut switching losses and boost efficiency in EV inverters and 5G radios, justifying price premiums.
How are government subsidies affecting supply chains?
Programs in the United States, European Union, India, and Japan are spurring local fabs, though tool lead times delay near-term output.
What supply-chain risks should OEMs watch?
Rare-earth metal volatility and IP litigation can raise costs and disrupt production for radio-frequency and power devices.
How concentrated is supplier power in this field?
The top 10 suppliers hold about 45% of revenue, indicating a moderately concentrated environment with ongoing consolidation.
Page last updated on:






