
Activated Carbon Fiber Market Size and Share
Market Overview
| Study Period | 2020 - 2031 |
|---|---|
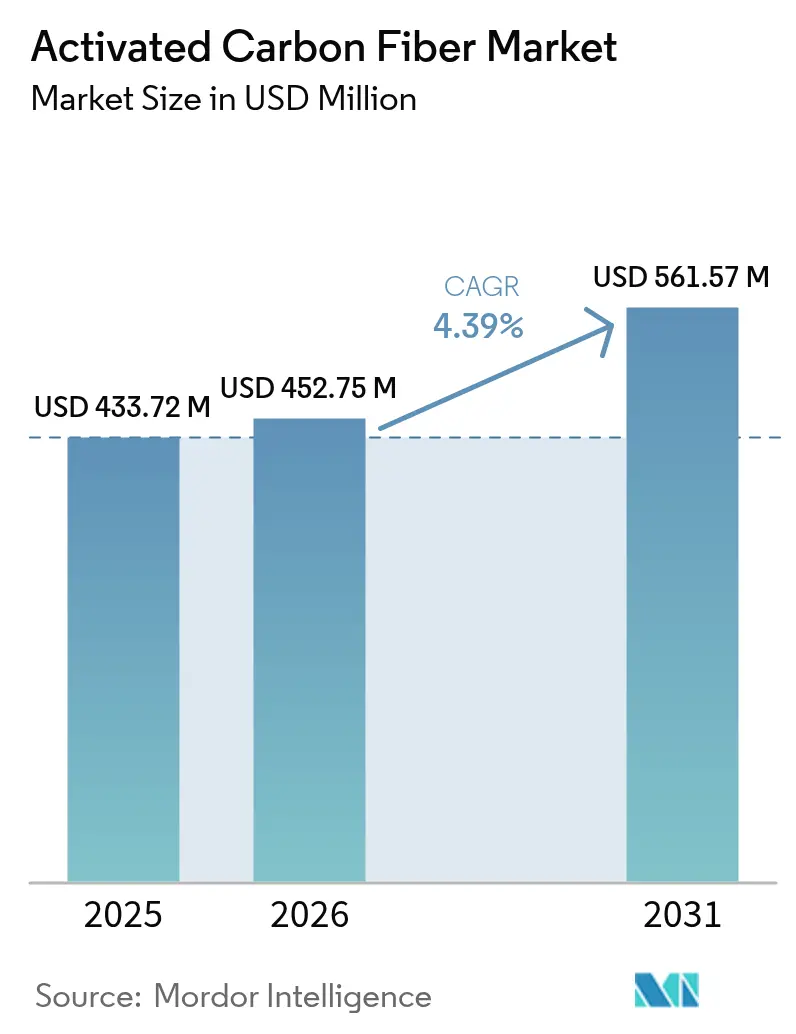
| Market Size (2026) | USD 452.75 Million |
| Market Size (2031) | USD 561.57 Million |
| Growth Rate (2026 - 2031) | 4.39 % |
| Fastest Growing Market | Asia Pacific |
| Largest Market | Asia Pacific |
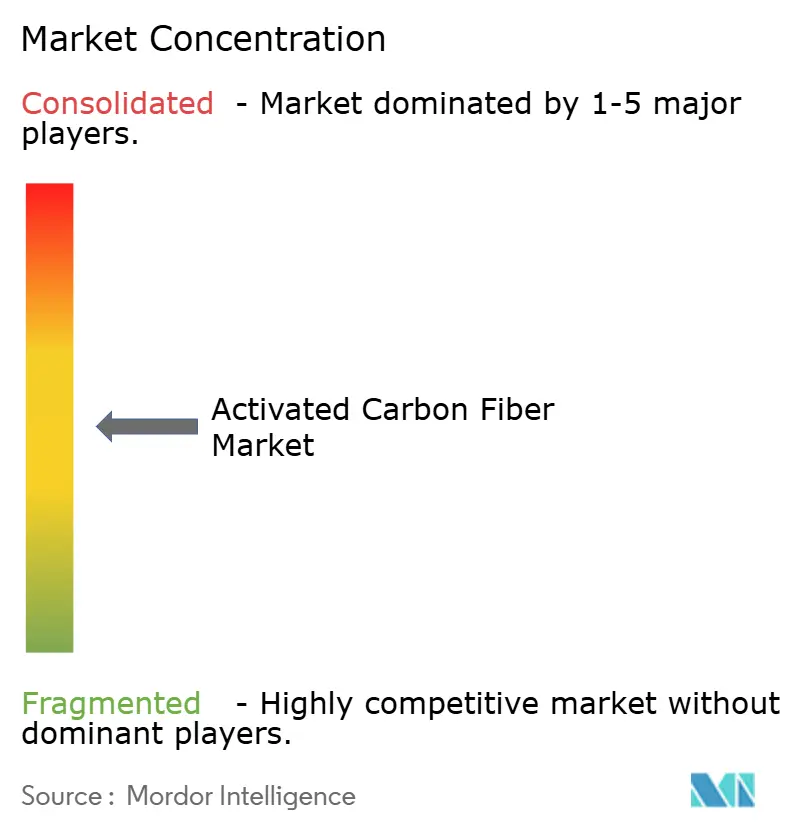
| Market Concentration | Medium |
Major Players *Disclaimer: Major Players sorted in no particular order Image © Mordor Intelligence. Reuse requires attribution under CC BY 4.0. | |
Activated Carbon Fiber Market Analysis by Mordor Intelligence
The Activated Carbon Fiber market size is expected to grow from USD 433.72 million in 2025 to USD 452.75 million in 2026 and is forecast to reach USD 561.57 million by 2031 at 4.39% CAGR over 2026-2031. This steady trajectory reflects a material that thrives in niches where high volumetric efficiency, rapid adsorption-desorption cycles, and strict environmental compliance outweigh price sensitivity. Demand intensifies as semiconductor fabs, sterilization facilities, and chemical processors turn to advanced adsorbents that help them meet tightening air-quality laws without expanding equipment footprints. Medical applications register the fastest uptake as hospitals adopt point-of-use filters and personal protective textiles designed for stringent indoor-air targets[1]. Asia-Pacific preserves cost leadership and proximity to electronics clusters, yet North America and Europe show resilience through aggressive decarbonization policies and renewed investment in domestic supply chains.
Key Report Takeaways
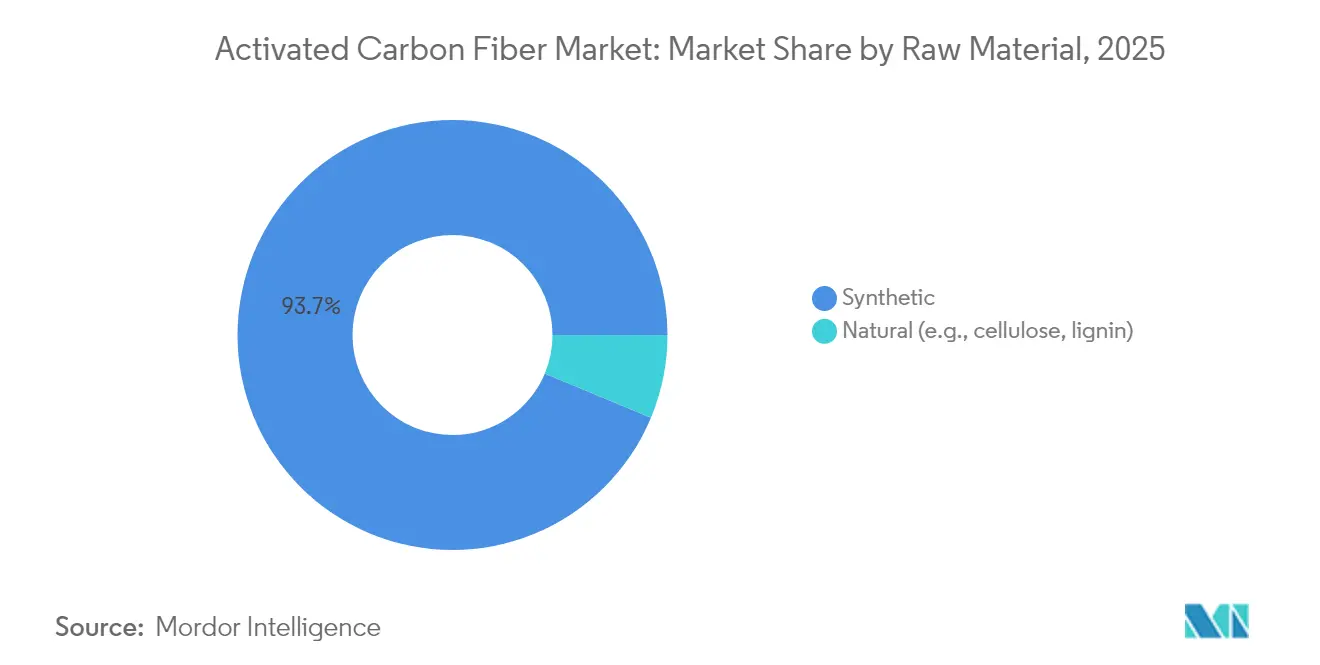
- By raw material, synthetic feedstocks held 93.72% of activated carbon fiber market share in 2025, and they are on track to grow at a 4.42% CAGR to 2031.
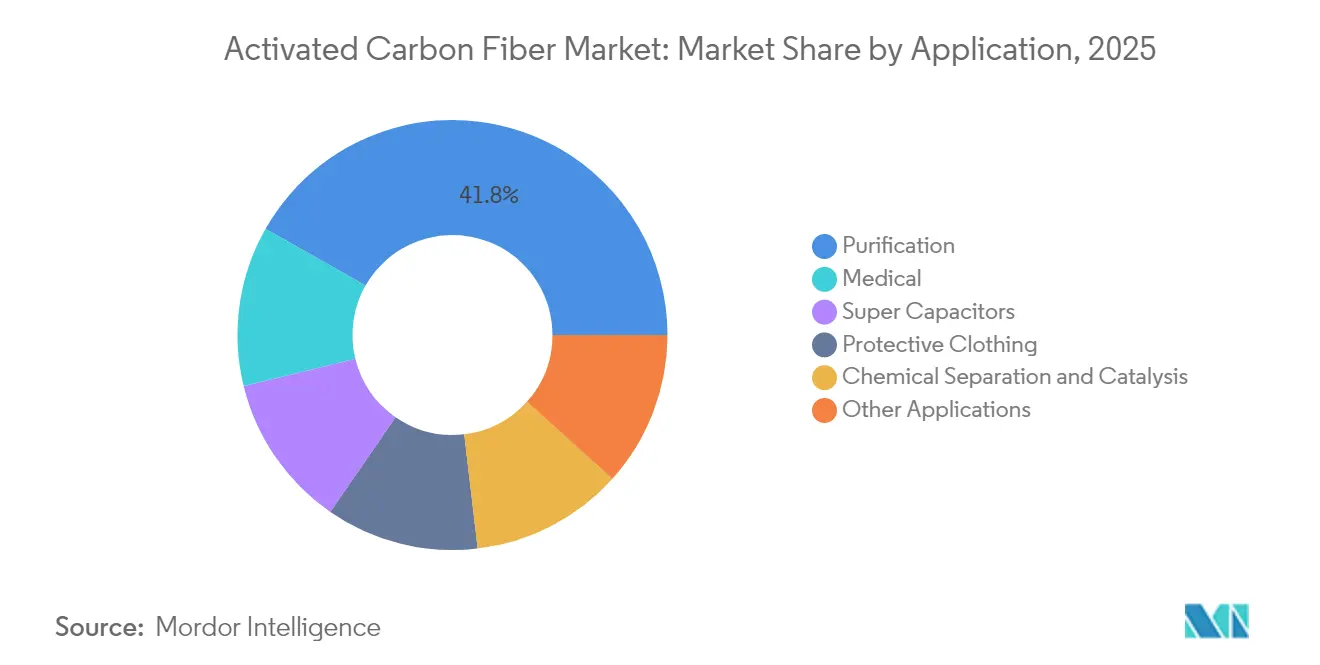
- By application, purification dominated with 41.78% of the activated carbon fiber market size in 2025, while medical uses are expanding at a 5.95% CAGR through 2031.
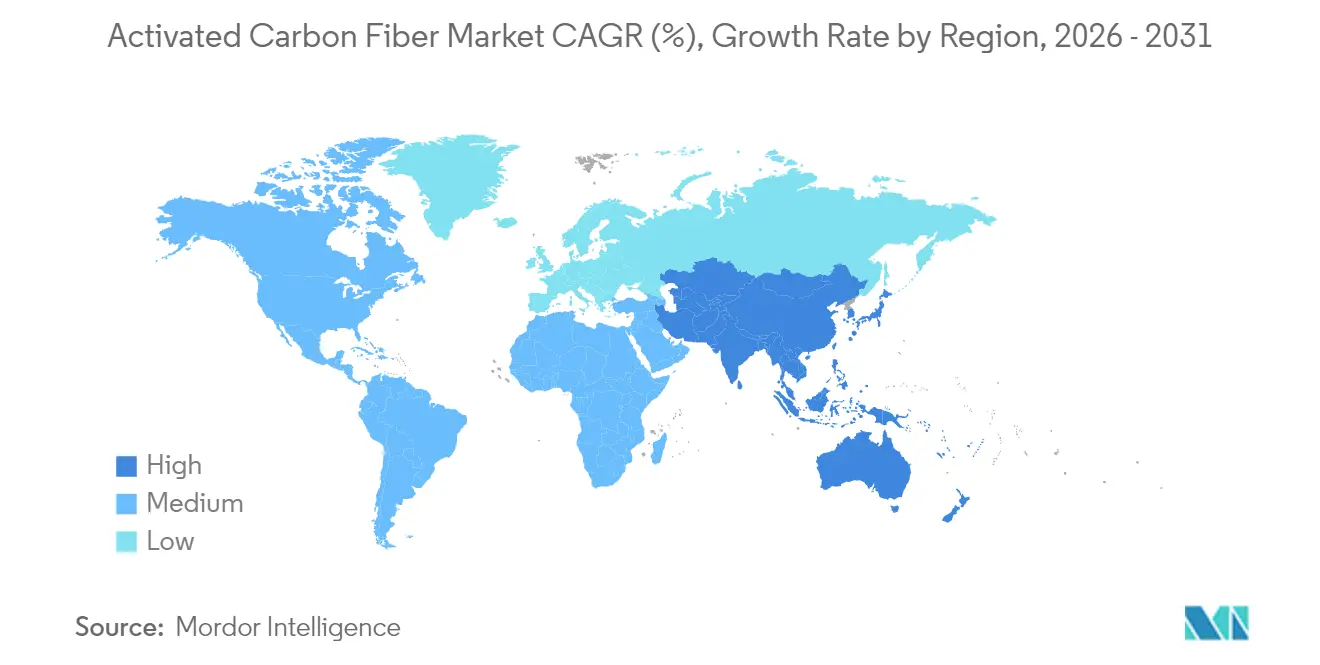
- By geography, Asia-Pacific accounted for 42.74% of activated carbon fiber market share in 2025; the same region is projected to compound at 4.96% CAGR over the outlook window.
Note: Market size and forecast figures in this report are generated using Mordor Intelligence’s proprietary estimation framework, updated with the latest available data and insights as of 2026.
Market Trends and Insights
Drivers Impact Analysis of Activated Carbon Fiber Market*
| Drivers | (~) % Impact on CAGR Forecast | Geographic Relevance | Impact Timeline |
|---|---|---|---|
| Tightening global emission norms on VOCs | +1.2% | EU and North America lead | Medium term (2-4 years) |
| Superior adsorption-desorption kinetics | +0.8% | Asia-Pacific manufacturing hubs | Long term (≥ 4 years) |
| Growth in high-power supercapacitor output | +0.9% | Asia-Pacific core, spillover to North America | Medium term (2-4 years) |
| ACF scrubbers in semiconductor fabrication | +0.6% | Asia-Pacific and North America semiconductor clusters | Short term (≤ 2 years) |
| Rise of wearable personal air-filtration | +0.4% | Global, early adoption in developed markets | Long term (≥ 4 years) |
| Source: Mordor Intelligence | |||
Tightening Global Emission Norms Drive Industrial Adoption
Regulators worldwide now require deeper cuts in volatile organic compound emissions, and the activated carbon fiber market benefits because the material can capture traces that escape granular carbons. The European Union’s STS BAT Conclusions, effective 2025, apply to more than 500,000 solvent-using businesses and formally list activated carbon fiber as Best Available Technology. .S. sterilization plants must now achieve a 99.99% reduction in ethylene oxide discharges under tightened National Emission Standards for Hazardous Air Pollutants. Facilities switching to fiber systems appreciate smaller bed volumes, lower pressure drop, and fewer regeneration cycles than granular beds. As enforcement timetables compress, buyers lean toward solutions that provide headroom for even stricter future rules. The result is a regulatory pull that sustains double-digit volume gains for high-spec fiber modules across regional markets.
Superior Kinetics Enable Process Intensification
Activated carbon fiber attains equilibrium adsorption in minutes, while granular media require hours, a gap that transforms process economics in continuous plants. Laboratory trials show 10- to 100-fold faster uptake thanks to accessible external surfaces that avoid internal diffusion limits. Semiconductor etch shops value this speed because rapid regeneration keeps perfluorocarbon capture online without halting production[2]. Chemical processors retrofit smaller contactors that free up floor space and reduce auxiliary energy consumption. Faster cycles also cut steam use in desorption, lowering utility bills during volatile fuel markets. As continuous manufacturing spreads, fiber kinetics underpin a shift toward compact, modular pollution-control and separation equipment.
Semiconductor Industry Adopts Advanced Emission Control
Perfluorocarbon gases used in plasma etching present greenhouse-warming potentials thousands of times that of CO₂, forcing fabs to seek cost-effective abatement. Trials across leading 300 mm wafer lines show activated carbon fiber scrubbers capturing over 95% of key fluorinated compounds at ambient conditions, eliminating the need for energy-dense combustion units. Rapid cycling limits downtime and keeps tool utilization high, a critical economic driver in capital-intensive fabs. As the chip sector ramps in Japan, South Korea, and the United States under national subsidy programs, fiber systems gain share as they align with net-zero corporate road-maps.
Growth of Wearable Personal Air-Filtration Textiles
Consumers facing wildfire smoke, urban smog, and pandemic threats demand portable clean-air solutions. Activated carbon fiber weaves provide thin, flexible, and highly adsorptive layers compatible with fashion apparel and respirators. Research teams have developed fabrics that combine ultraviolet blocking, antibacterial performance, and 24-hour adsorption stability. Early adopters in Europe and North America purchase premium masks and jackets that incorporate multilayer fiber linings. Long-term prospects include smart garments with embedded sensors that indicate saturation, a feature impossible with traditional carbon granules. The lifestyle segment thus opens a consumer channel that adds diversification to industrial-centric demand.
Restraints Impact Analysis of Activated Carbon Fiber Market*
| Restraints | (~) % Impact on CAGR Forecast | Geographic Relevance | Impact Timeline |
|---|---|---|---|
| Upstream price swings in PAN and pitch | -0.7% | Global, acute in Asia-Pacific supply hubs | Short term (≤ 2 years) |
| Price pressure from granular and powdered carbon | -0.5% | Global, more acute in cost-sensitive deployments | Medium term (2-4 years) |
| Scarcity of continuous high-temperature lines | -0.3% | Global, limited specialist capacity | Long term (≥ 4 years) |
| Source: Mordor Intelligence | |||
Precursor Price Volatility Constrains Production Economics
Polyacrylonitrile and petroleum pitch account for up to 60% of finished fiber cost, so price spikes erode margins. The U.S. Producer Price Index for carbon and graphite products rose in May 2025, signaling broad inflation across carbon supply chains. Textile-grade PAN diverts toward mainstream fabric markets when apparel demand rebounds, squeezing availability for technical fibers. Refineries, chasing higher yields on transportation fuels, trim pitch output, and further tighten feedstock pools. Producers counter by dual-sourcing, hedging, and carrying larger safety stocks, but these strategies raise working-capital intensity. Lignin-based alternatives promise relief; however, scaling new biobased processes still faces technical hurdles.
Cost Competition Limits Market Penetration
Granular and powdered activated carbon often sells at half the unit price of fiber, limiting fiber adoption in municipal water treatment and bulk-phase odor control. Customers with relaxed performance targets lean toward lower CAPEX even if lifecycle costs rise. Emerging-economy utilities prioritize initial outlay because project finance rules favor least-cost bids. As a result, activated carbon fiber remains a premium option where kinetics, weight, or space savings justify the spend. Suppliers continue to refine pitches emphasizing smaller bed volumes, lower maintenance, and disposal advantages to convert price-sensitive buyers over time.
*Our forecasts treat driver/restraint impacts as directional, not additive. The impact forecasts reflect baseline growth, mix effects, and variable interactions.
Activated Carbon Fiber Market Segment Analysis
By Raw Material:
Synthetic Dominance Supports High-Spec DemandSynthetic precursors accounted for 93.72% of the activated carbon fiber market share in 2025 and will record a 4.42% CAGR through 2031. Within this group, polyacrylonitrile fibers excel in purification, medical, and semiconductor filtration because they offer tight pore-size control and high tensile strength.
Pitch-based grades cater to energy-storage customers that require conductive matrices, while phenolic fibers serve in harsh chemical environments that demand acid resistance. Viscose derivatives, though still niche, present precise mesopore distributions that favor specialty adsorption. Natural feedstocks such as lignin and cellulose attract sustainability-minded users, yet inconsistent quality and limited commercial lines keep their combined share minor. Investment in continuous stabilization and carbonization aims to lift output and cut synthetic feedstock unit costs, reinforcing synthetic supremacy for the forecast horizon.

By Application:
Medical Filters Accelerate While Purification LeadsPurification kept 41.78% of the activated carbon fiber market size in 2025, fueled by stricter air and water standards in high-population regions. Fixed-bed and rotating-drum modules anchor solvent recovery, acid gas removal, and hydrocarbon polishing across chemical, printing, and waste-processing sites.
Medical demand, though smaller, expands at a 5.95% CAGR to 2031 as hospitals embrace compact point-of-use ethylene oxide scrubbers and air-filtration panels designed for isolation rooms. Protective clothing blends ACF into multilayer suits that defend workers in cleanrooms and emergency response. Supercapacitors widen the total addressable market as automotive and grid-balancing markets favor high-power modules; suppliers that master low-resistance coating lines stand to earn premium margins. Specialty areas, including catalyst supports and odor-neutralizing consumer textiles, diversify revenue and hedge against cyclical downturns in any single segment.
Geography Analysis
APAC Activated Carbon Fiber Market
Asia-Pacific captured 42.74% of the activated carbon fiber market share in 2025 and is set to post a 4.96% CAGR through 2031. China attracts capital because low-cost electric power, skilled labor, and proximity to semiconductor fabs lower delivered costs. Japanese firms such as Kuraray and Toyobo, with decades of adsorbent expertise, focus on research alliances that push fiber into carbon-neutral process routes.
The Americas and EMEA Activated Carbon Fiber Market
North America is characterized by strict federal emissions rules converge with on-shoring of chip and battery supply chains. The EPA’s sterilization rules accelerate retrofit programs in healthcare facilities, bolstering short-cycle filter demand. Canada and Mexico contribute incremental growth as cross-border manufacturing expands. Europe delivers steady volume gains under the EU’s STS BAT Conclusions, which tighten solvent emissions across pharmaceuticals, coatings, and printing. Germany pioneers integrated solvent-recovery plants that pair fiber beds with thermal swing regeneration to improve energy efficiency. The United Kingdom and France use fiber to meet decarbonization targets in waste-to-energy and specialty chemical sites. Southern Europe, facing high electricity costs, values the lower pressure drop of fiber modules to reduce operating expenses. South America, the Middle East, and Africa remain embryonic but promising. Growth stems from refinery upgrades, mining-related air-quality mandates, and municipal drinking-water projects seeking high-flow-rate adsorbents. However, price sensitivity and limited local manufacturing constrain near-term penetration, keeping regional shares in the single digits.
Value Chain Analysis
The value chain starts with precursor sourcing, with synthetic feedstocks (PAN and petroleum pitch) accounting for most commercial output, while smaller natural routes (cellulose, lignin) remain under development for sustainability and cost relief. Upstream suppliers provide polymers or resins, pitch, and process utilities, and activated carbon fiber (ACF) producers carry out fiber spinning, thermostabilization, carbonization, and activation (steam/CO2 or chemical), followed by finishing into cloth, felt, paper, or pleated elements. Downstream channels include module fabricators and OEMs for air and gas purification (VOC and hazardous air pollutant control), medical filtration and PPE textiles, and electrode and separator converters for supercapacitors.
Key bottlenecks cluster around energy-intensive high-temperature lines and the need for consistent pore structure and batch-to-batch quality, which constrains the number of scalable continuous production assets. Price and availability swings in PAN and pitch also increase procurement risk, pushing firms toward vertical integration, dual sourcing, and longer-term offtake structures, particularly for high-spec buyers such as semiconductor fabs and sterilization facilities that prioritize performance and compliance over lowest unit cost. Distribution commonly includes technical service and performance validation at customer sites, so application engineering and refurbishment or regeneration programs are a visible value-add alongside the physical fiber supply.
Competitive Landscape
The activated carbon fiber market remains moderately fragmented because process know-how rather than scale defines entry barriers. Leading players integrate upstream to secure PAN and pitch in an environment of volatile petrochemical costs. Kuraray, Toyobo, and Osaka Gas Chemical use proprietary activation recipes that tailor pore-size distributions for VOC, dioxin, and greenhouse-gas targets. Chinese producers leverage low-cost utilities yet invest in certification and quality systems to meet export standards. Supply chains adapt to address resilience concerns. North American buyers lock multi-year off-take pacts to hedge against Asia-Pacific shipping disruption. European firms diversify precursor contracts to reduce exposure to single refineries. Vendors differentiate by offering application engineering services, real-time performance monitoring, and refurbishment programs that extend fiber life cycles.
Activated Carbon Fiber Industry Leaders
-
HPMS Graphite
-
Kuraray Co. Ltd
-
Osaka Gas Co. Ltd (Daigas Group)
-
TOYOBO CO. LTD
-
UNITIKA LTD
- *Disclaimer: Major Players sorted in no particular order
Activated Carbon Fiber Market Companies Covered in this Report
- Anshan Sinocarb Carbon Fibers Co., Ltd.
- China Beihai Fiberglass Co. Ltd
- Evertech Envisafe Ecology Co. Ltd
- Hangzhou Nature Technology Co. Ltd
- HPMS Graphite
- Jiangsu Tongkang Activated Carbon Fiber Co. Ltd
- Kuraray Co. Ltd
- Nantong Yongtong Environmental Technology Co. Ltd
- Osaka Gas Co. Ltd (Daigas Group)
- Taiwan Carbon Technology Co., Ltd.
- TOYOBO CO. LTD
- UNITIKA LTD
Market Opportunities and Future Outlook
Opportunities are most concentrated where compact ACF modules can show measurable operating advantages over granular and powdered carbon, especially in regulated point-source emissions and high-uptime manufacturing. Semiconductor abatement and sterilization emissions control are aligned with this use-case fit, since retrofits can be implemented without expanding equipment footprints, reflecting the report context of tighter VOC and hazardous air pollutant requirements and a shift toward advanced adsorbents that offer compliance headroom.
On supply-chain and circularity, investment and partnerships around activated carbon reactivation point to a lifecycle service opportunity that can extend into fiber-based systems through module refurbishment and monitoring. In February 2026, Calgon Carbon (Kuraray) announced a nearly USD 100 million expansion of drinking-water carbon reactivation capacity at its Columbus, Ohio facility, and in March 2026 Kuraray began a joint study with DOWA ECO-SYSTEM on activated carbon reactivation resource circulation. These actions support regeneration infrastructure, match buyer demand for resilient domestic sourcing, and give suppliers room to bundle high-performance media with reactivation, monitoring, and compliance-focused service contracts.
Recent Industry Developments in Activated Carbon Fiber Market
- June 2026: Kuraray conducted a management briefing that highlighted growth priorities for its activated carbon business, including drinking-water purification use cases such as PFAS removal. The emphasis indicates ongoing capital and commercial focus on high-compliance purification markets that share performance expectations with activated carbon fiber modules in premium air and liquid treatment systems.
- March 2026: Kuraray commenced a joint study with DOWA ECO-SYSTEM CO., LTD. on a resource circulation business focused on activated carbon reactivation. Building reactivation and recycling pathways supports lifecycle offerings and strengthens supplier positioning with customers that increasingly evaluate adsorbents on total cost, security of supply, and end-of-life handling.
- May 2024: Calgon Carbon (a Kuraray company) completed the acquisition of the industrial reactivated carbon business from Sprint Environmental Services, LLC, creating an expanded footprint in the Gulf of Mexico region. The transaction broadened reactivation capacity and service reach, reinforcing integrated supply plus reactivation models used by customers to stabilize adsorbent performance and procurement.
Activated Carbon Fiber Market Report Scope and Research Methodology
Market Definition and Coverage
For this study, the market covers revenues generated from activated carbon fiber materials sold for adsorption and filtration uses across industries. Values are counted at the point of commercial sale in each geography and reported in USD.
Scope exclusions: It does not include conventional activated carbon (powdered or granular), generic carbon fiber grades not activated for adsorption, or downstream finished products where the activated carbon fiber value cannot be separated.
Segments Covered in This Report
- By Raw Material
- Natural (e.g., cellulose, lignin)
- Synthetic
- Pitch-based
- PAN-based
- Phenolic-based
- Viscose-based
- Others
- By Application
- Purification
- Chemical Separation and Catalysis
- Protective Clothing
- Medical
- Super Capacitors
- Other Applications
- Geography
- Asia-Pacific
- China
- Japan
- South Korea
- India
- Rest of Asia-Pacific
- North America
- United States
- Canada
- Mexico
- Europe
- Germany
- United Kingdom
- France
- Italy
- Rest of Europe
- South America
- Brazil
- Argentina
- Rest of South America
- Middle-East and Africa
- Saudi Arabia
- South Africa
- Rest of Middle-East and Africa
- Asia-Pacific
Data Sources, Market Sizing, and Validation
Desk Research
Desk research starts with mapping demand pockets where adsorption-grade fibrous carbon is used, and then checking what is realistically supplied into those uses. Public sources were used to anchor the model, such as USGS mineral and industrial materials statistics, UN Comtrade trade flows for relevant HS codes, EPA air and water program publications, and occupational safety guidance from agencies such as NIOSH and OSHA.
We also reviewed standards and technical literature (including peer-reviewed adsorption and materials journals) to understand typical performance, yield, and substitution limits versus granular carbon. Company filings, investor presentations, product brochures, and reputed press were used to confirm capacity announcements, application adoption, and pricing direction. When needed, paid subscriptions for company financials and intelligence, patent databases, and shipment-level import and export records were used to cross-check exposure to the product. These desk sources are illustrative, and additional public references were reviewed for data collection, validation, and clarification.
Primary Interviews and Surveys
Primary discussions were held with participants across the value chain, including raw material suppliers, activated carbon fiber producers, distributors, and end users. Use areas covered included air purification, industrial recovery, protective wear, medical uses, and energy storage. We used these interviews to validate use-wise penetration and typical buying specifications, and to understand how pricing moves with precursor and energy costs. We then checked whether those patterns differ across APAC, EMEA, and the Americas.
Distribution of primary research fieldwork respondents
| Company type | Respondent position | Region |
|---|---|---|
| Top tier: 36% | CXOs: 12% | APAC: 41% |
| Mid tier: 44% | Functional/Unit leaders: 29% | EMEA: 34% |
| Smaller Players: 20% | Managers: 59% | Americas: 25% |
Market-Sizing & Forecasting
Sizing was built using a top-down demand pool approach where air and water treatment needs, industrial solvent recovery activity, and protective filtration requirements are converted into an addressable activated carbon fiber consumption base. To keep totals grounded, we corroborated results with selective bottom-up approximations, such as sampled capacity by key production routes, channel checks on typical shipment sizes, and an ASP times volume sense-check for major applications.
Key inputs used in the model include precursor availability and conversion yields, average selling price bands by form factor (cloth, felt, and related formats), adoption intensity in purification and recovery systems, and regional manufacturing output trends that influence filtration and emission-control spending. For forecasting, scenario analysis was used and anchored on expert views on industrial activity cycles, environmental compliance intensity, and the pace of adoption in supercapacitor-related uses. When bottom-up signals were incomplete for smaller suppliers, we used conservative utilization assumptions and re-tested them against trade flow direction and application-level consumption logic.
Data Validation & Update Cycle
Outputs are checked through several rounds. We compare implied consumption per application with independent indicators such as filtration media demand trends, industrial production signals, and import and export movement. Outliers are investigated, and assumptions are revisited when a price, capacity, or demand driver moves outside a normal range, followed by a second analyst review before sign-off.
The dataset is refreshed annually, and interim updates are made when material events occur, such as large capacity additions, sharp precursor cost shifts, or regulation changes that impact adsorption demand. Before delivery, a final pass is completed so clients receive the latest aligned view across market size, drivers, and assumptions.
Mordor Intelligence's Activated Carbon Fiber Market Size Compared With Other Published Estimates
Published numbers for activated carbon fiber often vary because groups do not count the same product scope, year timing, or conversion from volumes to revenues. Differences also come from how pricing is treated across cloth versus felt formats, and whether end uses like protective clothing and medical filtration are counted as fiber value or as finished product value.
The main gap driver is usually scope control around what is truly activated carbon fiber revenue versus adjacent activated carbon products. This is followed by how quickly ASPs are stepped up with precursor and energy cost changes, and how often those assumptions are refreshed. When the 2025 to 2026 step is tied to application demand signals and cross-checked with supply-side capacity and trade movement, the resulting 2026 value stays closer to an addressable fiber-only pool, a modeling choice applied by Mordor Intelligence.
Benchmark comparison
| Source | Market Size | Gaps in Research Methodology |
|---|---|---|
| Mordor Intelligence | USD 452.75 M (2026) | |
| Industry Consultancy A | USD 438.75 M (2025) | Uses a different base year and may not apply the same year-to-year ASP progression into 2026, which can shift the value even when the end-use list looks similar. |
| Research Publisher B | USD 866.77 M (2024) | Appears to apply a wider revenue scope by counting more downstream filtration forms and broader carbon material functions, which can inflate the total versus fiber-only revenues. |
The spread in the table mostly comes from year selection and what is counted as activated carbon fiber revenue versus adjacent carbon materials or finished goods. By keeping inputs tied to observable demand indicators and then verifying them with supply signals, the estimate becomes easier to trace and repeat when assumptions need to be updated.
Key Questions Answered in the Report
What is the current value of the activated carbon fiber market?
The activated carbon fiber market size stood at USD 452.75 million in 2026 and is tracking toward USD 561.57 million by 2031.
Which raw material dominates commercial production?
Synthetic precursors, mainly polyacrylonitrile and pitch, supply 93.72% of global volume due to their consistent pore architecture and mechanical strength.
Why are medical applications growing faster than other uses?
Hospitals and PPE makers favor fiber filters to meet strict indoor air targets and sterilant emission rules, supporting a 5.95% CAGR through 2031.
Which region leads demand and why?
Asia-Pacific commands 42.74% share because it combines low-cost manufacturing with proximity to semiconductor and electronics hubs that require high-spec emission controls.
How do granular and powdered carbons compete with fiber?
Granular and powdered carbons are cheaper, so they dominate bulk treatment where contact times are long, but fiber wins in tight-footprint or high-throughput processes that demand rapid kinetics.
What technology trend could reshape future supply?
Commercialization of lignin-based precursor lines promises lower cost and reduced carbon footprints, potentially shifting feedstock economics later in the decade.