
Activated Bleaching Earth Market Size and Share
Market Overview
| Study Period | 2021 - 2031 |
|---|---|
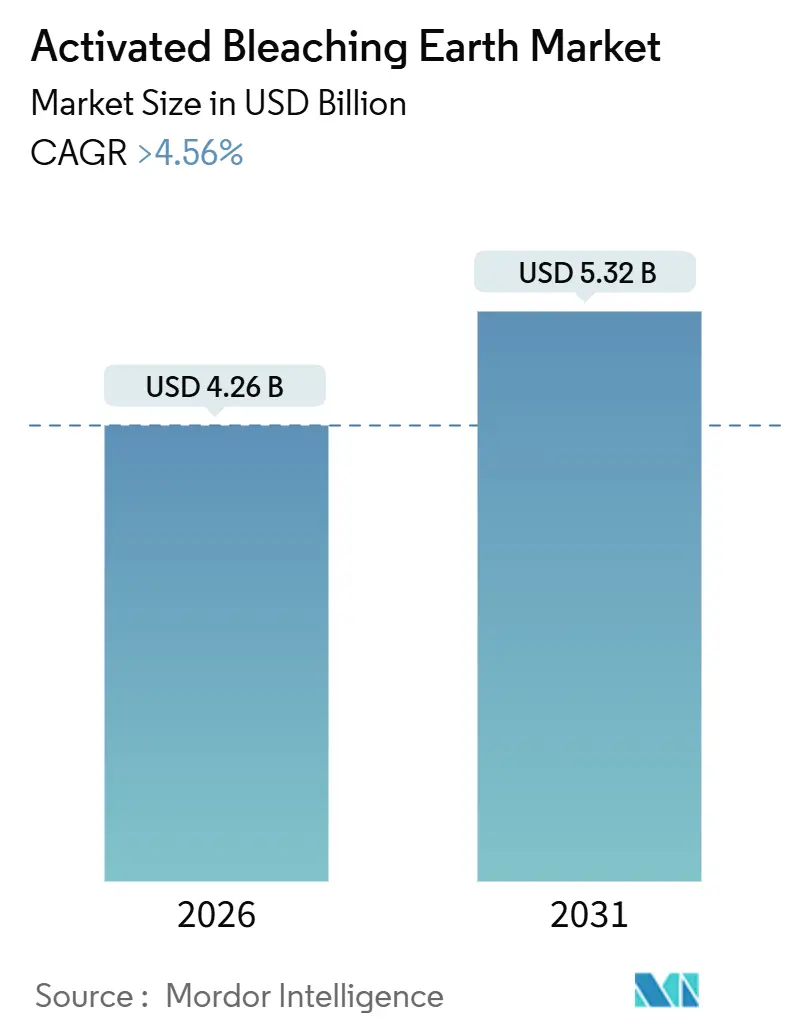
| Market Size (2026) | USD 4.26 Billion |
| Market Size (2031) | USD 5.32 Billion |
| Growth Rate (2026 - 2031) | 4.56 % |
| Fastest Growing Market | South America |
| Largest Market | Asia Pacific |
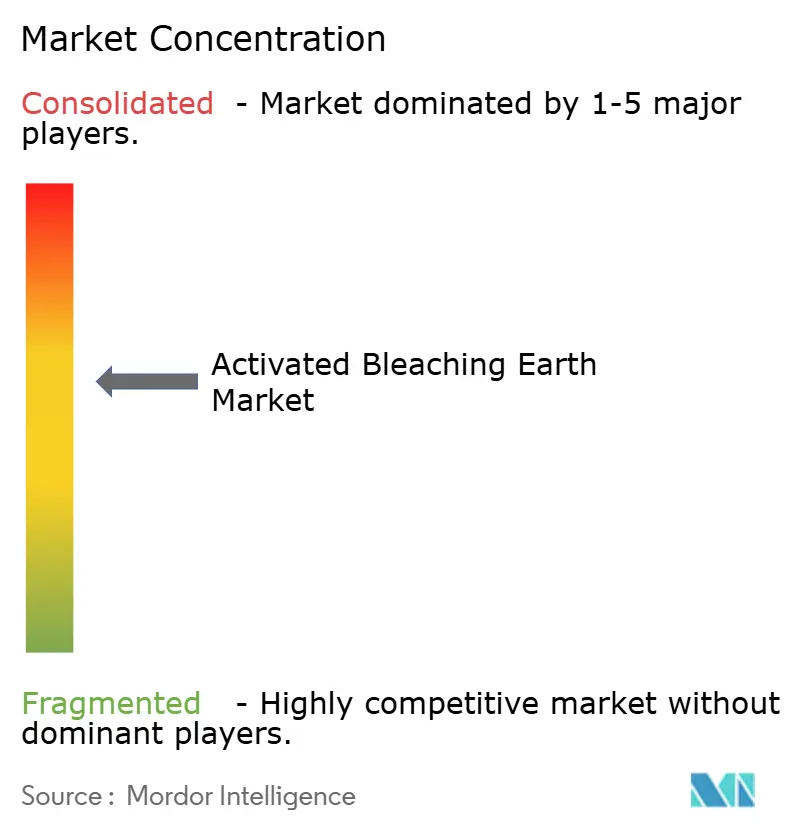
| Market Concentration | Medium |
Major Players *Disclaimer: Major Players sorted in no particular order Image © Mordor Intelligence. Reuse requires attribution under CC BY 4.0. | |
Activated Bleaching Earth Market Analysis by Mordor Intelligence
The Activated Bleaching Earth Market size is estimated at USD 4.26 billion in 2026, and is expected to reach USD 5.32 billion by 2031, at a CAGR of greater than 4.56% during the forecast period (2026-2031). This steady expansion reflects the maturation of major edible-oil refining hubs and the incremental pull from biodiesel and mineral-oil polishing applications. Cost sensitivity in palm-oil corridors, tightening 3-MCPD rules in Europe, and dosage-reduction technologies are tempering per-tonne clay volumes even as refining throughput rises[1]. In parallel, South America’s B15 mandates, growing synthetic-lubricant output in East Asia, and value-added oxalic-acid activation routes are opening new performance-driven niches. Suppliers with captive bentonite mines and low-dosage formulations are better positioned against feedstock volatility and alternative adsorbents. Overall, the Activated Bleaching Earth market is moving from pure volume play to a value-plus-compliance model built on vertical integration, technical service, and circular-economy alignment.
Key Report Takeaways
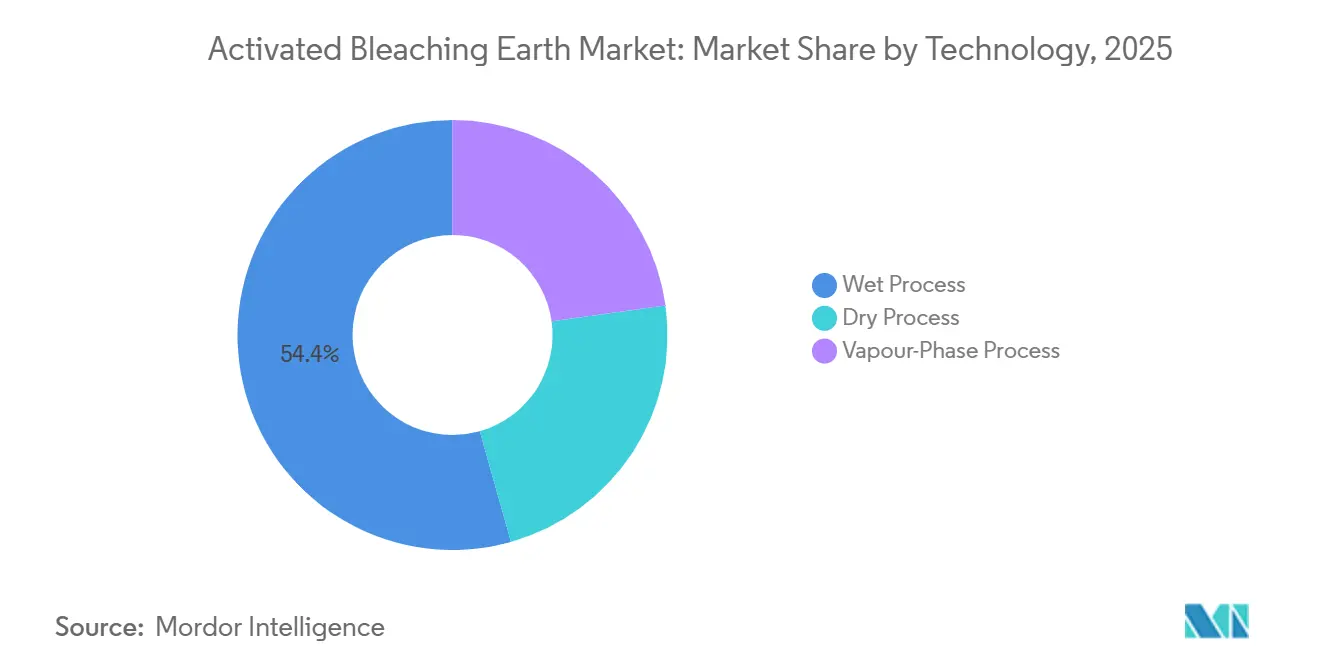
- By technology, Wet Process led with 54.38% revenue share in 2025 while Vapour-Phase Process is forecast to expand at a 5.12% CAGR through 2031.
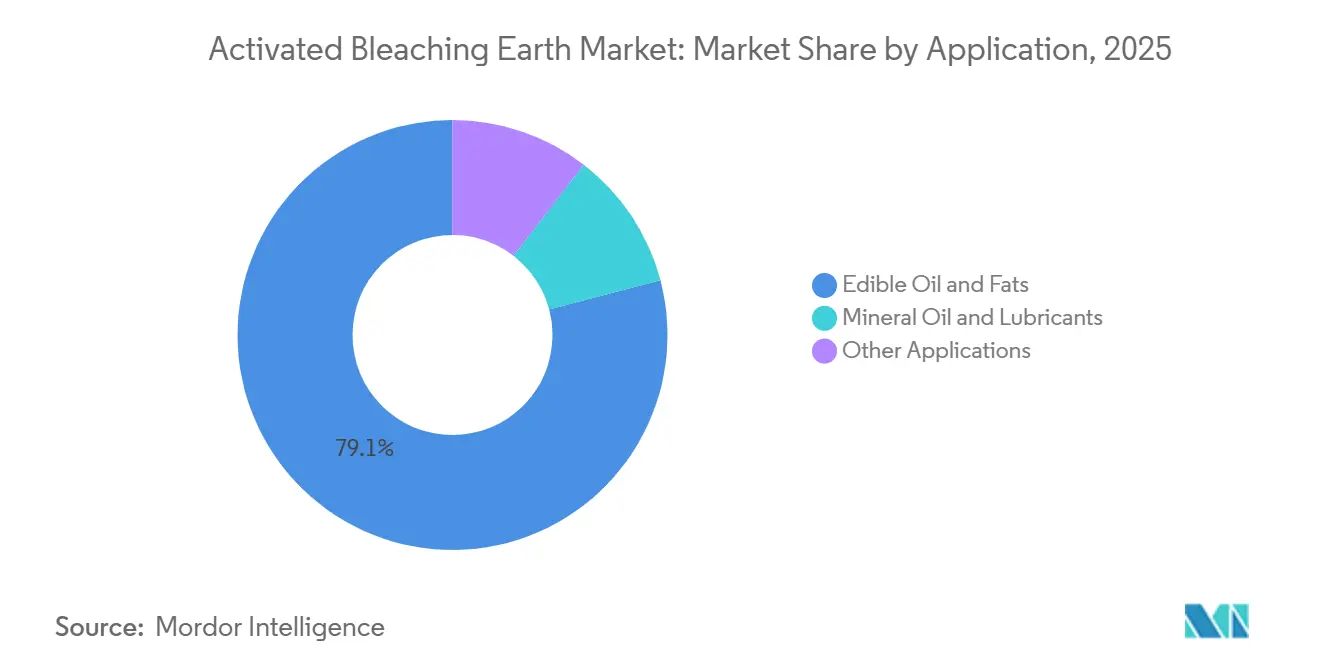
- By application, edible oil and fats accounted for 79.10% of the Activated Bleaching Earth market size in 2025 and mineral oil and lubricants are advancing at a 5.33% CAGR through 2031.
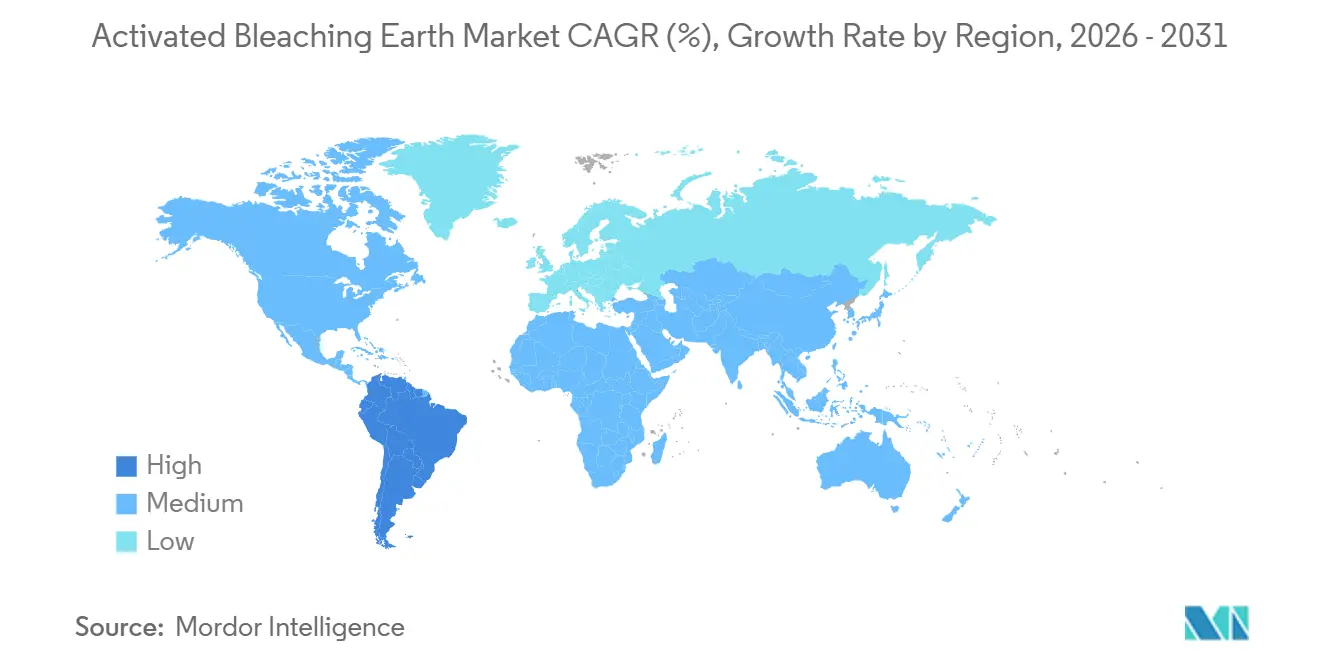
- By geography, Asia-Pacific commanded 60.12% revenue share of the Activated Bleaching Earth market in 2025 whereas South America is set to post the highest regional CAGR of 4.96% to 2031.
Note: Market size and forecast figures in this report are generated using Mordor Intelligence’s proprietary estimation framework, updated with the latest available data and insights as of January 2026.
Market Trends and Insights
Drivers Impact Analysis of Activated Bleaching Earth Market*
| Driver | (~) % Impact on CAGR Forecast | Geographic Relevance | Impact Timeline |
|---|---|---|---|
| Rising Consumption of Refined Edible Oils and Fats | +1.8% | Global, APAC core (China, India, ASEAN) | Long term (≥ 4 years) |
| Expansion of Biodiesel and Renewable Diesel Production | +1.2% | South America (Brazil, Argentina), ASEAN (Indonesia), Europe | Medium term (2-4 years) |
| Growth in Mineral Oil and Lubricant Quality Demands | +0.7% | North America, Europe, Asia-Pacific (Japan, South Korea) | Medium term (2-4 years) |
| Industrialisation Surge Across Asia-Pacific | +0.6% | APAC (India, Vietnam, Thailand, Bangladesh) | Long term (≥ 4 years) |
| Adoption of Ultrasound-Assisted Low-Dosage Bleaching | +0.3% | Global, early adopters in Europe and North America | Short term (≤ 2 years) |
| Source: Mordor Intelligence | |||
Rising Consumption of Refined Edible Oils and Fats
Global vegetable-oil throughput keeps rising, pushed by population growth and processed-food diets. Indonesia processed 47.5 million t of crude palm oil in 2024, underlining continuous clay demand in degumming and bleaching. Refiners are cutting clay dosage from 1.5-3.0% to 0.5-1.5% by adding enzymatic degumming and silica-hydrogel pre-treatments, saving up to 40% on clay while meeting color targets. This efficiency tempers volume growth but rewards suppliers offering high-activity grades that sustain lower dosages. Palm-oil’s higher carotenoid load keeps clay needs above soybean benchmarks, and World Bank data showing 6% palm-oil price gains in 2025 incentivizes plants to maximize physical refining runs.
Expansion of Biodiesel and Renewable Diesel Production
Biofuel policies keep clay demand buoyant. Indonesia’s B35 program consumed 11.96 million t of palm oil in 2024 and is preparing for B40, each step requiring double bleaching stages. Brazil’s B15 and Argentina’s export-oriented biodiesel add further pull. Hydrotreated renewable-diesel units, such as Pertamina’s 477 kl-day plant, insist on ultra-low phosphorus feedstock, often pushing bleaching earth dosage toward the 1-3% ceiling. These projects shift procurement toward high-surface-area, low-metal clays that protect hydrotreating catalysts and create premium-grade demand.
Growth in Mineral-Oil and Lubricant Quality Demands
API Group II/III base-oil producers require precise adsorption of aromatics and sulfur post-hydrotreating. Activated clays engineered for narrow pore distribution are gaining share, delivering stable viscosity indexes without stripping base-oil fractions. This segment offers margin insulation because dosage is only 0.1-0.5%, yet quality failure risks additive poisoning. Lubricant demand correlates with industrial output and fleet renewal, giving suppliers a counter-cyclical hedge when edible-oil volumes soften. Clariant’s 2025 filings cited biofuel regulation changes that dented U.S. volumes, highlighting the value of diversified end-markets[2].
Industrialization Surge Across Asia-Pacific
Mid-tier refineries in India, Vietnam, and Bangladesh are expanding to meet urban food-oil needs. India imported 16 million t of edible oil in 2025, 99.7% of palm group volumes in crude form, hinting at forthcoming domestic refining investment. Smaller plants lacking capital for membrane filtration rely heavily on activated clays as the main purification step, supporting volume resilience. Rising oleochemical capacity for fatty acids and alcohols further diversifies clay usage beyond cooking-oil streams.
Restraints Impact Analysis of Activated Bleaching Earth Market*
| Restraint | (~) % Impact on CAGR Forecast | Geographic Relevance | Impact Timeline |
|---|---|---|---|
| Availability of Alternative Adsorbents and Processes | -0.5% | Global, concentrated in Europe and North America | Medium term (2-4 years) |
| Volatile Bentonite Raw-Material Pricing and Supply | -0.4% | Global, acute in North America and China | Short term (≤ 2 years) |
| Tightening Mining/Disposal Regulation Compliance Costs | -0.3% | Europe, China, North America | Long term (≥ 4 years) |
| Source: Mordor Intelligence | |||
Availability of Alternative Adsorbents and Processes
Silica hydrogels, synthetic zeolites, and activated carbon attract premium niches such as pharmaceutical-oil and cosmetic refining. Silica-hydrogel pretreatment can trim clay dosage by 40%, while activated-carbon’s 500-1,500 m²-g surface area outperforms clay in pesticide removal. Regenerable adsorbents also cut disposal costs, pressuring clay pricing. Yet for bulk edible-oil bleaching, acid-activated bentonite still delivers the lowest cost-per-tonne outcome under GRAS and EU food additive clearances, sustaining its dominance.
Volatile Bentonite Raw-Material Pricing and Supply
The U.S. bentonite Producer Price Index climbed to 166 in 2025 from the 2007 base of 100, reflecting energy and compliance costs. Imports leapt to 94,000 t in 2023, signaling tightened domestic supply. China’s mining quotas and stricter environmental approvals further squeeze high-grade feedstock availability. Vertically integrated suppliers, such as Clariant with 60 mines worldwide, cushion margin swings, whereas standalone processors face spot-price exposure.
*Our forecasts treat driver/restraint impacts as directional, not additive. The impact forecasts reflect baseline growth, mix effects, and variable interactions.
Activated Bleaching Earth Market Segment Analysis
By Technology:
Wet Process Dominance Amid Vapour-Phase GainsWet Process technology retained 54.38% revenue in 2025, anchored in palm- and soybean-oil corridors where cost per tonne drives selection. Its unwashed, acid-activated clay yields sufficient performance for bulk refining and supports rapid supply cycles to captive refineries across ASEAN and India. Dry Process remains niche in regions with low-cost thermal energy, while Vapour-Phase is forecast to grow at 5.12% CAGR as premium applications seek surface areas exceeding 320 m²-g and minimal residual acid. The Activated Bleaching Earth market size for Vapour-Phase grades is projected to rise alongside renewable-diesel feedstock qualification. Oxalic-acid routes offer a greener path, producing biodegradable effluents and aligning with circular-economy policies, yet process optimization is vital to curb calcium-oxalate precipitation that can blunt adsorption.
Vapour-Phase adoption is escalating in pharmaceutical-oil and cosmetic bases where trace metals must stay below parts-per-million limits. Plants installing vapour-acid reactors report 15-20% lower clay consumption thanks to higher activity, though capex remains a barrier. Suppliers leveraging proprietary oxalic vapour techniques position themselves for differentiated margin capture while meeting upcoming EU waste-water norms. Consequently, the Activated Bleaching Earth market continues to bifurcate into high-performance vapour-phase niches and cost-driven wet-process volumes, with technology selection dictated by feedstock quality and compliance pressures.
By Application:
Edible Oil Refining Anchors Demand, Mineral-Oil Segment AcceleratesEdible oil and fats represented 79.10% of 2025 demand, supported by 200 million t global vegetable-oil consumption. Palm-oil’s higher carotenoid burden keeps dosage in the 1.0-3.0% band, whereas soybean and rapeseed oils use 0.5-1.5%. Dosage compression strategies—silica-hydrogel pretreatment and ultrasound-assisted bleaching—are lowering volume growth, but unit prices for premium clay grades are inching upward. EU limits on 3-MCPD are prompting refiners to favor natural or mildly activated clays, a shift that caps dosage yet drives up per-kilogram value. The Activated Bleaching Earth market share for edible-oil grades is likely to edge down as non-food niches expand, yet absolute tonnage will remain anchored here.
Mineral oil and lubricants, while smaller, are expanding at 5.33% CAGR through 2031. API Group III refiners require ultra-clean base oils, prompting 0.1-0.5% clay dosages with 30-50% price premiums. This segment stabilizes supplier revenues during agricultural downturns. Other applications—cosmetics, pharmaceuticals, wastewater—offer bespoke opportunities but demand consistent regulatory compliance and tighter particle-size control. Suppliers that can deliver traceability and technical support capture higher margins even at lower volumes.
Geography Analysis
APAC, Europe and South America Activated Bleaching Earth Market
Asia-Pacific maintained a 60.12% Activated Bleaching Earth market share in 2025, driven by 80 million t refining capacity across China, India, Indonesia, and Malaysia. Indonesia refined 47.5 million t of palm oil in 2024 and consumed 11.96 million t for B35 biodiesel, supporting twin demand streams. Export levy structures favor domestic refining, sustaining clay offtake. India’s pivot to crude palm oil imports, now 99.7% of palm group volumes, will spur local refining capex as duty gaps persist. China’s stricter mining rules are raising feedstock costs, opening import windows for Turkey and Brazil. Japan and South Korea continue to buy premium clays for pharmaceutical-oil and synthetic-lube segments, offering suppliers higher margins despite smaller volumes.
South America Activated Bleaching Earth Market
South America is the fastest-growing region at 4.96% CAGR, underpinned by Brazil’s B15 rollout and Argentina’s soybean-oil expansions. Brazilian biodiesel used 5-6 million t soybean oil in 2024, with B20 targeted by 2030, locking in clay demand for degumming and ester polishing. While enzymatic degumming trims dosage, refiners still require high-activity clay for low-phosphorus targets. Chile and Colombia are expanding edible-oil plants under import-substitution policies, contributing incremental volumes.
North America and EMEA Activated Bleaching Earth Market
North America and Europe display mature trajectories. In the United States, renewable-diesel and sustainable-aviation-fuel plants provide pockets of growth, though Q3 2025 supplier comments pointed to policy-driven volume swings. Europe’s strict 3-MCPD caps are shifting consumption toward natural clays, while ILUC rules curb palm-based biodiesel imports and promote rapeseed refining. The Middle East and Africa, though smaller, are scaling refining under food-security mandates in Saudi Arabia, Egypt, and Nigeria, creating new clay demand coupled with technical-service needs.
Regulatory Landscape
Regulation for activated bleaching earth spans food safety specifications, feed material controls, and waste handling for spent bleaching earth (SBE). In the European Union, Commission Regulation (EU) 2022/1104 (Catalogue of feed materials) is an anchor reference for feed-chain inputs where purification aids and related materials fall under composition and quality expectations, reinforcing traceability and contaminant-control requirements that shape clay selection for edible-oil and byproduct streams.
Key producing and consuming countries also maintain product standards and test methods that define purity thresholds relevant to food-contact and refining performance. China specifies requirements for food additive activated clay under GB 25571-2011, including limits on free acid and heavy metals, while national standards such as India’s BIS IS 1965:1972 (R2018) and Turkey’s TSE 1143 outline testing and quality parameters used by domestic suppliers and buyers. On the environmental side, SBE handling is increasingly regulated: Indonesia classifies spent bleaching earth as hazardous waste (code B413) under Government Regulation 101/2014 and Government Regulation 22/2021, which raises compliance and disposal obligations and encourages take-back, regeneration, and valorization pathways.
Value Chain Analysis
The value chain begins with exploration and mining of bentonite or montmorillonite-rich clays, followed by beneficiation, drying, and transport to activation sites that are often co-located near deposits to reduce inbound logistics costs. Manufacturers then acid-activate the clay (commonly using sulfuric or hydrochloric acid), with steps that can include reaction control, washing and filtration (for wet routes), drying/calcination, and grinding/classification to target particle size and porosity. Quality control relies on standardized test methods used by refiners, including surface area and performance tests referenced across ASTM and AOCS methods, to align production to edible-oil, biofuel, and mineral-oil specifications.
Downstream, activated bleaching earth is sold through direct contracts to large edible-oil refiners and renewable-fuel producers, and through distributors and agents for smaller refineries, lubricant blenders, and industrial processors. Integrated and diversified suppliers such as Clariant, Imerys, Oil-Dri, Musim Mas, and Taiko pair product development with technical service at customer sites to optimize dosage and manage filtration performance. End-of-life management for spent bleaching earth is a key late-stage node, covering collection, hazardous-waste compliant disposal in stricter jurisdictions, and emerging regeneration or oil-recovery routes that reduce disposal cost and improve circularity for refiners.
Competitive Landscape
The Activated Bleaching Earth market is moderately concentrated. Clariant, Imerys, Oil-Dri, Musim Mas, and Taiko together hold roughly 40-45% share, leaving substantial space for regional suppliers. Clariant’s 60 bentonite mines across five continents provide feedstock security and support transfer-cost advantages. Imerys’ EUR 50 million January 2025 acquisition of Chemviron’s diatomite and perlite assets broadens its filtration portfolio and signals ongoing consolidation. Product differentiation is shifting toward ultrasound-ready clays and oxalic-acid activation, both promising lower effluent toxicity and higher activity.
Asia-Pacific hosts the fiercest price competition, with small-scale Chinese and Indian producers undercutting multinationals. Clariant’s Q3 2025 results highlighted negative pricing in Asia-Pacific despite double-digit volume growth, evidencing the focus on dosage efficiency over premium grades. New entrants investing in vapour-phase reactors aim at pharmaceutical and cosmetic niches that demand uniform particle distribution and regulatory certifications. Technology services—real-time dosage monitoring, predictive maintenance of bleaching vessels—are emerging differentiators. Suppliers offering integrated clay plus analytics bundles gain stickiness and protect volumes even as per-tonne usage declines.
Spent-clay valorization is the next competitive frontier. Roughly 2 million t of spent bleaching earth containing 20-40% residual oil accumulate yearly. Pilot projects converting this residue into biodiesel or recovering fatty acids via pyrolysis are underway in Malaysia and Spain, with suppliers partnering refiners in take-back schemes. Companies that master waste-to-value pathways may capture new revenue streams while easing disposal liabilities for customers, tightening client relationships in the process.
Activated Bleaching Earth Industry Leaders
-
CLARIANT
-
Taiko Group of Companies
-
Oil-Dri Corporation of America
-
Ashapura Perfoclay Limited (APL)
-
Musim Mas Group
- *Disclaimer: Major Players sorted in no particular order
Activated Bleaching Earth Market Companies Covered in this Report
- 20 Microns Ltd
- Ashapura Perfoclay Limited (APL)
- CLARIANT
- EP Minerals
- Global Bleach Chem Pvt Ltd
- Hangzhou Yongsheng Catalyst Co., Ltd.
- HRP Industries
- Huangshan City Baiyue activated clay Co.,Ltd.
- Imerys
- Indian Clay & Mineral Co.
- Musim Mas Group
- Oil-Dri Corporation of America
- Phoenix Chemicals Pvt Ltd
- PT. Tunas Inti Bhakti Makmur (TIBM)
- Refoil Earth Pvt Ltd
- Taiko Group of Companies (Taiko Bleaching Earth Sdn. Bhd.)
- Tianyu Group's Activated Bleaching
- U.G.A. Group
Market Opportunities and Future Outlook
Compliance-driven upgrading in edible-oil refining continues to create whitespace for higher-activity, lower-residue grades that support contaminant reduction and lower-dosage operation, particularly as refiners pair bleaching with enzymatic degumming and silica-hydrogel pretreatment to meet tighter quality targets. The shift from volume-only procurement toward performance-plus-compliance is visible in Europe, where 3-MCPD constraints are influencing clay choice toward natural or mildly activated solutions, and in Asia-Pacific, where refiners are actively compressing dosage while maintaining color and impurity specifications. Suppliers that can document traceability from bentonite source to finished clay, and provide on-site optimization support, are positioned for premium pricing in these compliance-sensitive segments.
Capacity and supply-security investments around major refining hubs also point to targeted opportunity pockets. Minerals Technologies Inc. announced an investment (November 2025) in its bleaching earth plant in Usak City, Turkey, to support its Rafinol line for natural oil purification, underscoring demand for localized supply and differentiated grades near Mediterranean and EMEA trade flows. In parallel, pull from biodiesel and renewable diesel purification, including Indonesia’s B35 program and preparation steps toward higher blends, reinforces demand for low-metal, high-surface-area clays that protect downstream catalysts and align with ultra-low phosphorus feedstock requirements. Spent bleaching earth management requirements, including hazardous-waste classification in Indonesia, further expand the addressable space for regeneration services and take-back models that reduce customer disposal burden.
Recent Industry Developments in Activated Bleaching Earth Market
- February 2026: Clariant refreshed its online oil purification portfolio positioning for TONSIL activated bleaching earth used in edible oil and biofuel purification. The continued emphasis on reduced clay usage and oil-yield performance highlights suppliers' focus on dosage efficiency as refiners push toward lower consumption per tonne while meeting quality constraints.
- June 2025: Imerys completed its EUR 50 million acquisition of Chemviron’s European diatomite and perlite operations, adding three mines in France and Italy. This broadened Imerys' filtration minerals base and strengthened raw-material access for purification applications that overlap with bleaching earth demand in edible oils and industrial filtration.
- October 2024: The USDA confirmed Indonesia’s 2024 crude palm oil production at 47.5 million tons and biodiesel feedstock usage at 11.96 million tons. These figures reinforced the scale of Southeast Asia’s refining and biofuel pull-through, supporting sustained procurement of activated bleaching earth across palm-oil bleaching and downstream fuel-related polishing steps.
Activated Bleaching Earth Market Report Scope and Research Methodology
Market Definition and Coverage
For this study, the activated bleaching earth market covers the value of activated clays used as adsorbents to decolorize and purify oils during refining, across edible oils as well as mineral oil and related processing uses.
Scope exclusions: Natural (non-activated) clays, other non-clay adsorbents, and downstream refined oil values are not counted in this market.
Segments Covered in This Report
- By Technology
- Wet Process
- Dry Process
- Vapour-Phase Process
- By Application
- Edible Oil and Fats
- Mineral Oil and Lubricants
- Other Applications
- By Geography
- Asia-Pacific
- China
- India
- Japan
- South Korea
- ASEAN Countries
- Rest of Asia-Pacific
- North America
- United States
- Canada
- Mexico
- Europe
- Germany
- United Kingdom
- France
- Italy
- Spain
- NORDIC Countries
- Rest of Europe
- South America
- Brazil
- Argentina
- Rest of South America
- Middle-East and Africa
- Saudi Arabia
- South Africa
- Rest of Middle-East and Africa
- Asia-Pacific
Data Sources, Market Sizing, and Validation
Desk Research
Desk research was used to set the demand pool and the operating context for activated bleaching earth, before the model numbers were finalized. We reviewed public statistics and technical references such as FAOSTAT for edible oil production, UN Comtrade for trade flows relevant to clays and vegetable oils, and government environment and industry publications that indicate refining capacity additions and compliance requirements.
To avoid building the model on one single dataset, secondary inputs were cross-checked with sources such as peer-reviewed journals that report bleaching dosage ranges and contaminant removal requirements (for example 3-MCPD reduction practices), along with customs and port data where it was available in public form. We also relied on company filings, investor presentations, and reputable press coverage to understand capacity, plant expansions, and cost drivers. Paid subscriptions for company financials and patent databases were used selectively to clarify supplier footprints and recent process innovations. This list is illustrative, and many other public sources were also used for data collection, validation, and clarification.
Primary Interviews and Surveys
Primary work was used to convert broad indicators into usable assumptions, especially around bleaching earth dosage, pricing movements, and the split of demand across edible oil versus mineral oil uses. We spoke with participants across the supply chain, including manufacturers, distributors, and end users in refining and processing. Feedback was collected with views from APAC, EMEA, and the Americas to reduce regional bias in the final view.
Distribution of primary research fieldwork respondents
| Company type | Respondent position | Region |
|---|---|---|
| Top tier: 32% | CXOs: 18% | APAC: 41% |
| Mid tier: 50% | Functional/Unit leaders: 23% | EMEA: 34% |
| Smaller Players: 18% | Managers: 59% | Americas: 25% |
Market-Sizing & Forecasting
Market size is built using a top-down approach where edible oil refining activity and related processing volumes are reconstructed by region, then translated into activated bleaching earth consumption using dosage norms and utilization factors that are checked with experts. Since the market is value-based, the volume outlook is converted using regional average selling price bands, adjusted for grade mix and procurement patterns.
To keep the model aligned with market behavior, we track inputs such as vegetable oil production and refining throughput, share of oils that typically need bleaching, average bleaching earth dosage per ton of oil, changes in contaminant control practices (including 3-MCPD related process shifts), and freight and energy costs that influence pricing. When the main inputs were set, selective bottom-up approximations were used to test the totals, including sampled supplier revenue bands, channel checks on bulk pricing, and sanity checks against known refinery capacity additions. Where bottom-up coverage is incomplete, gaps are handled through region-level proxies based on refining intensity and expert-validated dosage ranges.
For forecasting, scenario analysis is used because demand is sensitive to edible oil output cycles, regulation-driven process changes, and price elasticity in large palm and soybean corridors. In each region, the forward view is stress-tested with optimistic and conservative assumptions on throughput growth and dosage reduction trends, before one base case is finalized.
Data Validation & Update Cycle
Before sign-off, results are triangulated against independent signals such as edible oil production trends, refinery capacity utilization cues, and observed price ranges for activated bleaching earth in key importing corridors. Variance checks are run across regions and applications so any unusual jumps are flagged, reviewed, and corrected through a second analyst pass, followed by targeted re-contacts when a key assumption shifts.
Reports are refreshed annually, and interim updates are made when material events occur, such as major capacity changes, regulation updates, or sharp input cost swings. Right before delivery, a fresh review is completed so clients receive an up-to-date view rather than an older snapshot.
Mordor Intelligence's Activated Bleaching Earth Market Sizing Compared With Other Published Estimates
Published market numbers for activated bleaching earth can differ by a wide margin, even when they appear to measure the same category. In our experience, the spread usually comes from what is counted as activated bleaching earth, which end uses are included, and how volumes are translated into values over time.
Edible oil throughput, bleaching dosage norms, and region-wise refinery activity are the validation checks that keep Mordor Intelligence's estimate tied to a clearly defined demand pool for activated bleaching earth, rather than adjacent clay and adsorbent categories. Differences also show up when one publisher uses a different base year, applies a more aggressive price escalation path, or includes a wider set of industrial uses like cosmetics and pharmaceuticals that are not always treated consistently across sources.
Benchmark comparison
| Source | Market Size | Gaps in Research Methodology |
|---|---|---|
| Mordor Intelligence | USD 4.26 B (2026) | |
| Global Consultancy A | USD 3.09 B (2025) | Uses a different base year and a broader end-use definition that can fold in additional industrial applications, which shifts the demand pool and the pricing mix used to convert volume into value. |
| Industry Analytics Firm B | USD 2.61 B (2024) | Anchors sizing to an earlier base year and leans more on high-level oil refining use statements without the same level of region-wise dosage and utilization validation, which can compress the value estimate. |
The table indicates that year selection and scope boundaries drive most of the difference, not just the growth rate itself. By linking demand to refining throughput signals and then applying transparent dosage and price band assumptions, the final number stays easier to audit and repeat when new capacity or regulation changes occur.
Key Questions Answered in the Report
What is the current value of the Activated Bleaching Earth market?
The Activated Bleaching Earth market size stood at USD 4.26 billion in 2026.
Which technology dominates Activated Bleaching Earth demand?
Wet Process technology led with a 54.38% share in 2025 due to its cost efficiency.
Why is South America the fastest-growing region?
Brazil’s B15 biodiesel mandate and Argentina’s soybean-oil expansions push regional growth at a 4.96% CAGR.
How are dosage-reduction trends affecting suppliers?
Enzymatic degumming and ultrasound-assisted bleaching are lowering per-tonne clay use, pressuring suppliers to deliver higher-activity grades.