
Activated Alumina Market Size and Share
Market Overview
| Study Period | 2020 - 2031 |
|---|---|
| Market Size (2026) | USD 1.11 Billion |
| Market Size (2031) | USD 1.44 Billion |
| Growth Rate (2026 - 2031) | 5.38 % |
| Fastest Growing Market | Asia-Pacific |
| Largest Market | Asia-Pacific |
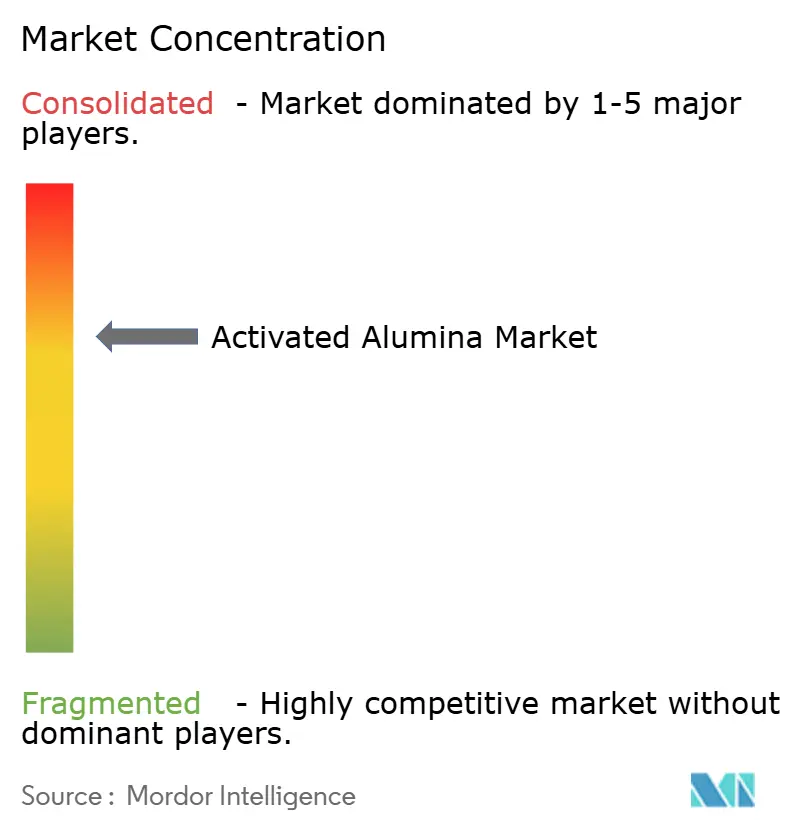
| Market Concentration | Medium |
Major Players *Disclaimer: Major Players sorted in no particular order Image © Mordor Intelligence. Reuse requires attribution under CC BY 4.0. | |
Activated Alumina Market Analysis by Mordor Intelligence
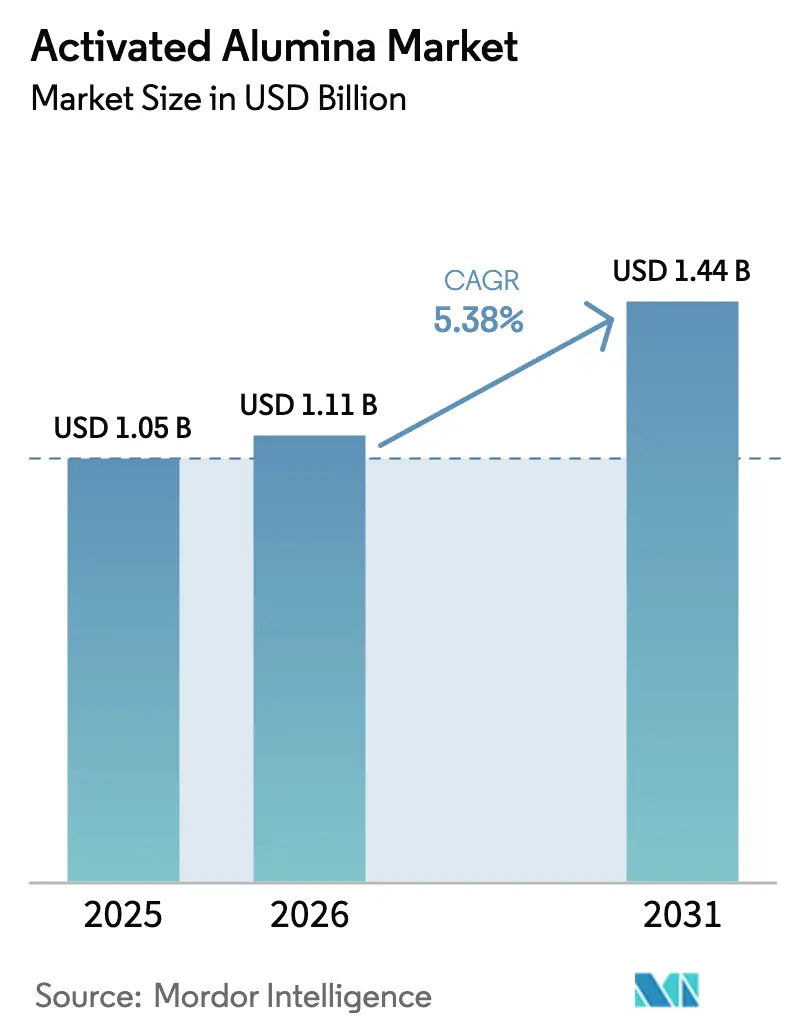
The Activated Alumina Market size was valued at USD 1.05 billion in 2025 and estimated to grow from USD 1.11 billion in 2026 to reach USD 1.44 billion by 2031, at a CAGR of 5.38% during the forecast period (2026-2031). The activated alumina market is benefiting from tightening global water-quality rules, expanding dehydration projects in energy infrastructure, and the adsorbent’s proven ability to regenerate without large capital outlays. Desiccant demand in natural-gas processing, rising use as a fluoride-removal medium, and emerging roles in lithium-ion battery separators collectively underpin steady volume growth across both mature and nascent applications. Competitive intensity remains moderate because proprietary forming and calcination techniques allow incumbents to command attractive margins even as substitute adsorbents gain attention. Supply-side risks centered on alumina feedstock price swings are beginning to ease as new refining capacity returns, yet circular-economy programs and low-temperature regeneration technologies are opening additional revenue streams that help stabilize the activated alumina market.
Key Report Takeaways
- By application, desiccant applications led with 35.12% of the activated alumina market share in 2025; adsorbent applications are projected to advance at a 5.93% CAGR through 2031.
- By end-user industry, oil and gas end users commanded 38.10% share of the activated alumina market size in 2025; while water and wastewater treatment end users are set to expand at a 6.25% CAGR between 2026 and 2031.
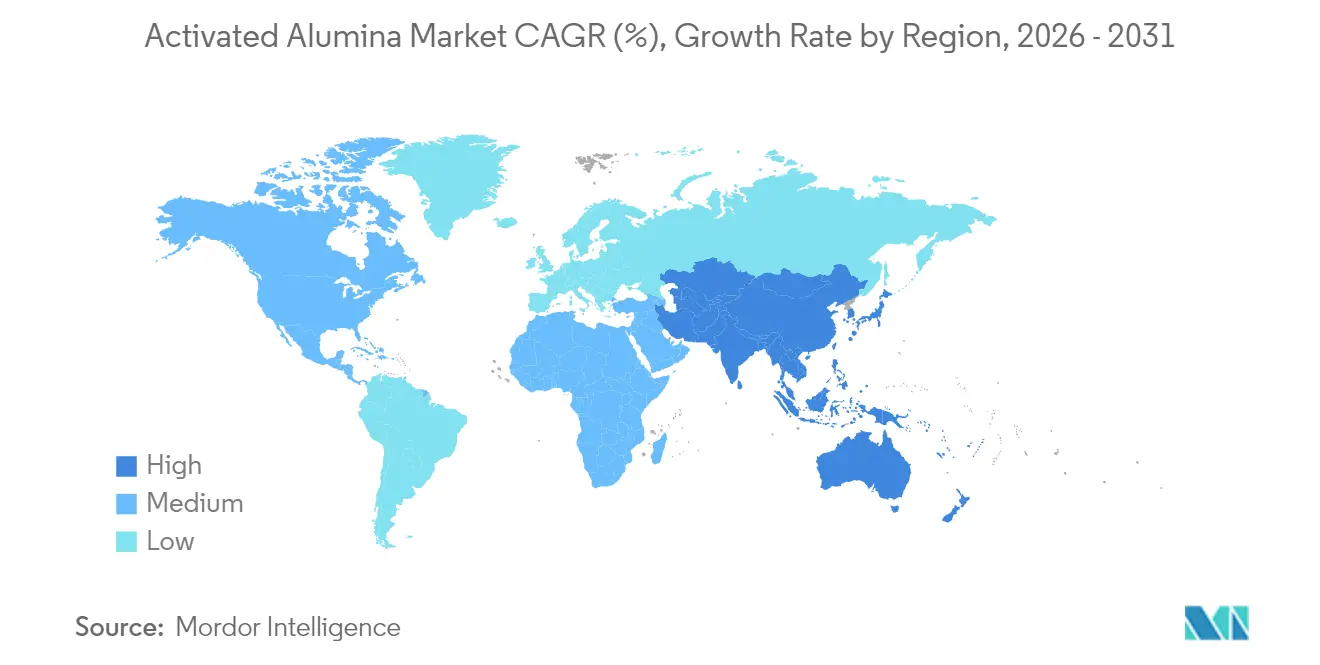
- By region, Asia Pacific captured 53.78% of the activated alumina market share in 2025 and is forecast to post a 6.31% CAGR through 2031.
Note: Market size and forecast figures in this report are generated using Mordor Intelligence’s proprietary estimation framework, updated with the latest available data and insights as of 2026.
Market Trends and Insights
Drivers Impact Analysis of Activated Alumina Market*
| Driver | (~) % Impact on CAGR Forecast | Geographic Relevance | Impact Timeline |
|---|---|---|---|
| Growing demand for fluoride-removal media in municipal water treatment | +1.2% | Global, with concentration in North America & EU | Medium term (2-4 years) |
| Expansion of natural-gas and oil-refining dehydration projects | +0.8% | APAC core, spill-over to Middle East | Long term (≥ 4 years) |
| Rising pharmaceutical catalyst and adsorbent usage | +0.6% | North America & EU, emerging in APAC | Medium term (2-4 years) |
| Integration of activated-alumina layers in Li-ion battery separators | +0.4% | APAC manufacturing hubs, global adoption | Long term (≥ 4 years) |
| Circular-economy push for regenerable adsorbents | +0.3% | Global, led by EU regulations | Medium term (2-4 years) |
| Source: Mordor Intelligence | |||
Growing Demand for Fluoride-Removal Media in Municipal Water Treatment
Regulators finalized the United States PFAS National Primary Drinking Water Regulation in April 2024, establishing maximum contaminant levels that must be met by April 2029, which has catalyzed a broader upgrade cycle for municipal treatment plants[1]. Activated alumina outperforms single-purpose media because its amphoteric surface removes both fluoride and trace heavy metals with equal efficiency. Comparative studies demonstrate seven-fold higher fluoride adsorption on micro-crystalline alumina versus traditional silica sand, while regeneration at 150 °C preserves more than 90 % capacity over multiple cycles. Utility operators gravitate toward this proven chemistry during compressed compliance windows, pushing bulk-order volumes higher between 2025 and 2029. Vendors already positioned with turnkey feed, regenerate, and instrumentation support have begun locking in framework contracts with large water districts, reinforcing visibility in the activated alumina market. Ongoing public-health funding programs in Europe and Canada provide additional upside as those regions harmonize limits on emerging contaminants.
Expansion of Natural-Gas and Oil-Refining Dehydration Projects
Moisture management remains critical for meeting ultra-low-sulfur fuel and feedstock standards, and major licensors now specify multi-bed dehydration trains that integrate activated alumina guard layers for polar contaminant removal. Axens reports that its AxSorb series achieves outlet water levels below 0.1 ppm while simultaneously scavenging light mercaptans, a dual function that reduces vessel count and capital burden. New ethane crackers and hydrogen-ready steam-methane reformers under construction in Southeast Asia select alumina-based desiccant beds because the media regenerates on-site and accommodates swing-mode operation. As distributed LNG and CNG networks proliferate across India and China, smaller skid packages require higher adsorbent volumes per throughput unit, which further lifts the activated alumina market. The long equipment life cycle and limited performance degradation over successive regenerations sustain a predictable replacement rhythm through 2030.
Rising Pharmaceutical Catalyst and Adsorbent Usage
Regulatory emphasis on continuous manufacturing drives adoption of fixed-bed reactors packed with precious-metal catalysts supported on activated alumina. The material’s high crush strength and customizable pore structure stabilize particle dispersion, leading to double-digit yield improvements in hydrogenation and dehydration steps documented by multiple peer-reviewed studies. Facilities governed by quality-by-design protocols favor a predictable support that withstands sterilization without leaching. North American manufacturers are therefore extending supply agreements with alumina specialists to secure validated batches through 2028, which stabilizes demand in an otherwise cyclic end market. Concurrently, emerging APAC contract development organizations invest in in-house catalyst regeneration units, broadening regional pull for high-surface-area alumina grades.
Integration of Activated-Alumina Layers in Li-ion Battery Separators
Research from the Royal Society of Chemistry confirms that embedding sub-micron activated-alumina particles within polyolefin separators doubles thermal stability and inhibits lithium dendrite propagation[2]. These benefits align with the electric-vehicle sector’s move toward higher-nickel cathodes, which operate nearer to safety limits. Battery-cell makers in China, Japan, and South Korea have begun pilot-line trials that incorporate thin alumina-coated separators, potentially introducing a multi-kiloton annual demand increment from 2027 onward. Unlike passive adsorption, this use case relies on ionic conductivity enhancement and therefore commands a higher price per kilogram, offering margin expansion opportunities inside the activated alumina market. Intellectual-property barriers remain low, so traditional adsorbent suppliers with calcination expertise can pivot quickly if they achieve coating uniformity at gigafactory scale.
Restraints Impact Analysis of Activated Alumina Market*
| Restraint | (~) % Impact on CAGR Forecast | Geographic Relevance | Impact Timeline |
|---|---|---|---|
| Availability of substitute adsorbents | -0.7% | Global, particularly in cost-sensitive applications | Short term (≤ 2 years) |
| Alumina feedstock price volatility | -0.5% | Global supply chain impact | Short term (≤ 2 years) |
| Emerging regulations on spent-alumina disposal and recycling | -0.4% | North America & EU, expanding globally | Medium term (2-4 years) |
| Source: Mordor Intelligence | |||
Availability of Substitute Adsorbents
Iron-oxide nanoparticles provide 70–98 % removal efficiency for several heavy metals and permit magnetic separation, delivering operational advantages in continuous-flow systems where activated alumina requires thermal regeneration. Bio-based carbon adsorbents produced from agricultural waste also show growing appeal because their mesopore distribution favors microplastic capture. Rapid scale-up in Southeast Asia and Latin America, where cost sensitivity is acute, means local utilities may trial these alternatives before considering premium alumina grades. Suppliers inside the activated alumina market therefore reposition on versatility and total-cost-of-ownership messaging rather than absolute performance. The restraint’s near-term impact is cushioned by regulatory familiarity with alumina media, yet procurement shifts in municipal bids demonstrate that price plays an outsized role when financing constraints dominate.
Alumina Feedstock Price Volatility
Benchmark smelter-grade alumina prices have exhibited double-digit swings over the past two years, driven by refinery shutdowns, energy-price spikes, and logistical bottlenecks. Although new refining lines in Indonesia and the Middle East promise extra tonnage from 2025, uncertainty lingers because commissioning delays historically exceeded twelve months for comparable assets. Activated-alumina producers without vertical integration face margin compression unless they lock in cost-pass-through clauses or broaden low-temperature synthesis routes that reduce energy inputs. Efforts such as spray-pyrolysis processing, which achieves 99 % conversion at substantially lower furnace temperatures, remain at pilot scale but signal cost-containment paths for the medium term. Until these approaches commercialize, feedstock volatility weighs on capital-expansion decisions and tempers aggressive price-cutting tactics.
*Our forecasts treat driver/restraint impacts as directional, not additive. The impact forecasts reflect baseline growth, mix effects, and variable interactions.
Activated Alumina Market Segment Analysis
By Application:
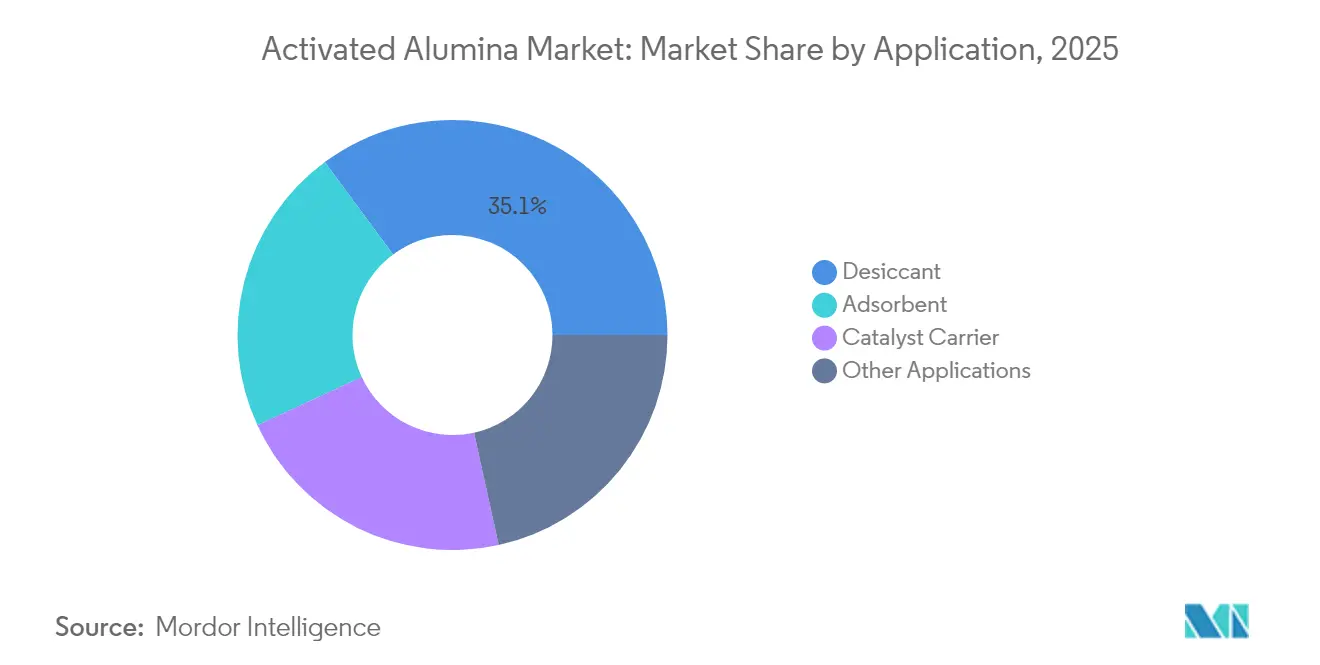
Desiccant Dominance Drives Industrial ExpansionDesiccant uses represented 35.12% of the activated alumina market size in 2025, reflecting the medium’s status as the processing standard for bulk gas dehydration. Continuous swing-bed units regenerate alumina at 200 °C, preserving over 95 % capacity after 1,000 cycles, an economic edge that fortifies long-term contracts in LNG, CNG, and refinery operations. Incremental volume now comes from hydrogen-ready gas turbines that demand stringent dew-point control, ensuring the segment sustains a low-to-mid single-digit growth rate across the forecast period. Competitive differentiation centers on tailored pore-size distribution rather than bulk density, prompting leading suppliers to invest in advanced sol-gel routes that suppress attrition.
Adsorbent applications are on track for the fastest 5.93% CAGR through 2031 as municipalities and industrial users retrofit systems to comply with emerging contaminant thresholds. Activated alumina’s regenerability keeps lifetime operating costs lower than single-use ion-exchange resins, while its amphoteric surface allows simultaneous capture of fluoride, arsenic, and selenium. Pilot installations in the Midwest United States show 85 % lower sludge disposal volumes compared with metal-salt coagulants, a sustainability advantage that policymakers view favorably. Early-stage adoption inside lithium-ion battery separator coatings adds further upside because even a 5 % penetration would equate to thousands of tons annually. Together, these dynamics ensure the activated alumina market maintains a balanced revenue mix that buffers cyclic swings in any one end use.

By End-User Industry:
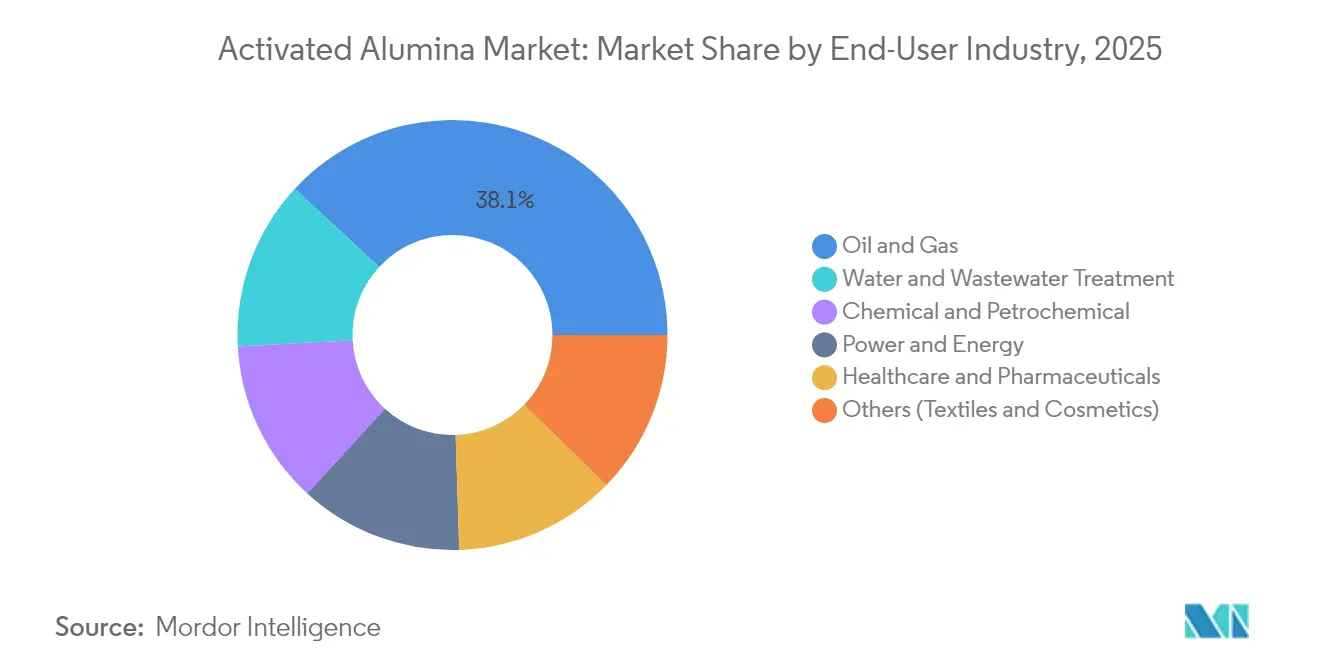
Oil & Gas Leadership Meets Water-Treatment AccelerationOil and gas operators accounted for 38.10% of the activated alumina market share in 2025, underpinned by pervasive use in dehydration and sulfur-removal trains. Stricter specifications for low-carbon fuels reinforce medium-term resilience, particularly as refineries transition toward renewable diesel and blue hydrogen that still involve moisture-sensitive steps. Catalyst-carrier demand from petrochemical complexes also channels significant tonnage because alumina’s structural stability enables high noble-metal loading at elevated temperatures.
Water and wastewater treatment exhibits the highest 6.25% CAGR heading to 2031, propelled by PFAS and fluoride directives that require multicomponent adsorption solutions. Municipalities have earmarked multi-year budgets for media replacement, accelerating tender activity in both North America and the EU. Pharmaceutical manufacturers and semiconductor fabs contribute additional orders as they replace single-pass granular activated carbon with regenerable mixed-bed systems. Across all sectors, supplier selection gravitates toward firms that offer spent-media take-back programs, an emerging differentiator in the activated alumina market.
Geography Analysis
APAC Activated Alumina Market
Asia Pacific held 53.78% of the activated alumina market share in 2025 and will likely retain pole position as CAGR reaches 6.31% through 2031. High-value projects in China’s coastal chemical parks and Southeast Asian cracker complexes require large desiccant volumes, while gigafactory build-outs across the region test alumina-coated separator films for the next generation of EV batteries. Local sourcing advantages, including proximity to bauxite deposits and integrated alumina refineries, support competitive delivered costs, ensuring that regional producers strengthen export positions to the Middle East and Africa.
North America Activated Alumina Market
North America follows with entrenched demand from natural-gas midstream assets and federally driven water-quality mandates. The PFAS rule finalized in 2024 schedules compliance by 2029, triggering a predictable spending cycle on high-capacity fluoride adsorbent beds. Advanced pilot programs in the Great Lakes region already demonstrate scalable regeneration that curbs lifecycle media consumption by up to 30%, reinforcing alumina’s cost proposition. However, planned silica-plant closures by Evonik in New York and Maryland between 2025 and 2026 point to intensified rationalization among specialty-chemical suppliers, which may tighten near-term domestic availability.
EMEA and South America Activated Alumina Market
Europe remains committed to circular-economy targets that favor regenerable adsorbents. Policy instruments such as the Industrial Emissions Directive incentivize operators to quantify life-cycle impact, which tilts procurement toward alumina over single-use resins. Investment in green alumina synthesis technologies, including low-temperature spray-pyrolysis units in Germany, signals a drive to decarbonize even specialty-chemical production. South America and the Middle East & Africa collectively add incremental volume as new gas-processing facilities and water-scarcity relief projects come online. Although their combined tonnage is modest, higher replacement rates in hard-water conditions create recurring demand that lifts the activated alumina market in these regions over time.
Mordor Intelligence provides coverage of the activated alumina market across other key regional markets, including Asia, North America, and Europe, each with their regulatory frameworks and demand patterns.
Regulatory Landscape
Activated alumina used in water and industrial applications sits at the intersection of chemicals regulation and drinking-water performance standards. In the European Union, aluminium oxide (including forms used as activated alumina) is managed under REACH registration and related CLP requirements, which drives documentation on safe handling and downstream use conditions for producers and importers supplying the region. Separately, Commission Regulation (EU) No 115/2010 permits activated alumina treatment for fluoride removal in natural mineral and spring waters, tying commercialization to leaching-test compliance requirements (for example, EN 12902) and an aluminum release limit (200 ug/L) to protect water quality. In the United States, the EPA Drinking Water Treatability Database recognizes activated alumina as a Best Available Technology (BAT) for fluoride and arsenic removal, supporting its continued use in municipal treatment design and procurement frameworks.
Policy attention on fluoride also increased after a November 2024 federal court decision under TSCA, which elevated scrutiny of fluoride exposure, with rulemaking activity extending through 2025 and 2026. This backdrop can affect the pace and specifications of water-treatment upgrades and media selection. Across markets, emerging requirements on spent-media disposal and recycling add compliance steps for utilities and industrial users, encouraging suppliers that can pair product sales with take-back, regeneration, or documented end-of-life pathways.
Value Chain Analysis
The value chain starts with upstream bauxite mining and Bayer-process refining to aluminum hydroxide and alumina, with activated-alumina producers exposed to feedstock pricing and energy costs. Manufacturing typically includes controlled calcination (commonly in the 400-700 degrees C range) to develop porosity, followed by forming (extrusion or bead/oil-drop routes), drying, and final calcination to reach target surface area, pore volume, and crush strength. Product differentiation is created in the midstream step through proprietary forming, pore engineering, and quality control aligned to industrial specifications; standards such as IS 9700:2025 provide a reference point for performance criteria used in procurement for industrial grades.
Downstream, activated alumina moves through direct sales to large oil and gas, refining, and municipal accounts, and through distributors and system integrators supplying packaged dehydration skids and water-treatment vessels. Major global suppliers include BASF, Honeywell UOP, Axens, Evonik Industries, Sumitomo Chemical, and Huber Engineered Materials, with Asia-Pacific (notably China) representing a large production base and export source. Key bottlenecks and cost levers include consistent access to high-quality feedstock, energy-intensive calcination capacity, and logistics to deliver heavy bulk media. Customer requirements around safety communication (for example, OSHA hazard communication in the United States) and TSCA reporting add documentation overhead that tends to favor established suppliers with compliance and technical-service infrastructure.
Competitive Landscape
The activated alumina market features moderate concentration: the top five producers control roughly 65% of global capacity, leaving room for regional challengers. BASF, Honeywell UOP, Evonik, and W. R. Grace compete mainly on proprietary forming and calcination techniques that yield differentiated pore architectures. BASF’s oil-drop Sorbead process delivers superior hydrothermal stability, enabling over 40 % longer service intervals for refinery dryers. Honeywell integrates digital twins to optimize cycle timing, cutting energy use during adsorption–regeneration swings.
Strategic asset optimization continued in 2025 when Evonik announced the phased closure of its Waterford and Havre de Grace silica plants to consolidate output at higher-efficiency hubs, freeing capital to expand specialty alumina grades for water treatment and battery separators. Meanwhile, Chinese producers leverage cost-competitive feedstock and short supply chains to supply both domestic and export markets, narrowing delivered-price gaps in Southeast Asia. Technology partnerships between Western licensors and Asian toll manufacturers are emerging to ensure quality consistency, indicating a hybrid model rather than outright commoditization.
Innovation remains a key defense as substitute adsorbents gain visibility. The Korea Institute of Energy Research demonstrated a low-temperature regeneration method that halves energy consumption for alumina-based beds, offering customers clear operational savings once commercialized. Suppliers also invest in life-cycle management services by bundling spent-media recycling and performance monitoring software. These value-added packages raise switching costs, shoring up margins within the activated alumina market even when spot prices for raw alumina fluctuate.
Activated Alumina Industry Leaders
-
Axens
-
Huber Engineered Materials
-
Evonik Industries AG
-
Honeywell International
-
BASF
- *Disclaimer: Major Players sorted in no particular order
Activated Alumina Market Companies Covered in this Report
- AGC Chemicals
- Arkema
- Axens
- BASF
- Clariant
- Dynamic Adsorbents Inc.
- Evonik Industries AG
- Hindalco Industries Ltd.
- Honeywell International
- Huber Engineered Materials
- Jiangsu Jingjing New Material
- KIN Filter Engineering
- Petrosadid
- Porocel (Evonik)
- Sorbead India
- Sumitomo Chemical Co. Ltd.
- W. R. Grace and Co.
- Zeochem AG
Market Opportunities and Future Outlook
Water and wastewater treatment remains a central whitespace for activated alumina, where utilities need media that can address multiple contaminants with regenerability. In the United States, EPA recognition of activated alumina as BAT for fluoride and arsenic removal supports continued specification in public drinking-water systems, while municipal upgrade cycles tied to tightening contaminant requirements keep procurement focused on proven adsorption media. In Europe, the established pathway for using activated alumina in mineral and spring waters under Commission Regulation (EU) No 115/2010 (with leaching-test compliance such as EN 12902) reinforces demand for certified grades with controlled impurity and leachability profiles.
Industrial opportunities are expanding in high-performance dehydration and purification niches where customized pore structure, attrition resistance, and regeneration energy matter more than commodity pricing. Suppliers are using tailored grades for PSA/TSA systems and biogas upgrading, alongside advanced catalyst-carrier and separator-coating concepts that reward tighter impurity control and particle engineering. The 2025 acquisition of AluChem Companies Inc. by Hindalco reflects strategic interest in specialty alumina capabilities, and it supports a broader push toward differentiated, application-specific activated alumina offerings rather than undifferentiated bulk media.
Recent Industry Developments in Activated Alumina Market
- May 2026: Axens highlighted the performance positioning of its AxSorb D activated alumina for biogas drying and siloxanes removal, including suitability for TSA and PSA configurations. The communication reinforces a shift toward specialized renewable-gas purification use cases where media performance and cycle efficiency drive vendor selection.
- November 2025: Zibo Yuanyu New Materials launched an upgraded high-performance activated alumina line for water treatment, citing higher surface area (over 340 m2/g) and improved crush resistance. The update targets municipal and industrial operators seeking longer service life and more robust media under frequent regeneration and variable water chemistry.
- June 2024: In a strategic acquisition, J.M. Huber Corporation completed its purchase of Active Minerals International, integrating the business into Huber Specialty Minerals within Huber Engineered Materials. The deal strengthens Huber's portfolio in specialty minerals and expands its platform for serving adsorption, filtration, and related end markets that overlap with activated alumina applications.
Activated Alumina Market Report Scope and Research Methodology
Market Definition and Coverage
For this study, the activated alumina market covers revenue generated from the sale of activated alumina products used mainly as adsorbents, desiccants, and catalyst supports across industrial and municipal use cases.
Scope exclusions: We exclude upstream alumina refining and mining, along with substitute adsorbents such as activated carbon, silica gel, zeolites, and ion-exchange resins.
Segments Covered in This Report
- By Application
- Adsorbent
- Desiccant
- Catalyst Carrier
- Other Applications
- By End-User Industry
- Oil and Gas
- Water and Wastewater Treatment
- Chemical and Petrochemical
- Healthcare and Pharmaceuticals
- Power and Energy
- Others (Textiles and Cosmetics)
- By Geography
- Asia-Pacific
- China
- Japan
- India
- South Korea
- ASEAN Countries
- Rest of Asia-Pacific
- North America
- United States
- Canada
- Mexico
- Europe
- Germany
- United Kingdom
- France
- Italy
- Spain
- Russia
- NORDIC Countries
- Rest of Europe
- South America
- Brazil
- Argentina
- Rest of South America
- Middle East and Africa
- Saudi Arabia
- South Africa
- Rest of Middle East and Africa
- Asia-Pacific
Data Sources, Market Sizing, and Validation
Desk Research
Desk research was used to set the boundary of what is counted as activated alumina and to anchor the demand drivers that typically move pricing and volumes. We relied on public sources such as USGS mineral statistics, UN Comtrade trade flows, World Bank and IMF macro indicators, and environmental agency publications (for water treatment standards and fluoride limits) to map where demand is structurally higher.
We also reviewed company annual reports, investor presentations, import and export disclosures, and reputable press coverage to spot capacity additions, plant shutdowns, and supply tightness that can show up as price movements. When needed, paid subscription data for shipment-level import and export records, and another for company financials and news, were used to cross-check regional flow patterns and to confirm whether a supplier is meaningfully exposed to activated alumina. These desk research references are illustrative only, and other sources were also used for data collection, validation, and clarification during the work.
Primary Interviews and Surveys
Primary work focused on validating how activated alumina is bought and sold, and what really drives consumption in water treatment, oil and gas drying, and catalyst support. We spoke with manufacturers, distributors, and end users so that price realization, typical contract lengths, and substitution behavior could be reflected in the model. Coverage was balanced across major consuming regions, and follow-ups were done where desk inputs did not align with what market participants were seeing on the ground.
Distribution of primary research fieldwork respondents
| Company type | Respondent position | Region |
|---|---|---|
| Top tier: 32% | CXOs: 13% | APAC: 43% |
| Mid tier: 50% | Functional/Unit leaders: 40% | EMEA: 37% |
| Smaller Players: 18% | Managers: 47% | Americas: 20% |
Market-Sizing & Forecasting
The sizing starts with a top-down build where global demand is reconstructed from the main end-use pools that consistently consume activated alumina, and then allocated by region based on industrial activity and water treatment needs. To keep the totals realistic, we corroborate results with selective bottom-up approximations, including supplier revenue exposure checks, sampled pricing for common bead and granular grades, and region-level volume reasonableness tests.
Key inputs that guide the model include municipal and industrial water treatment spending direction, adoption of fluoride and arsenic removal media, natural gas processing and pipeline drying activity, refinery and petrochemical operating rates, and observed import and export movements for alumina-based adsorbents. Pricing is treated carefully because this market can shift with alumina feedstock conditions, energy costs, and logistics, and these signals were discussed with interviewees to avoid assuming a straight-line ASP rise.
Forecasts are developed using scenario analysis supported by a small set of leading indicators, then adjusted based on expert views on capacity additions, regulation-driven water projects, and refinery turnaround cycles. Where bottom-up checks leave gaps, the model uses transparent proxies like regional demand shares from trade and production signals, followed by a re-check against the interview-led view of which applications are growing faster.
Data Validation & Update Cycle
Outputs are validated by comparing modeled values against independent signals, including trade flows, end-use production trends, and whether implied pricing sits inside a realistic band discussed in interviews. Variances are reviewed in multiple steps, and when a number looks out of line for a region or application, assumptions are reopened and respondents may be re-contacted to clarify what changed.
Each report is refreshed annually, and interim updates are made when material events occur, such as a major capacity expansion, a sudden feedstock cost shift, or a policy change affecting water treatment adoption. Before delivery, the latest public releases and news are checked again so clients receive a current view rather than an older snapshot.
Mordor Intelligence's Activated Alumina Market Sizing Compared With Other Published Estimates
Published market sizes for activated alumina do not always match because the boundary of what is counted can shift, and because different studies anchor demand to different end-use signals. The year used as the starting point also matters, since pricing and volumes can move in opposite directions during cost swings.
By tracking application-level demand indicators and refreshing price assumptions with trade checks and interview feedback, Mordor Intelligence places the market in 2026 at a point where water treatment, gas drying, and catalyst support are counted only when activated alumina is the primary purchased material, which reduces double counting with broader alumina and adsorbent baskets.
Benchmark comparison
| Source | Market Size | Gaps in Research Methodology |
|---|---|---|
| Mordor Intelligence | USD 1.11 B (2026) | |
| Industry Publisher A | USD 1.26 B (2025) | Uses a 2025 base year and often applies broader pricing and demand assumptions across air purification and adjacent alumina adsorbents, which can lift the value when substitutions are not separated tightly. |
| Global Consultancy B | USD 1.09 B (2026) | Runs a longer forecast window and presents overlapping starting values across sections, and its inclusion notes suggest a wider set of use cases, which can shift comparability depending on which definition is applied. |
The spread is mainly explained by scope boundaries, base year choice, and how pricing is carried forward for common bead and granular grades. When the definition is kept tight and the demand pool is tied back to observable industrial and water treatment signals, the resulting market total becomes easier to repeat and to audit over time.
Key Questions Answered in the Report
What is the current Activated Alumina Market size?
The activated alumina market size is USD 1.11 billion in 2026 and is projected to reach USD 1.44 billion by 2031.
Which application segment dominates the activated alumina market?
Desiccant applications dominate, accounting for 35.12% of global revenue in 2025.
Why is Asia Pacific leading the activated alumina market?
Asia Pacific benefits from integrated alumina refining, rapid industrialization, and strong demand in natural-gas dehydration and municipal water treatment, giving it a 53.78% share in 2025.
What growth rate is expected for water-treatment end users?
Water and wastewater treatment end users are forecast to register a 6.25% CAGR through 2031, making them the fastest-growing customer group.