
Acrylic Resin Market Size and Share
Market Overview
| Study Period | 2020 - 2031 |
|---|---|
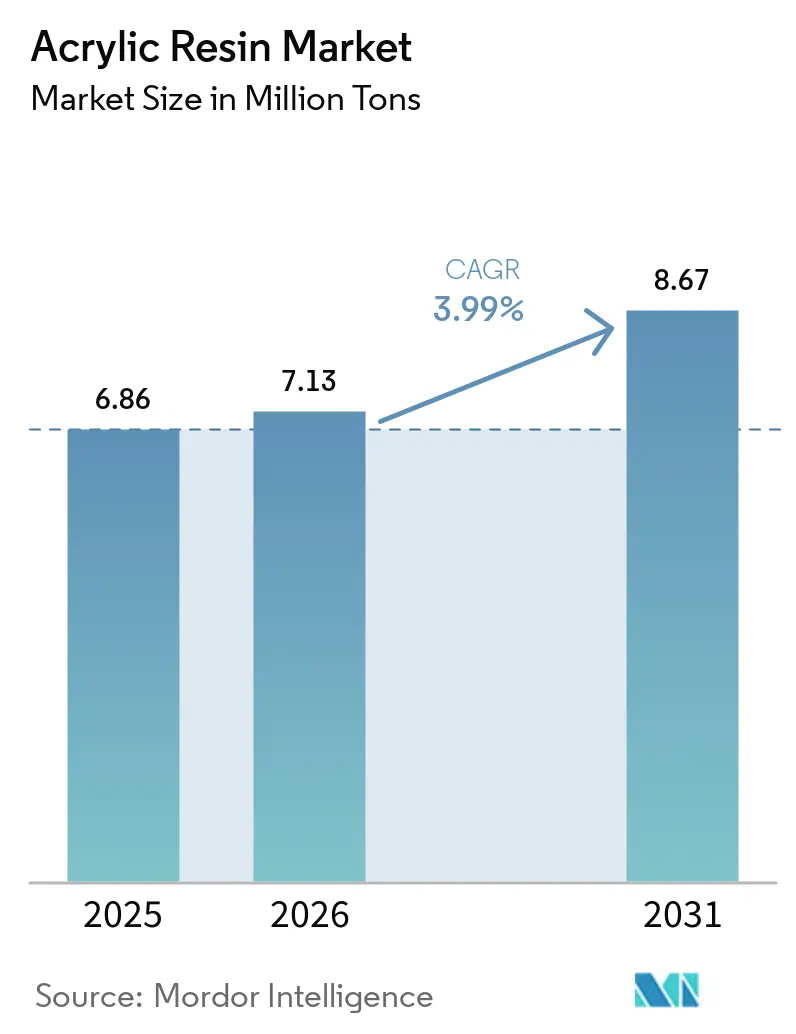
| Market Volume (2026) | 7.13 Million tons |
| Market Volume (2031) | 8.67 Million tons |
| Growth Rate (2026 - 2031) | 3.99 % |
| Fastest Growing Market | Asia Pacific |
| Largest Market | Asia Pacific |
| Market Concentration | Medium |
Major Players *Disclaimer: Major Players sorted in no particular order Image © Mordor Intelligence. Reuse requires attribution under CC BY 4.0. | |
Acrylic Resin Market Analysis by Mordor Intelligence
The Acrylic Resin Market size is expected to grow from 6.86 million tons in 2025 to 7.13 million tons in 2026 and is forecast to reach 8.67 million tons by 2031 at 3.99% CAGR over 2026-2031. This steady expansion reflects the material’s entrenched role in construction, automotive, and diversified industrial settings where performance requirements increasingly favor acrylic formulations over traditional resins. Momentum is reinforced by tightening low-VOC regulations that spur adoption of waterborne systems, while 3D-printing photopolymer demand adds a premium layer of growth. Supply-side responses include backward integration into feedstocks and a pivot to bio-based ethyl acrylate to hedge raw-material volatility. Competitive activity is intensifying as producers pursue capacity additions, strategic acquisitions, and circular-economy initiatives to secure long-term positioning.
Key Report Takeaways
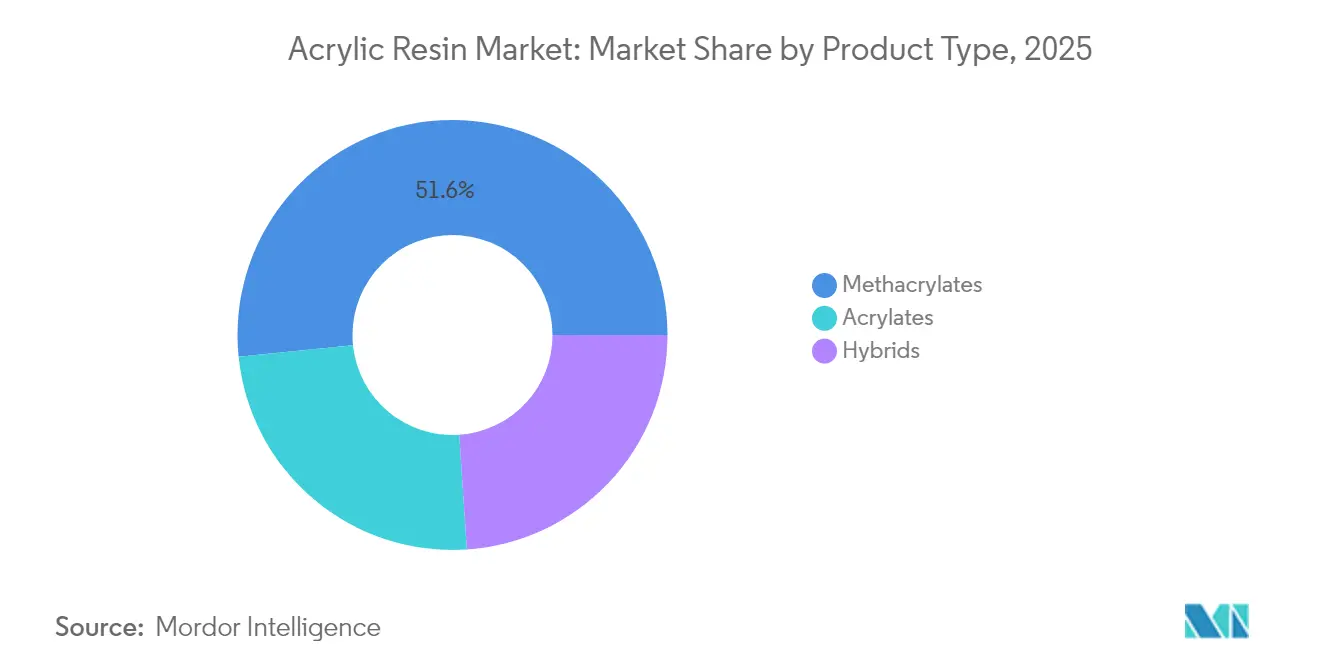
- By product type, methacrylates led with 51.62% of acrylic resin market share in 2025; acrylates are forecast to expand at a 5.18% CAGR through 2031.
- By application, paints and coatings commanded a 46.02% share of the acrylic resin market size in 2025, while adhesives and sealants are projected to grow at a 5.27% CAGR through 2031.
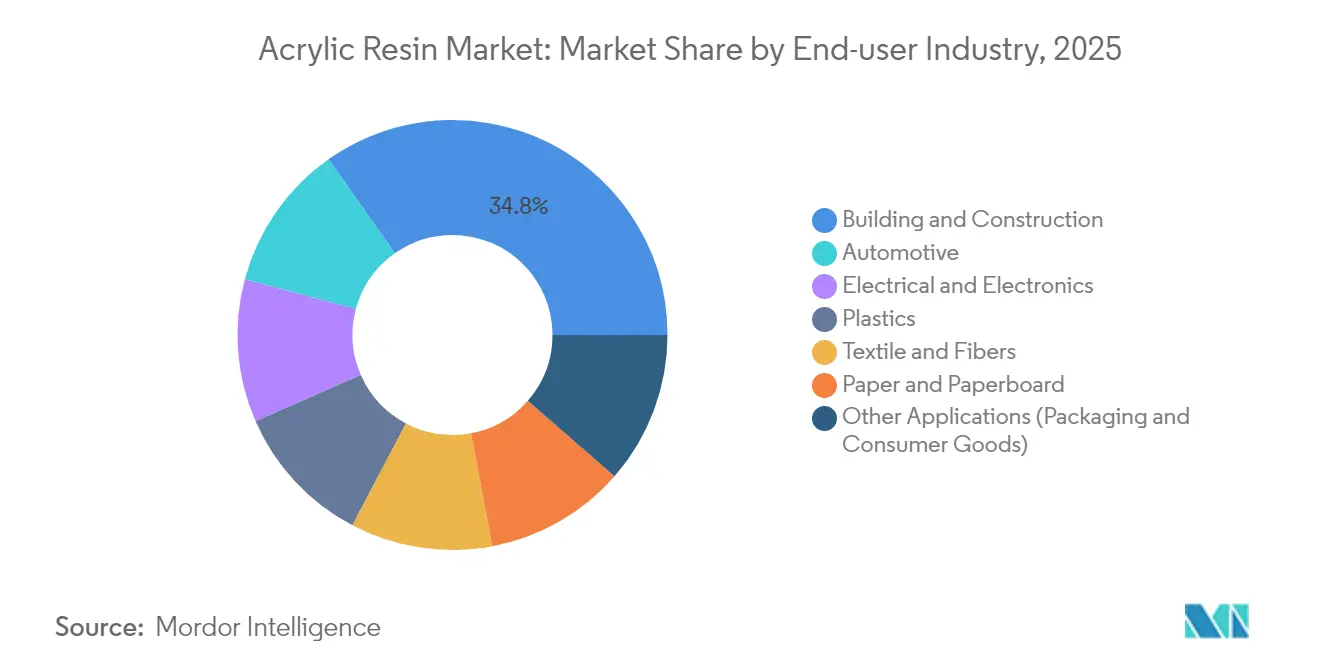
- By end-user industry, building and construction captured 34.78% of demand in 2025; automotive applications are advancing at a 5.47% CAGR to 2031.
- By geography, Asia-Pacific accounted for 50.96% of the acrylic resin market in 2025 and is expanding at a 5.57% CAGR over the forecast period.
Note: Market size and forecast figures in this report are generated using Mordor Intelligence’s proprietary estimation framework, updated with the latest available data and insights as of 2026.
Market Trends and Insights
Drivers Impact Analysis of Acrylic Resin Market*
| Drivers | (~) % Impact on CAGR Forecast | Geographic Relevance | Impact Timeline |
|---|---|---|---|
| Expansion in construction and infrastructure activities | +1.2% | Global, with concentrated impact in Asia-Pacific and emerging markets | Medium term (2-4 years) |
| Rising demand for lightweight automotive components | +0.8% | North America, Europe, Asia-Pacific automotive corridors | Long term (≥ 4 years) |
| Increasing consumption of low-VOC waterborne coatings | +0.7% | North America and EU regulatory zones, expanding to Asia-Pacific | Short term (≤ 2 years) |
| Rapid adoption of 3D-printing photopolymer resins | +0.6% | North America, Europe, with emerging adoption in Asia-Pacific | Medium term (2-4 years) |
| Growth of smart/self-healing coating technologies | +0.4% | Global, with early adoption in aerospace and marine applications | Long term (≥ 4 years) |
| Source: Mordor Intelligence | |||
Expansion in Construction and Infrastructure Activities
Global construction recovery underpins consistent acrylic resin market growth, with multi-year infrastructure programs in China, India, and the United States translating into rising coatings and panel demand. Project developers increasingly specify acrylic surface coating to meet green-building criteria, elevating consumption across exterior and interior applications. Formaldehyde-free binder technologies such as BASF’s Acrodur systems further strengthen market pull by aligning with indoor-air-quality standards. Overall, infrastructure spending assures a visible demand pipeline that anchors the acrylic resin market amid cyclical end-uses.
Rising Demand for Lightweight Automotive Components
Electrification accelerates lightweighting imperatives, and acrylic resins enable mass reduction across glazing, body panels, and battery enclosures. Collaborative product development, for example, Honda and Mitsubishi Chemical’s pre-colored PMMA parts, removes paint steps while lowering lifecycle CO₂ emissions by 50%. Regulatory fuel-economy targets in Europe and the United States guarantee long-run demand for high-strength, low-density polymers. Electric-vehicle battery housings further require thermal stability and dimensional accuracy, properties well served by methacrylate grades. Coupled with autonomous-vehicle sensor needs for optical clarity, these factors sustain premium volumes within the acrylic resin market.
Increasing Consumption of Low-VOC Water-Borne Coatings
Rule-making by the California Air Resources Board and Canada’s 2024 VOC limits is accelerating reformulation toward waterborne acrylics[1]. Manufacturers with compliant portfolios are securing share gains as industrial buyers pivot to safer chemistries. Water-borne systems also deliver durability and color retention benefits, boosting their value proposition beyond compliance alone. Investment in global ISCC+-certified lines enables firms such as BASF to market low-PCF acrylics with verified chain-of-custody attributes. The short-term conversion cycle positions the acrylic resin market for notable volume lifts through 2027 while permanently shifting the competitive baseline toward eco-efficient offerings.
Rapid Adoption of 3D-Printing Photopolymer Resins
High-resolution vat-polymerization processes depend on fast-curing, mechanically robust acrylic formulas. Academic research into recyclable, renewable lipoate-based resins demonstrates ongoing progress toward closed-loop photopolymers. Production-scale techniques such as continuous liquid interface production raise resin throughput, magnifying volume requirements. As aerospace and medical sectors migrate prototypes into certified production parts, they open an enduring premium niche inside the acrylic resin market.
Restraints Impact Analysis of Acrylic Resin Market*
| Restraints | (~) % Impact on CAGR Forecast | Geographic Relevance | Impact Timeline |
|---|---|---|---|
| Environmental and health hazards of acrylates | -0.9% | Global, with heightened scrutiny in North America and Europe | Short term (≤ 2 years) |
| Volatile propylene and MMA feed-stock prices | -1.1% | Global, with particular impact on integrated producers | Medium term (2-4 years) |
| Competition from bio-based polymer alternatives | -0.6% | Europe and North America leading, expanding globally | Long term (≥ 4 years) |
| Source: Mordor Intelligence | |||
Environmental and Health Hazards of Acrylates
Regulators continue to evaluate exposure risks, tightening permissible monomer concentrations in manufacturing and consumer products. Enhanced ventilation, monitoring, and personal protective equipment raise compliance costs across the acrylic resin industry. Consumer awareness of VOC and odor profiles influences purchasing choices, particularly in residential coatings. Safety-driven brand differentiation is, therefore, necessary but costly for producers. Ongoing toxicology studies aim to substantiate safe-use thresholds, yet lingering perception risks cap adoption where substitute resins exist.
Volatile Propylene and MMA Feed-Stock Prices
Feedstock cost swings produce margin compression, with US propylene forecast to rise 5 cents per pound through mid-2025 amid constrained refinery capacity. Integrated majors partially offset volatility through captive production, whereas merchant participants rely on hedging tools that may be unavailable or uneconomic. Unpredictable input costs slow customer contract negotiations and can delay project approvals, moderating near-term acrylic resin market growth.
*Our forecasts treat driver/restraint impacts as directional, not additive. The impact forecasts reflect baseline growth, mix effects, and variable interactions.
Acrylic Resin Market Segment Analysis
By Product Type:
Methacrylates Lead While Acrylates AccelerateMethacrylates retained a 51.62% acrylic resin market share in 2025 thanks to their optical clarity and weatherability, but acrylates are on track for a 5.18% CAGR through 2031 as bio-based chemistries broaden their usage window. In volume terms, methacrylate grades serve glazing, signage, and premium coatings, anchoring the upper tier of the acrylic resin market. Acrylate polymers, propelled by adhesive and flexible-coating demand, capitalize on lower cost and easier processability, gaining ground in emerging applications. LG Chem’s roll-out of fully plant-derived acrylic acid illustrates how sustainability attributes are pulling customers toward acrylate variants.
Industry initiatives around chemical recycling are narrowing the performance gap between virgin and recovered methacrylates. Mitsubishi Chemical’s microwave-assisted depolymerization of post-consumer PMMA back to MMA monomer promises circular-economy compliance without sacrificing material quality. Advancements in catalyst architectures and reactor design further enhance throughput and property control across both product families, sharpening competitive differentiation.

By Application:
Coatings Dominance Challenged by Adhesive GrowthPaints and coatings represented 46.02% of the acrylic resin market size in 2025, remaining the anchor application due to requirements for color retention, UV stability, and compliant VOC profiles. Interior architectural, industrial OEM, and protective marine segments rely heavily on waterborne acrylics to meet evolving standards. Nonetheless, adhesives and sealants will outpace coatings at a 5.27% CAGR to 2031 as construction recovery, e-commerce packaging, and automotive assembly boost demand for high-performance bonding agents. Acrylic structural adhesives offer fast cure, durability, and substrate versatility, making them indispensable in lightweight composite joining.
By End-User Industry:
Construction Leadership Amid Automotive AccelerationBuilding and construction retained 34.78% demand in 2025, driven by roof coatings, sealants, and decorative finishes tailored for energy-efficient structures. Infrastructure megaprojects in Asia-Pacific and stimulus-backed renovation programs in the European Union combine to create a resilient consumption backbone. Automotive is the fastest-moving end-user, expected to post a 5.47% CAGR through 2031 as electric-vehicle production scales and lightweight composite parts multiply. Acrylic grades find homes in battery enclosures, glazing units, and textured interior trims, replacing heavier metal and glass.
The electrical and electronics vertical benefits from 5G rollouts, where acrylic encapsulants deliver insulation alongside miniaturization tolerance. Textile and fiber finishes, though mature, increasingly prioritize bio-based or recycled content, creating incremental pull for greener acrylic formulations. Paper and board coatings are stabilizing due to e-commerce shipping volumes that require scuff-resistant, printable surfaces. Cross-industry synergies emerge as high-temperature automotive resins transfer into construction panels demanding improved thermal cycling endurance, underscoring the interconnected growth pathways within the acrylic resin market.
Geography Analysis
APAC Acrylic Resin Market
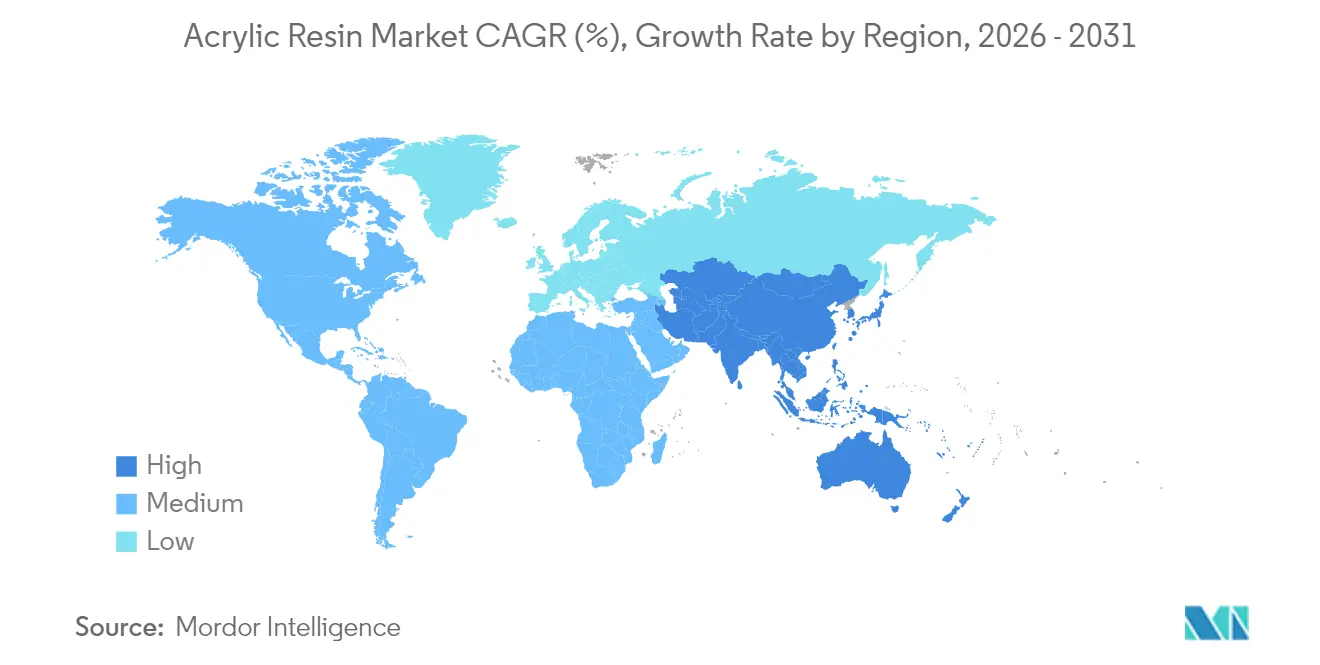
Asia-Pacific held 50.96% of global volume in 2025 and is positioned for a 5.57% CAGR through 2031, reflecting the region’s dual role as a manufacturing hub and rising consumption center. China continues to prioritize megainfrastructure investment, stimulating coatings and sealants uptake across transport, energy, and residential projects. Japan’s advanced automotive and electronics clusters carve out demand for premium methacrylate grades with tight optical and mechanical tolerances.
North America and Europe Acrylic Resin Market
North America and Europe operate as technology and regulation leaders. The EPA’s revised aerosol-coating VOC rule grants a compliance grace period to 2027, yet still locks in a trajectory toward low-emission acrylic chemistries. European industry is channeling capital into chemical-recycling pilots and ISCC+ certified supply chains, reinforcing a premium on traceable low-PCF resins. Both regions lean heavily on lightweight automotive programs, adding high-margin outlets for specialty grades.
MEA and South America Acrylic Resin Market
South America, the Middle East, and Africa are nascent but gathering pace. Industrialization, logistics corridors, and petrochemical joint ventures in the Gulf are fostering regional acrylic resin capacity additions. Although currency swings and regulatory heterogeneity pose hurdles, local market proximity cuts freight and import tariffs, improving cost-to-serve metrics.
Value Chain Analysis
The acrylic resin value chain begins with upstream petrochemical feedstocks, notably propylene, which are processed into key intermediates such as acrylic acid and methacrylate monomers (MMA). These monomers are then esterified to produce acrylate monomers, for example butyl acrylate and 2-ethylhexyl acrylate, before polymerization into acrylic resins (including emulsions and specialty grades). Downstream manufacturers formulate these resins into paints and coatings, adhesives and sealants, plastics, and other end-use systems.
Cost and availability are shaped by integration and regional manufacturing footprints. Integrated players can limit exposure to feedstock volatility and logistics shocks, while merchant resin producers and formulators rely more on contract pricing and steady monomer supply. In 2026, industry actions such as Arkema highlighting pricing pressure in acrylic monomers, alongside investments that consolidate upstream-to-downstream supply (for example, BASF scaling its Verbund model at Zhanjiang), reinforce the role of backward integration, mass-balance certified inputs, and proximity to major coatings and adhesive demand centers across Asia-Pacific, North America, and Europe.
Competitive Landscape
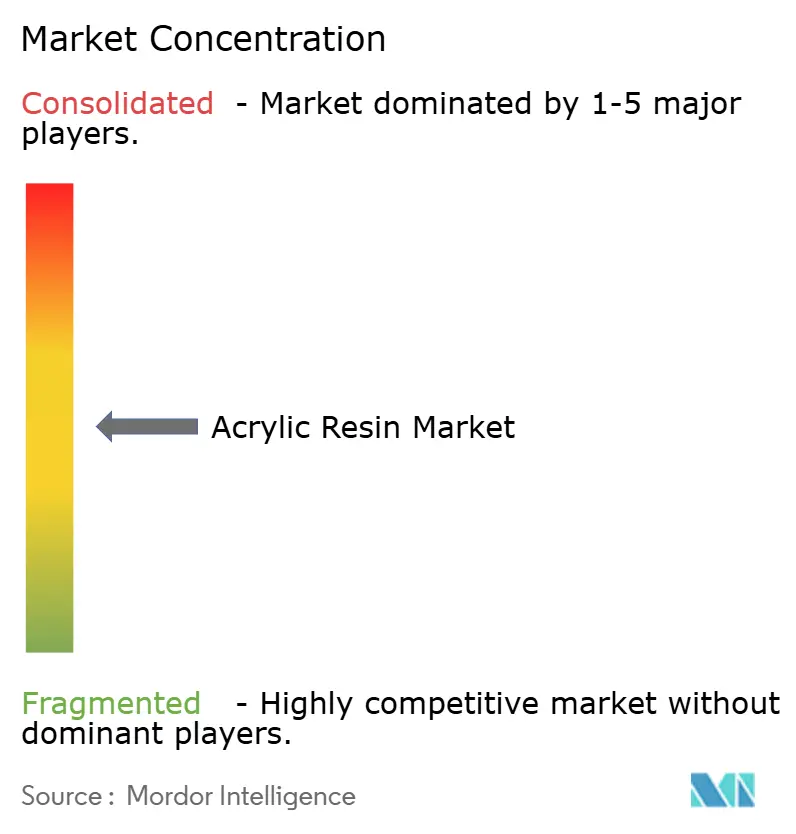
The acrylic resin market is moderately fragmented; top multinationals command significant yet contestable positions through scale, technology breadth, and geographic reach. Technology differentiation is decisive. Allnex’s merger with Nuplex created a global specialty-resin leader, enabling cross-regional delivery of high-solid, radiation-curable acrylics. Bio-based innovations, ISCC+ mass-balance certifications, and chemical-recycling breakthroughs add value propositions that command premium pricing and help customers hit carbon-reduction goals. Competitive intensity is therefore set to rise as players vie for leadership in sustainability and advanced-application submarkets within the acrylic resin market.
Acrylic Resin Industry Leaders
-
Arkema
-
BASF
-
Dow
-
Mitsubishi Chemical Group Corporation
-
Sumitomo Chemical Co., Ltd.
- *Disclaimer: Major Players sorted in no particular order
Acrylic Resin Market Companies Covered in this Report
- Allnex GMBH
- Arkema
- BASF
- Covestro AG
- DIC Corporation
- Dow
- Evonik Industries AG
- Henkel AG & Co. KGaA
- Mitsubishi Chemical Group Corporation
- Nippon Shokubai Co., Ltd.
- Resonac Holdings Corporation
- Röhm GmbH
- Sumitomo Chemical Co., Ltd.
Market Opportunities and Future Outlook
Bio-attributed and lower-product-carbon-footprint acrylic pathways are creating practical whitespace across both monomers and downstream resins, especially for coatings and adhesives customers responding to tighter VOC and sustainability requirements. The evidence includes BASF bringing new acrylate capacities into its China footprint at the Zhanjiang Verbund site (including 400,000 metric tons of butyl acrylate and 100,000 tons of 2-ethylhexyl acrylate) and Arkema reporting that over 70% of its global coating facilities had achieved ISCC PLUS certification as of January 2026. Together, these moves expand the addressable pool of certified, traceable inputs and support differentiation for waterborne and other low-emission acrylic systems using verified chain-of-custody claims.
A second opportunity area is emerging at the intersection of regional supply security and portfolio optimization in emulsions and specialty acrylics. The acrylic emulsion segment is seeing portfolio reshaping, including Mitsubishi Chemical announcing the transfer of its acrylic emulsion business to Konishi, which points to continued specialization and potential supplier realignment for coatings customers. With ongoing adoption of waterborne acrylic resins across Europe and Asia-Pacific under VOC-driven reformulation, manufacturers can consider new capacity siting near demand centers, longer-term supply agreements for certified inputs, and incremental investment in recycling-enabled and circular monomer routes for PMMA and related methacrylate streams.
Recent Industry Developments in Acrylic Resin Market
- March 2026: BASF Corporation launched Butyl acrylate RE and 2-Ethylhexyl acrylate RE (Renewable Electricity) produced at the Freeport, Texas site. The initiative demonstrates carbon footprint reduction via renewable electricity and mass-balance approach in key acrylic monomers. The action strengthens BASF's sustainability positioning in the acrylic resin value chain and supports market acceptance of low VOC and bio-based feedstock offerings.
- February 2026: Mitsubishi Chemical Corporation announced transfer of its acrylic emulsion business and the synthetic resin emulsion operations of its subsidiary, Japan Coating Resin Corporation, to Konishi. The transfer consolidates acrylic emulsion capabilities under a single entity, potentially changing regional supply dynamics. The consolidation could streamline operations and improve regional responsiveness for customers in coatings and related markets.
- July 2025: Arkema achieved ISCC PLUS certification for acrylic monomers at all global production sites, including Carling (France), Clear Lac (Texas), Taixing (China), and Bayport (Texas). The certification marks a regulatory milestone for ISCC Plus mass-balance in acrylic monomers. The achievement strengthens sustainability credentials and supports premium positioning in bio-based and mass-balance acrylics.
Acrylic Resin Market Report Scope and Research Methodology
Market Definition and Coverage
For this study, the acrylic resin market is defined as demand for acrylic-based resins used as binders and film formers across major downstream manufacturing uses, tracked globally and expressed in USD value for a given year.
Scope exclusions: We exclude finished formulated products (such as ready-to-use paints, coatings, and adhesives) where the resin is only one input cost.
Segments Covered in This Report
- By Product Type
- Acrylates
- Methacrylates
- Hybrids
- By Application
- Paints and Coatings
- Adhesives and Sealants
- Other Applications (Pigment Dispersion, Elastomers, etc.)
- By End-User Industry
- Building and Construction
- Automotive
- Electrical and Electronics
- Plastics
- Textile and Fibers
- Paper and Paperboard
- Other Applications (Packaging and Consumer Goods)
- By Geography
- Asia-Pacific
- China
- India
- Japan
- South Korea
- Malaysia
- Thailand
- Indonesia
- Vietnam
- Rest of Asia-Pacific
- North America
- United States
- Canada
- Mexico
- Europe
- Germany
- United Kingdom
- France
- Italy
- Spain
- Nordic Countries
- Turkey
- Russia
- Rest of Europe
- South America
- Brazil
- Argentina
- Colombia
- Rest of South America
- Middle-East and Africa
- Saudi Arabia
- United Arab Emirates
- Qatar
- South Africa
- Nigeria
- Egypt
- Rest of Middle-East and Africa
- Asia-Pacific
Data Sources, Market Sizing, and Validation
Desk Research
To set the boundaries and starting demand pools, we first used public statistics and technical references that show where acrylic resins are consumed and how volumes move through the chain. Examples include UN Comtrade trade statistics, USGS and national statistical offices for chemicals and manufacturing indicators, the US EPA and the European Chemicals Agency for regulatory and substance guidance, and standards and technical literature from groups such as ASTM and peer-reviewed polymer journals.
We also reviewed company annual reports, investor presentations, and credible trade press to understand capacity additions, shutdowns, and mix shifts toward waterborne and UV-curable systems. Where available, we used paid subscriptions for company financials and intelligence, import and export shipment-level checks, and patent databases to validate technology direction and price positioning. The desk sources listed here are not exhaustive, and we relied on additional public documents for data collection, cross-checking, and clarification.
Primary Interviews and Surveys
Next, we validated the demand story through expert calls and structured surveys with resin producers, distributors, compounders, and large end users that procure acrylic resin for coatings, adhesives, plastics, and related applications. The interviews focused on regional consumption trends, typical resin pricing by chemistry, supply tightness, and the practical split between merchant and captive volumes. Those inputs helped correct desk assumptions that were too broad or too narrow.
Distribution of primary research fieldwork respondents
| Company type | Respondent position | Region |
|---|---|---|
| Top tier: 30% | CXOs: 12% | APAC: 44% |
| Mid tier: 53% | Functional/Unit leaders: 37% | EMEA: 32% |
| Smaller Players: 17% | Managers: 51% | Americas: 24% |
Market-Sizing & Forecasting
The model starts from a top-down view where downstream production indicators and trade flows are used to reconstruct the acrylic resin demand pool by region, then mapped to resin intensity in key uses such as architectural and industrial coatings, adhesives and sealants, and plastics modification. From there, we convert the validated volume view into value by applying region-specific average selling prices that reflect chemistry mix (acrylates, methacrylates, and hybrids), typical contract timing, and the shift toward waterborne and UV systems.
To keep totals realistic, results are corroborated with selective bottom-up approximations, including sample supplier roll ups, channel checks with distributors, and volume times ASP sanity checks for a short list of high-consumption end uses. When bottom-up detail was missing for smaller end markets, we used proxy indicators such as construction activity, vehicle production, and industrial output, followed by expert validation so we did not overfit the model.
For forecasting, we used scenario analysis supported by short-cycle macro indicators and resin-specific drivers, including building activity, auto production, coatings output, capacity utilization trends, and feedstock-linked price direction. In periods where price movements were the main swing factor, the projection leaned more on ASP paths, while volume growth stayed tied to end-use growth rates that interviewees said were achievable.
Data Validation & Update Cycle
Outputs are checked against independent signals such as reported capacity changes, regional import-export balances, and end-use output trends, and then reviewed for year-to-year jumps that do not match industry behavior. If a variance looks large, we re-check unit conversions, currency assumptions, and price timing, and then re-contact selected experts to confirm whether a real market event explains the change.
Each report goes through multi-step analyst review before sign-off, and the model files are kept traceable so inputs can be audited quickly. Reports are refreshed annually, with interim updates when material events occur, and before delivery we do a final pass so clients receive the latest updated view.
Mordor Intelligence's Acrylic Resin Market Estimate Compared With Other Published Estimates
Published market sizes for acrylic resin can look far apart because some studies anchor on volume while others report value, and because the scope line between resin, formulated products, and adjacent polymers is not always drawn the same way. Differences also come from when prices are captured in the year, how currency conversion is timed, and whether regional mix shifts are updated or left as older assumptions.
In our work, the main gap driver is usually ASP logic and refresh cadence, since resin prices move with feedstock conditions and contract cycles, and the mix between acrylates and methacrylates also changes the average. By re-validating regional ASP bands and converting currency at consistent timing before finalizing the yearly value, Mordor Intelligence reduces drift that can happen when older price points or broad blended prices are carried forward.
Benchmark comparison
| Source | Market Size | Gaps in Research Methodology |
|---|---|---|
| Mordor Intelligence | USD 7.13 M (2026) | |
| Industry Data Publisher A | USD 22.30 B (2024) | Reported in value terms with a broad segmentation set that likely captures additional finished-system revenue or a wider definition of acrylic resins, and the price basis year can differ from resin contract timing. |
| Newswire Summary B | USD 28.55 B (2030) | A forward-year value headline without visible detail on base-year pricing, currency timing, or how merchant resin is separated from formulated coatings and adhesives, which can inflate the reported total. |
The spread in figures mainly reflects differences in unit of measure and where the boundary is set between resin and downstream formulations, and then it gets amplified by how pricing is updated. When the same scope and price-timing choices are applied year after year, the market path becomes easier to follow and the assumptions stay repeatable for planning.
Key Questions Answered in the Report
What is the current size of the acrylic resin market and how fast is it growing?
The acrylic resin market size reached 7.13 million tons in 2026 and is projected to grow at a 3.99% CAGR, achieving 8.67 million tons by 2031.
Which region contributes most to acrylic resin demand?
Asia-Pacific accounts for 50.96% of global volume in 2025, supported by large construction programs and rising automotive output.
Which product segment is expanding fastest in the acrylic resin market?
Acrylate-based resins are expected to post a 5.18% CAGR through 2031 due to adhesive and bio-based formulation uptake.
What is driving acrylic resin use in electric vehicles?
Electric-vehicle makers rely on lightweight, thermally stable acrylic parts for battery enclosures, glazing, and interior components, pushing automotive demand to a 5.47% CAGR.
How are environmental regulations shaping product development?
Low-VOC mandates in North America and Europe accelerate the shift to water-borne acrylics and drive investment in bio-based and chemically recycled resin options.