
Acrylic Fiber Market Size and Share
Market Overview
| Study Period | 2020 - 2031 |
|---|---|
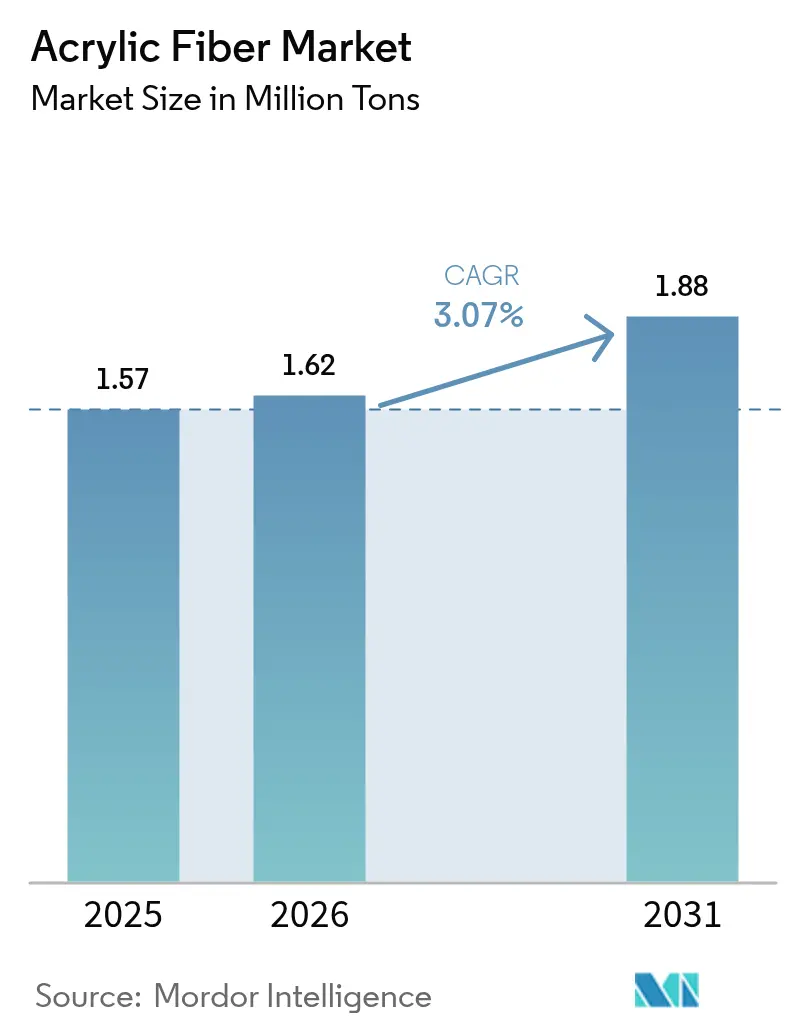
| Market Volume (2026) | 1.62 Million tons |
| Market Volume (2031) | 1.88 Million tons |
| Growth Rate (2026 - 2031) | 3.07 % |
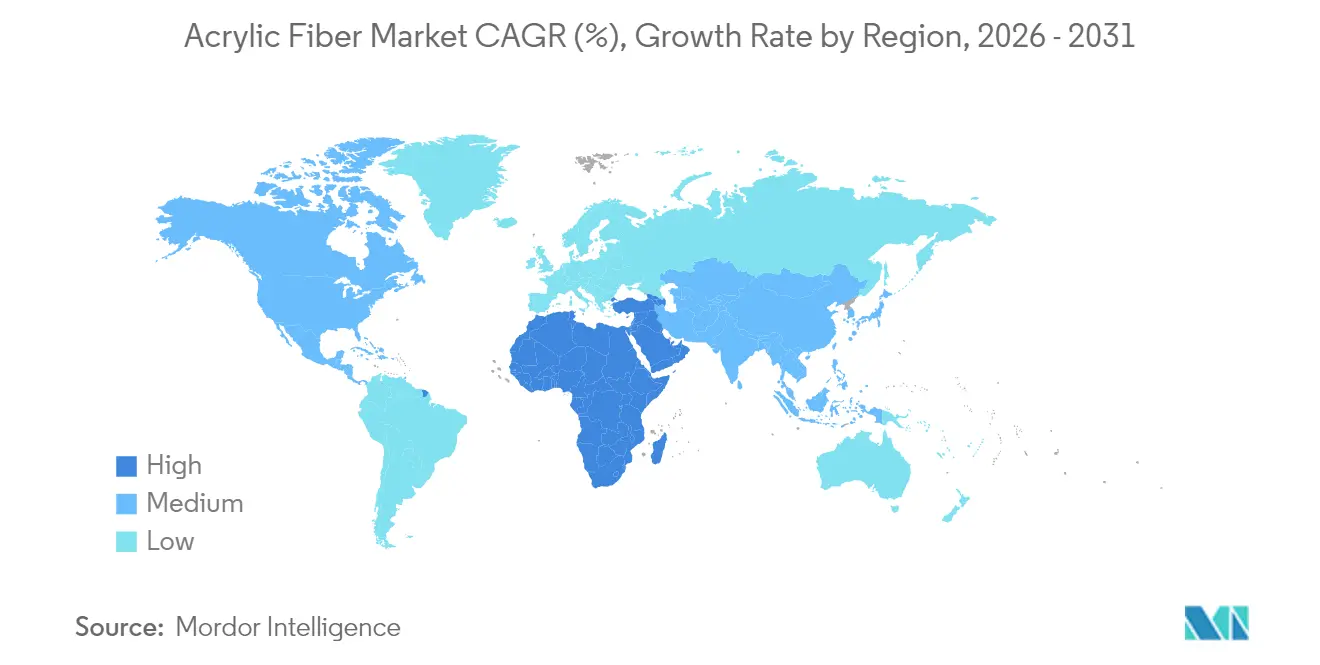
| Fastest Growing Market | Middle East and Africa |
| Largest Market | Asia Pacific |
| Market Concentration | Medium |
Major Players *Disclaimer: Major Players sorted in no particular order Image © Mordor Intelligence. Reuse requires attribution under CC BY 4.0. | |
Acrylic Fiber Market Analysis by Mordor Intelligence
The Acrylic Fiber Market size was valued at 1.57 Million tons in 2025 and estimated to grow from 1.62 Million tons in 2026 to reach 1.88 Million tons by 2031, at a CAGR of 3.07% during the forecast period (2026-2031). Compliance costs tied to Extended Producer Responsibility (EPR) mandates, volatile acrylonitrile (ACN) pricing, and feedstock diversification efforts are reshaping cost structures and accelerating sustainability-linked innovation. Asia-Pacific continues to anchor global demand, while Middle East and Africa shows healthy catch-up growth as regional producers leverage local petrochemical resources. Staple fiber remains the dominant form, thanks to its versatility across apparel, home textiles, and emerging technical applications. Moderate but rising recycling premiums, coupled with propane-based ACN synthesis breakthroughs, create new opportunities for agile suppliers responding to the evolving competitive landscape.
Key Report Takeaways
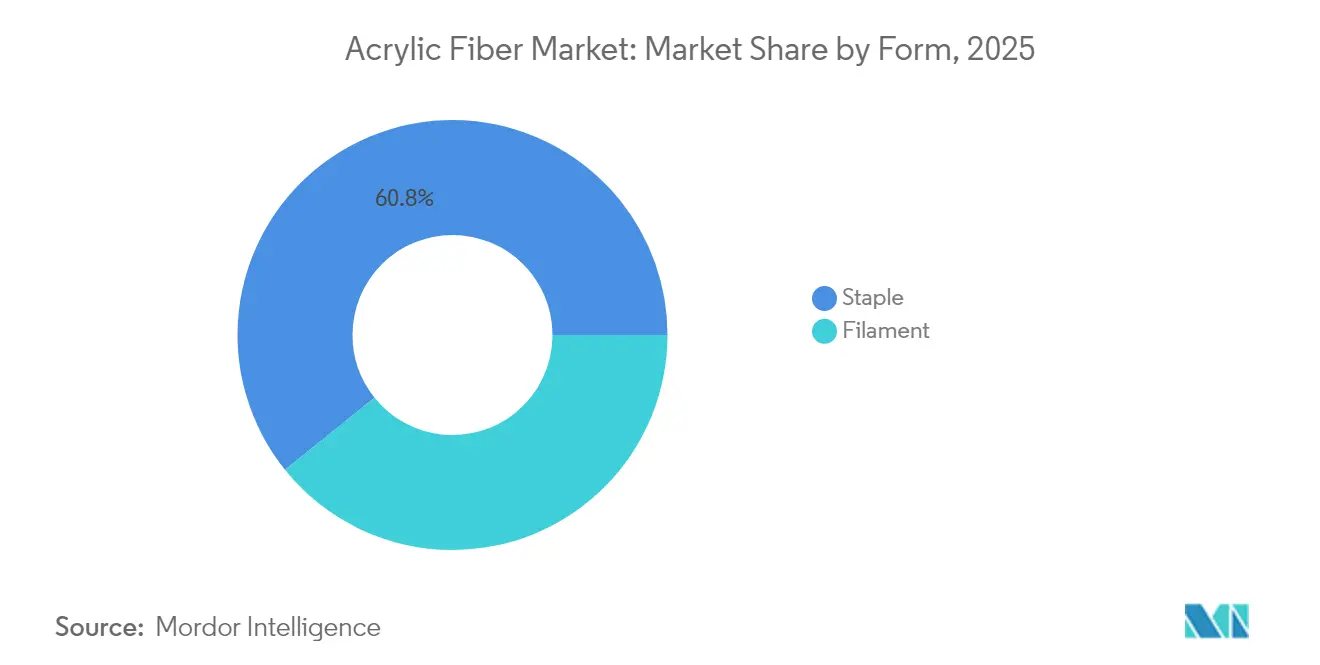
- By form, staple fiber accounted for 60.78% acrylic fiber market share in 2025 and is advancing at a 3.71% CAGR through 2031.
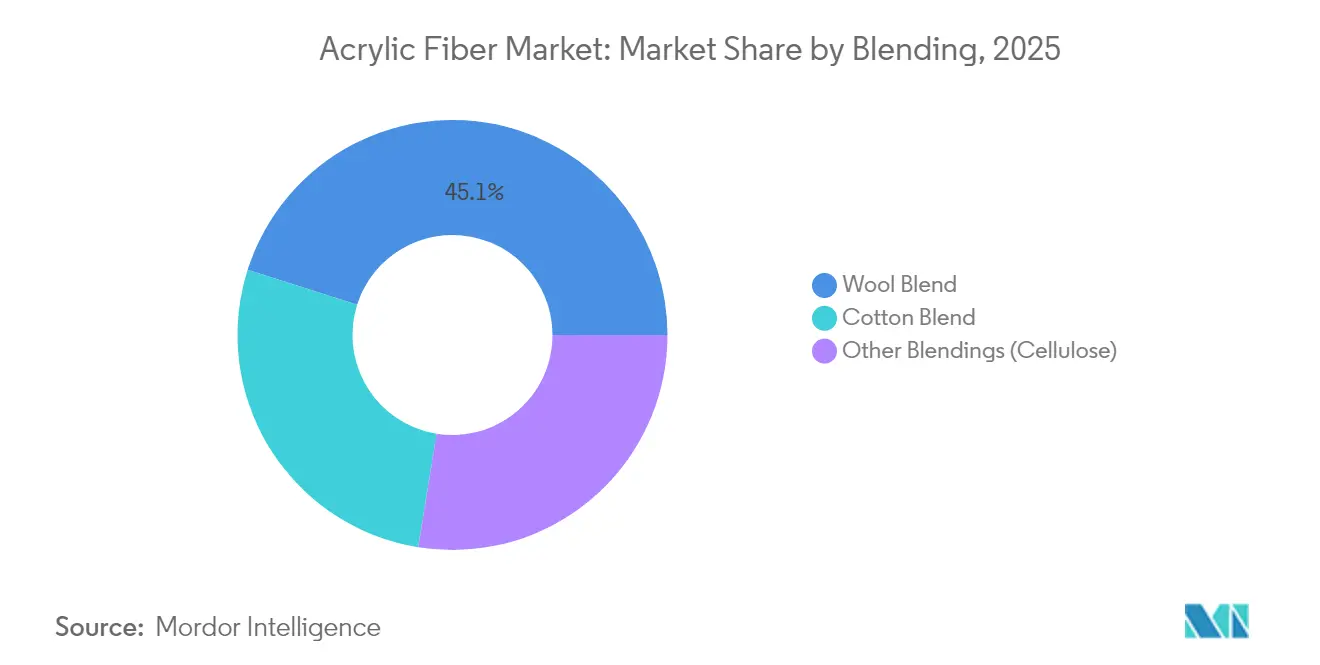
- By blending, wool blends commanded 45.10% of the acrylic fiber market size in 2025, while other blends are forecast to grow at 3.41% CAGR through 2031.
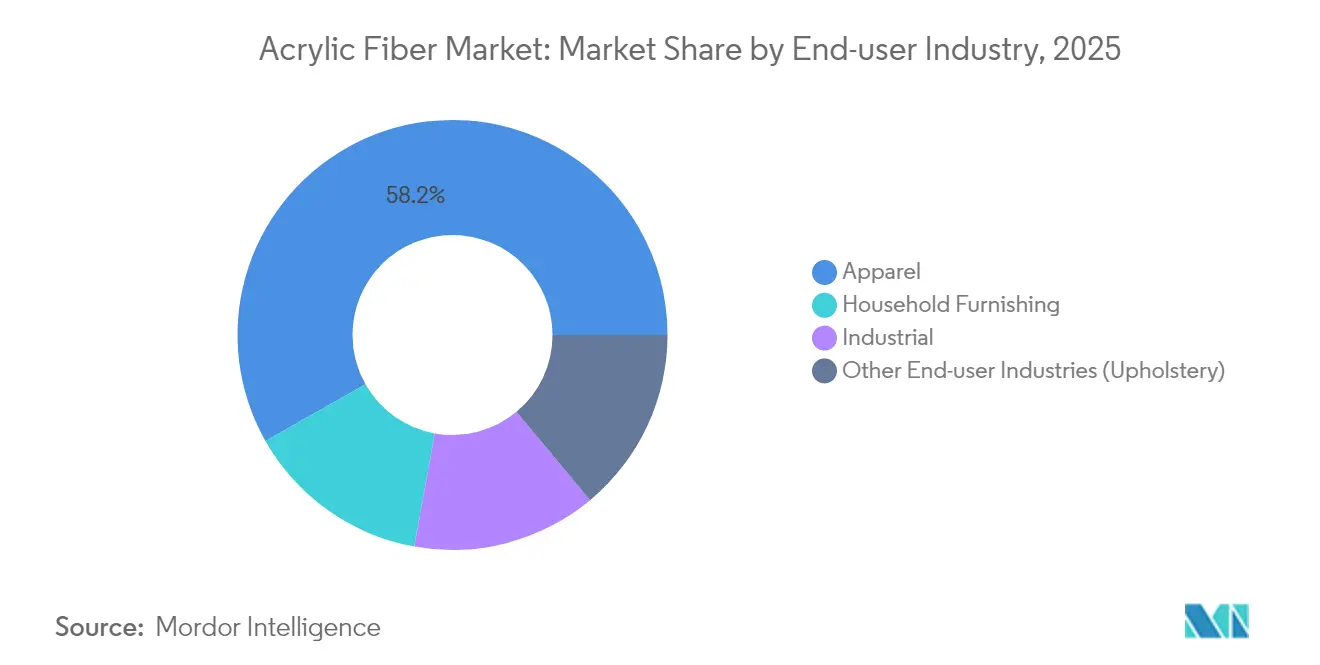
- By end-user industry, apparel led with 58.20% of 2025 volume; while other end-user industries are projected to expand at a 3.86% CAGR to 2031.
- By geography, Asia-Pacific held 68.10% share of the acrylic fiber market in 2025, whereas Middle East and Africa is on track for a 3.63% CAGR through 2031.
Note: Market size and forecast figures in this report are generated using Mordor Intelligence’s proprietary estimation framework, updated with the latest available data and insights as of 2026.
Market Trends and Insights
Drivers Impact Analysis of Acrylic Fiber Market*
| Driver | (~) % Impact on CAGR Forecast | Geographic Relevance | Impact Timeline |
|---|---|---|---|
| High Demand for Wool-Like Properties in Apparel | +0.8% | Global, with concentration in Asia-Pacific and Europe | Medium term (2-4 years) |
| Growth in Home-Furnishing and Carpeting Demand | +0.6% | North America and Europe, expanding to Asia-Pacific | Long term (≥ 4 years) |
| Increasing Industrial and Filtration Applications | +0.5% | Global, with early adoption in North America and EU | Medium term (2-4 years) |
| High-Bulk Acrylic Innovations for Lightweight Insulation | +0.4% | North America and Europe, cold-climate regions | Long term (≥ 4 years) |
| Surge in Recycled Acrylic Fiber Under Global EPR Mandates | +0.9% | EU, California, expanding globally | Short term (≤ 2 years) |
| Source: Mordor Intelligence | |||
High Demand for Wool-Like Properties in Apparel
Fashion brands favor acrylic’s ability to mimic wool’s crimp, warmth, and softness while offering improved colorfastness and easy care. Bicomponent spinning now enables cashmere-like deniers that appeal to the premium casual category. Asian producers capitalize on integrated supply chains to supply finer denier yarns efficiently. In parallel, animal-welfare concerns reinforce demand for synthetic alternatives that meet the tactile expectations of knitwear consumers. The resulting pull effect underpins stable apparel volume even as competing synthetics proliferate.
Growth in Home-Furnishing and Carpeting Demand
Commercial construction rebounds and higher renovation rates sustain acrylic demand in upholstery, drapery, and contract carpeting. Built-in flame retardancy and UV stability suit hospitality and healthcare interiors that require stringent safety compliance. Solution-dyed acrylic’s vivid colorfastness commands premium decorative applications, although cost-efficient polyester continues to erode share in residential broadloom. Building codes favor inherently flame-retardant fibers, supporting acrylic adoption in public spaces where natural fibers fall short.
Increasing Industrial and Filtration Applications
Stricter air-quality rules elevate technical textile demand for acid-resistant filter media. Acrylic’s thermal stability makes it suitable for baghouse systems operating under corrosive conditions. Nanoparticle-enhanced fibers further improve adsorption of SO₂ and NOₓ, positioning the material for next-generation emission-control fabrics. Certification frameworks such as ISO 14001 accelerate adoption by heavy industry emitters aiming for compliance and ESG targets[1].
High-Bulk Acrylic Innovations for Lightweight Insulation
Hollow-fiber and air-textured processes yield low-density fabrics that retain warmth without weight penalties. Cold-climate apparel, sleeping bags, and architectural textiles benefit from these advances. Energy-efficiency regulations in building envelopes encourage lightweight composites that use less material yet meet thermal codes, widening the addressable technical-textile space for acrylic.
Restraints Impact Analysis of Acrylic Fiber Market*
| Restraint | (~) % Impact on CAGR Forecast | Geographic Relevance | Impact Timeline |
|---|---|---|---|
| Competition from Cost-Efficient Polyester and Blends | -0.7% | Global, particularly in residential carpet markets | Medium term (2-4 years) |
| Stringent Environmental Rules on ACN Emissions | -0.4% | EU, North America, expanding to Asia-Pacific | Long term (≥ 4 years) |
| Acrylonitrile Price Volatility Tied to Propylene Supply | -0.6% | Global, with highest impact in Asia-Pacific | Short term (≤ 2 years) |
| Source: Mordor Intelligence | |||
Competition from Cost-Efficient Polyester and Blends
Solution-dyed PET carpets outcompete acrylic on stain resistance and raw-material costs, prompting major U.S. mills to convert lines to PET. Polyester’s mature mechanical and chemical recycling infrastructure also strengthens its eco-profile relative to acrylic. Activewear and budget knitwear increasingly shift to polyester blends that match acrylic’s thermal properties at lower cost, squeezing acrylic’s share in entry-level price tiers.
Stringent Environmental Rules on ACN Emissions
New Best Available Techniques Reference (BREF) standards in the EU require tighter control of ACN off-gassing, compelling mills to invest in scrubbers and incineration upgrades. Similar proposals under the U.S. EPA’s Hazardous Organic NESHAP add capital overheads[2]. Compliance costs erode margins for older plants lacking efficient emission-control lines, nudging consolidation toward integrated players that can amortize upgrades.
*Our forecasts treat driver/restraint impacts as directional, not additive. The impact forecasts reflect baseline growth, mix effects, and variable interactions.
Acrylic Fiber Market Segment Analysis
By Form:
Staple Fiber Dominance Sustains GrowthStaple fiber held 60.78% of the acrylic fiber market in 2025 and is forecast to grow at 3.71% CAGR through 2031. The segment benefits from widespread ring- and open-end-spinning capacity able to process a broad linear-density range, supporting large-volume apparel and home-textile orders. Finer denier advances help staple compete in cashmere-touch knitwear lines, expanding its premium footprint and cushioning price pressures.
Filament accounts for the balance of volume and serves narrow industrial and specialty-fabric niches such as outdoor awnings and flame-retardant uniforms. Although its CAGR trails staple, filament demand remains sticky where continuous-filament strength and even dye uptake are critical. Broader acceptance of solution-dyed technologies may unlock incremental growth, yet current competitiveness relies on niche differentiation rather than scale.

By Blending:
Wool Blends Lead While Cellulose Hybrids RiseWool blends represented 45.10% of the acrylic fiber market size in 2025, sustained by acrylic’s ability to lower raw material costs and reduce pilling relative to pure wool products. Spinners leverage acrylic to balance hand-feel with price in mid-range sweaters and scarves, reinforcing blend stickiness.
Other blends, encompassing viscose and lyocell hybrids, are projected to expand at 3.41% CAGR, the fastest in the blending category. These combinations respond to brands’ circular-economy goals, delivering improved biodegradability without sacrificing processing versatility. Cotton-acrylic blends occupy volume mid-ground, serving T-shirts and lightweight leisurewear seeking softness and moisture management.
By End-User Industry:
Apparel Retains Core Demand Amid Industrial UpswingThe apparel industry captured 58.20% acrylic fiber market share in 2025. Knitwear manufacturers highlight acrylic’s vibrant coloration, warmth, and low-shrink properties in pullovers and outer layers. Mass retailers rely on dependable supply chains from China, India, and Türkiye to keep program costs in check.
Other end-user industries are on course for a 3.86% CAGR, outpacing all other end uses. Stack-gas regulations drive demand for high-loft needle-felts and specialty baghouse cartridges where acrylic outperforms polyester under acidic fumes. Household furnishings occupy an intermediate growth path, aided by hospitality renovations that seek flame-retardant draperies and contract upholstery.
Geography Analysis
APAC Acrylic Fiber Market
Asia-Pacific generated 68.10% of global volume in 2025, underpinned by China’s integrated naphtha-to-ACN chains and a robust downstream textile cluster. Continuous capacity additions in acrylonitrile, sometimes leveraging propane dehydrogenation routes, keep regional cash costs competitive even amid volatile propylene fundamentals. Export-oriented garment hubs in Vietnam and Bangladesh further anchor regional offtake, and regional mills increasingly target recycled-content orders to satisfy Western retailer mandates.
North America and Europe Acrylic Fiber Market
North America and Europe together hold under one-quarter of global volume yet excel in technical-textile innovation and sustainability compliance. U.S. demand concentrates on industrial-filtration and outdoor-performance apparel, while EU mills pivot toward recycled-acrylic and specialty filament lines that fetch higher margins. High energy prices pressure European cost curves, but near-market sourcing and stringent eco-standards sustain a resilient premium-goods niche.
MEA and South America Acrylic Fiber Market
Middle East and Africa is projected to grow at 3.63% CAGR through 2031. Petrochemical investments in Saudi Arabia, Egypt, and the United Arab Emirates aim to monetize abundant propane and circumvent ACN import dependence. Tailored free-zone incentives encourage downstream spinning and knitting clusters, though talent gaps and supply-chain immaturity still temper ramp-up speed. South America continues as a modest consumption basin tethered to domestic textile cycles; its producers focus on capturing regional trade bloc opportunities while mitigating currency volatility.
Value Chain Analysis
The acrylic fiber value chain begins with petrochemical feedstocks, primarily propylene-derived acrylonitrile (ACN), along with comonomers such as vinyl acetate, catalysts, and solvents (commonly DMF or DMAc), plus steam and electricity. Fiber producers polymerize ACN using solution or suspension routes, then carry out wet or dry spinning, drawing, washing to remove residual solvent, crimping, and heat-setting before converting into tow, staple, or filament formats for downstream spinning, knitting or weaving, dyeing or finishing, and garment or technical-textile fabrication.
Integration levels vary by region and player. Some groups combine petrochemicals, ACN, acrylic fiber, and yarn operations, for example, Taekwang Industrial Co., Ltd. integrates from propylene or ACN through fiber and yarn. Others operate as spinners that depend on merchant ACN supply and contracted utilities. Distribution typically involves direct supply to large textile mills and brand-nominated programs, with traders also covering spot volumes. Key bottlenecks concentrate around ACN price volatility and reliability, solvent recovery and emissions-control requirements, and the need to qualify fibers for recycled-content and traceability programs that are increasingly specified by downstream buyers.
Competitive Landscape
The acrylic fiber market shows moderate concentration with the top five suppliers representing roughly 55% of global capacity. Aksa Akrilik, Aditya Birla, and major Chinese state-owned groups defend share via captive ACN assets and multi-region spinning hubs. Profitability, however, compressed in 2025 after ACN spikes widened variable-cost spreads; Aksa reported a 76% year-on-year profit drop, and its utilization fell to 78%. Larger Chinese complexes countered volatility by commissioning propane-based ACN pilots that hedge propylene swings and unlock incremental margin headroom.
Strategically, producers prioritize incremental process optimization, scope-3 emission reporting, and recycled-content launches over disruptive fiber inventions. Joint ventures such as DowAksa’s carbon-fiber composites signal moves down the value chain to offset commoditized staple margins. Consolidation activity—exceeding 300 petrochemical deals in 2024—suggests looming mergers of smaller standalone spinners unable to finance EPR-driven recycling lines and environmental retrofits.
Acrylic Fiber Industry Leaders
-
Aksa Akrilik Kimya Sanayii A.Ş.
-
Jilin Chemical Fiber Group Co., Ltd.
-
Dralon GmbH
-
TAEKWANG INDUSTRIAL CO., LTD.
-
Aditya Birla Group (Thai Acrylic Fiber)
- *Disclaimer: Major Players sorted in no particular order

Acrylic Fiber Market Companies Covered in this Report
- Aditya Birla Group (Thai Acrylic Fiber)
- Aksa Akrilik Kimya Sanayii A.Ş.
- Asahi Kasei Corporation
- Birlacril
- China Petrochemical Corporation
- Dolan GmbH
- Dralon GmbH
- Formosa Plastics Corporation
- Indian Acrylics Limited
- Jiangsu Zhongxin Resources Group
- Jilin Chemical Fiber Group Co., Ltd.
- Kaltex Group
- Pasupati Acrylon
- TAEKWANG INDUSTRIAL CO., LTD.
- Tong-Hwa Synthetic Fiber Co.
- Toray Industries Inc.
- Vardhman Acrylics Ltd.
Market Opportunities and Future Outlook
A key whitespace sits where sustainability compliance overlaps with performance requirements. Brands and industrial buyers are pushing suppliers to reduce water, energy, and traceability risk while keeping acrylics wool-like aesthetics and technical durability. Product and process innovation that lowers wet-processing intensity, including dope-dyed and solution-dyed pathways and improved dyeability, offers a practical route for spinners and fabric mills to cut resource use without switching away from acrylic. One example is Aksa Acrylics Acryluna OnceDye concept introduced in April 2025, positioned around improved dyeing efficiency and reduced environmental footprint.
Technical-textile demand is another opportunity area. Acrylics chemical resistance and thermal stability fit industrial filtration needs as air-quality requirements tighten, while adjacent precursor demand keeps producers focused on higher-value outlets beyond commodity staple. On the supply side, Asia-Pacific scale and integration remain central, but the market also needs tighter upstream-downstream coordination after the 2025 period in which producer run-rate decisions fed back into ACN pricing behavior. Programs that connect recycled-content, verification, and downstream specifications, such as the traceability system adopted by Thai Acrylic Fibre with FibreTrace in October 2024, support premiumization for compliant acrylic products, particularly in export-oriented apparel and home-textile supply chains.
Recent Industry Developments in Acrylic Fiber Market
- March 2026: Jilin Chemical Fiber Group Co., Ltd. commissioned a 15,000-ton bio-based fine-denier artificial silk line and reported dual FSC and EU-BAT related certifications for the new capacity. The expansion supports its ability to serve specification-driven textile supply chains that require documented environmental compliance, and it increases competitive pressure on premium, lower-impact man-made fiber offerings in Asia-centric sourcing corridors.
- September 2025: Aksa Akrilik Kimya Sanayii A.S. signed a binding agreement to acquire Dow's remaining 50% stake in the DowAksa carbon fiber joint venture for USD 125 million. Full ownership increases Aksa's control over a higher-value downstream outlet for acrylonitrile chemistry, supporting diversification away from more commoditized staple-fiber margin cycles.
- October 2024: Aditya Birla Group's Thai Acrylic Fibre partnered with FibreTrace to embed luminescent pigment identifiers into acrylic fibers to enable digital traceability, including for its Regel recycled fibers. This capability aligns acrylic supply with brand-level verification requirements and helps differentiate recycled-content acrylic in procurement programs shaped by EPR-related compliance expectations.
Acrylic Fiber Market Report Scope and Research Methodology
Market Definition and Coverage
The acrylic fiber market is defined as demand and supply of manmade fiber made mainly from acrylonitrile, sold as staple or filament and used for spinning and textile manufacturing across apparel, home textiles, and industrial fabrics.
Scope exclusions: This sizing excludes downstream finished goods retail value, as well as acrylic coatings, resins, and unrelated synthetic fibers that are not sold as acrylic fiber.
Segments Covered in This Report
- By Form
- Staple
- Filament
- By Blending
- Wool Blend
- Cotton Blend
- Other Blendings (Cellulose)
- By End-user Industry
- Apparel
- Household Furnishing
- Industrial
- Other End-user Industries (Upholstery)
- By Geography
- Asia-Pacific
- China
- India
- Japan
- South Korea
- ASEAN Countries
- Rest of Asia-Pacific
- North America
- United States
- Canada
- Mexico
- Europe
- Germany
- United Kingdom
- France
- Italy
- Russia
- NORDIC Countries
- Rest of Europe
- South America
- Brazil
- Argentina
- Rest of South America
- Middle East and Africa
- Saudi Arabia
- South Africa
- Rest of Middle East and Africa
- Asia-Pacific
Data Sources, Market Sizing, and Validation
Desk Research
Desk research started with mapping the global acrylic fiber value chain so we could separate fiber production and trade from downstream textile conversion. Public statistics were used to anchor the model, such as UN Comtrade trade flows for acrylic staple and tow, national customs portals for import and export direction, and government industry releases where fiber output is reported under manmade fibers.
To keep assumptions realistic, we also reviewed technical and demand context from sources such as the International Textile Manufacturers Federation, the World Bank and IMF macro series (industrial output, inflation, and exchange rates), peer reviewed polymer and textile journals for process and yield clues, and patent databases to track technology shifts like improved dyeability and recycling claims. Company annual reports, investor presentations, and reputable press helped validate capacity moves, utilization commentary, and pricing direction, and then company financials and news intelligence subscriptions were used selectively to cross check timelines and corporate structure. These sources are illustrative, and many other public and proprietary references were also used for data collection, validation, and clarification.
Primary Interviews and Surveys
Primary work focused on interviews and short surveys with fiber producers, textile converters, distributors, and procurement roles at fabric and garment manufacturers. Inputs were used to verify application mix, typical blending practices, plant utilization ranges, and how prices move with acrylonitrile and energy costs across APAC, EMEA, and the Americas.
Distribution of primary research fieldwork respondents
| Company type | Respondent position | Region |
|---|---|---|
| Top tier: 38% | CXOs: 15% | APAC: 47% |
| Mid tier: 44% | Functional/Unit leaders: 33% | EMEA: 35% |
| Smaller Players: 18% | Managers: 52% | Americas: 18% |
Market-Sizing & Forecasting
Market size was constructed mainly through a top-down approach where production, capacity, utilization, and net trade signals are used to rebuild the apparent consumption pool by region, and then reconciled with end use demand shares. To avoid over relying on any one statistic, we corroborated totals using selective bottom-up checks, such as sampled supplier volume disclosures, channel checks for staple versus filament mix, and sanity checks on average selling price movement where value is discussed in public sources.
A few market fingerprints were tracked closely because they explain most of the volume change in acrylic fiber, including acrylonitrile price direction, operating rates at major fiber plants, trade balance shifts for acrylic staple and tow, blending rates with wool and cotton in key textile categories, and demand trend in sweaters, blankets, carpets, and technical fabrics. Where company level volume was not disclosed, gaps were handled through capacity nameplate estimates, utilization bands from primary conversations, and regional trade proxies, before being reviewed against macro textile output indicators.
For forecasting, we relied on scenario analysis supported by simple regression style relationships between acrylic fiber demand and textile production, winter season demand patterns in major consuming regions, and feedstock cost pass through behavior. Assumptions were pressure tested with industry experts so the final curve reflects what buyers and suppliers see as practical rather than a purely formula driven projection.
Data Validation & Update Cycle
Outputs were validated through multiple checks, starting with internal consistency tests across production, imports, exports, and consumption so obvious mismatches can be flagged early. When variances showed up, the underlying drivers were revisited, such as a sudden utilization shift, an abnormal trade spike, or currency timing that distorted value comparisons, and then follow up questions were routed back to selected interviewees.
Before sign off, the model goes through a multi step analyst review where key assumptions, conversion logic, and regional splits are challenged and rewritten if they cannot be explained clearly. Reports are refreshed annually, and interim updates are triggered when material events occur, such as major plant shutdowns, new capacity commissioning, or sharp feedstock price moves. Right before delivery, a final review pass is done so the latest view is reflected in the outputs.
Mordor Intelligence's Acrylic Fiber Market Sizing Compared With Other Published Estimates
Published market sizes for acrylic fiber can look far apart because some authors present value in USD, others present volume in tons, and the conversion logic is not always explained. Differences also come from whether the estimate is tied to fiber shipments only, or if it quietly pulls in yarn and fabric value, which can inflate totals.
Another common gap driver is the way pricing is handled across regions, since acrylic fiber prices move with acrylonitrile, energy, and local supply tightness, and a single global average can drift away from reality. The spread also reflects refresh cadence, because a model that does not revisit utilization and trade direction can miss turning points that show up first in customs data and plant operating rates. This is why the market size is kept anchored to volume first and only then translated to USD when a clear price logic is available, a choice applied by Mordor Intelligence.
Benchmark comparison
| Source | Market Size | Gaps in Research Methodology |
|---|---|---|
| Mordor Intelligence | USD 1.62 M (2026) | |
| Global Consultancy A | USD 5.87 B (2026) | Reported in value terms and likely reflects a broader revenue pool that can include yarn or downstream textile conversion, and it also depends heavily on blended ASP assumptions across regions. |
| Industry Publisher B | USD 5.72 B (2025) | Uses a different base year and value definition, and the estimate can shift based on currency conversion timing and whether trade and utilization checks are used to validate implied demand. |
The comparison points to two practical reasons for the gap, which are unit of measurement and what is counted along the chain. By keeping the core model traceable to capacity, utilization, and net trade signals, and then pressure testing the assumptions with interviews, we reduce the chance that the final number is driven mainly by a pricing shortcut.
Key Questions Answered in the Report
What is the current size of the acrylic fiber market?
The current size of the acrylic fiber market is estimated at 1.62 million tons and expected to reach 1.88 million tons, growing at a 3.07% CAGR from 2026.
Which form dominates acrylic fiber demand?
Staple fiber leads, holding 60.78% of 2025 volume and maintaining the fastest growth trajectory through 2031.
Which region will expand fastest in acrylic fiber consumption?
Middle East and Africa is forecast to grow at 3.63% CAGR as petrochemical investments localize supply.
How do EPR mandates influence producers?
Regulations in the EU and California raise compliance costs but create premium pricing for recycled acrylic content.