
Accountable Care Solutions Market Size and Share
Market Overview
| Study Period | 2022 - 2031 |
|---|---|
| Market Size (2026) | USD 29.14 Billion |
| Market Size (2031) | USD 50.77 Billion |
| Growth Rate (2026 - 2031) | 11.74 % |
| Fastest Growing Market | Asia Pacific |
| Largest Market | North America |
| Market Concentration | Medium |
Major Players *Disclaimer: Major Players sorted in no particular order Image © Mordor Intelligence. Reuse requires attribution under CC BY 4.0. | |
Accountable Care Solutions Market Analysis by Mordor Intelligence
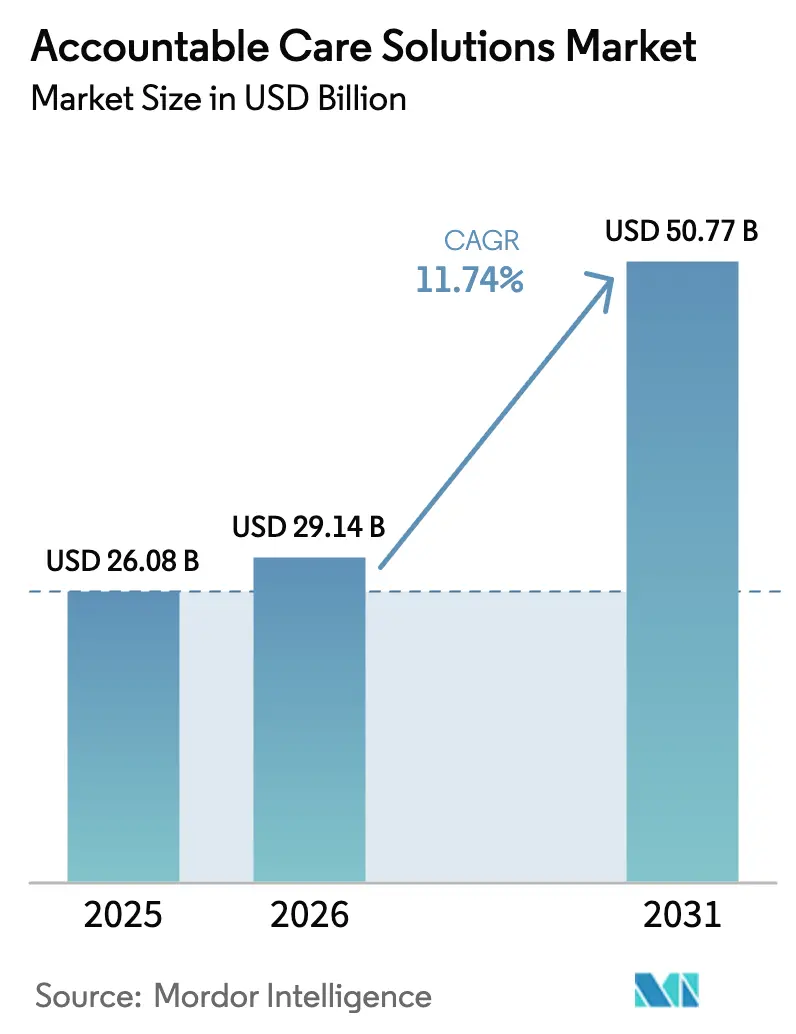
The accountable care solutions market size was valued at USD 26.08 billion in 2025 and estimated to grow from USD 29.14 billion in 2026 to reach USD 50.77 billion by 2031, at a CAGR of 11.74% during the forecast period (2026-2031). Regulatory pressure from the Centers for Medicare & Medicaid Services (CMS) to place every Traditional Medicare beneficiary in an accountable care relationship by 2030 anchors demand. Cloud-first strategies, now averaging USD 38 million in annual spending per health system, supply the scalable infrastructure needed for AI-driven analytics. Widespread deployment of healthcare big-data platforms—in which 89% of provider organizations already use artificial intelligence to simplify clinical and administrative work—further accelerates investment. As providers move from fee-for-service to value-based reimbursement, integrated platforms that coordinate clinical, financial, and population-health workflows replace isolated point solutions. Competitive momentum remains moderate because large vendors consolidate share through cloud-native platforms, yet smaller entrants still find room to differentiate on specialized analytics or regional compliance strengths.
Key Report Takeaways
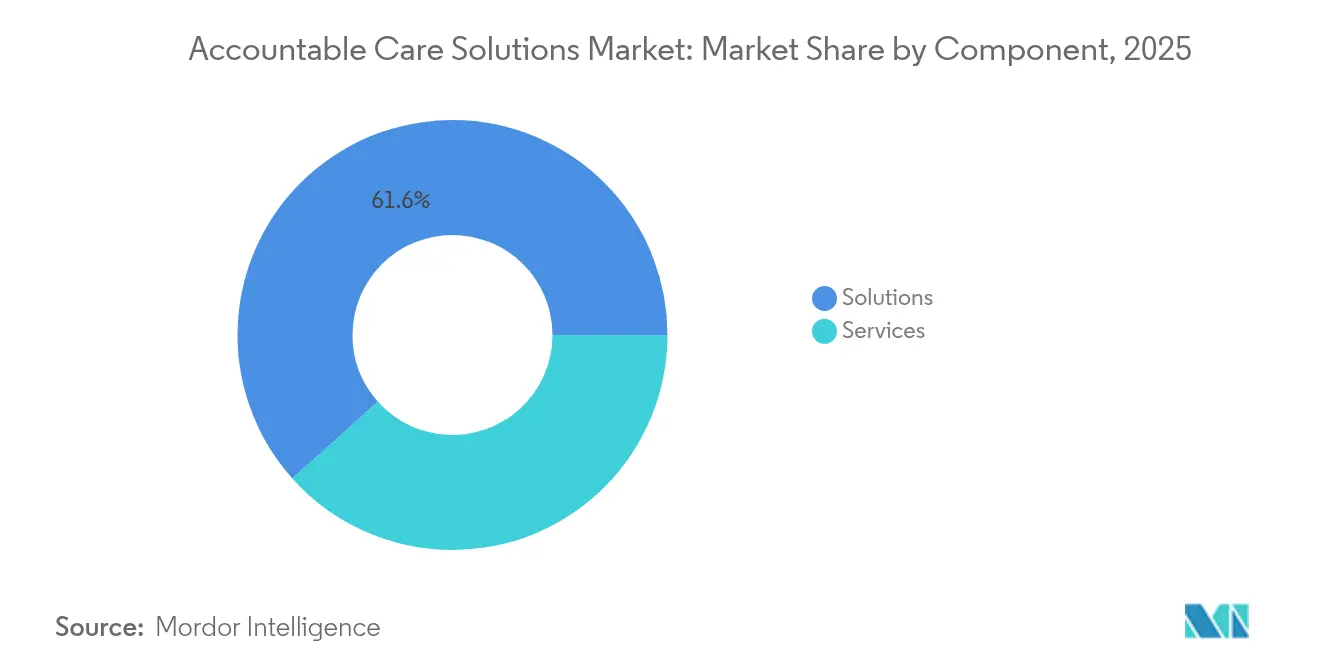
- By component, solutions led with 61.62% revenue share in 2025; services are projected to expand at a 12.76% CAGR to 2031.
- By application, electronic health records captured 28.96% of the accountable care solutions market share in 2025, while population & care management is advancing at a 13.08% CAGR through 2031.
- By deployment mode, cloud-based deployments commanded 63.35% of the accountable care solutions market size in 2025 and are forecast to grow at a 11.88% CAGR by 2031.
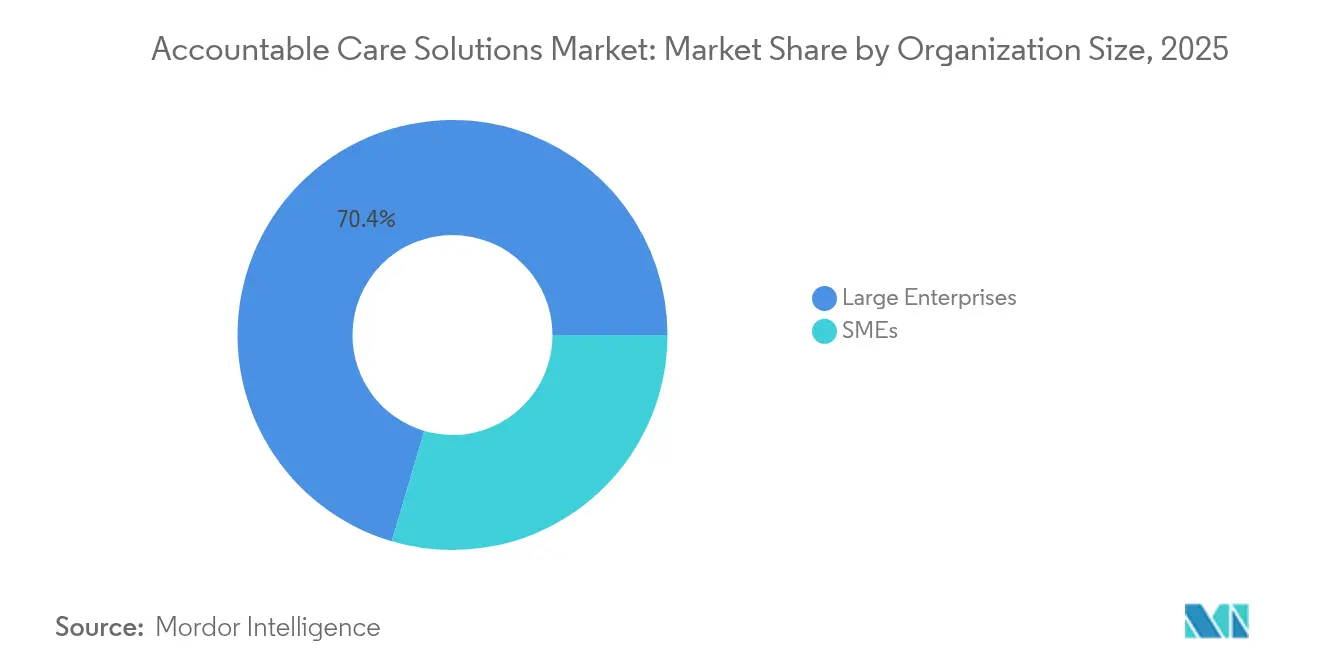
- By organization size, large enterprises held a 70.44% share of the accountable care solutions market in 2025; SMEs are expanding at a 12.31% CAGR between 2026 and 2031.
- By end-user, healthcare providers held a 60.12% share of the accountable care solutions market size in 2025, and healthcare payers are projected to grow at a 12.00% CAGR to 2031.
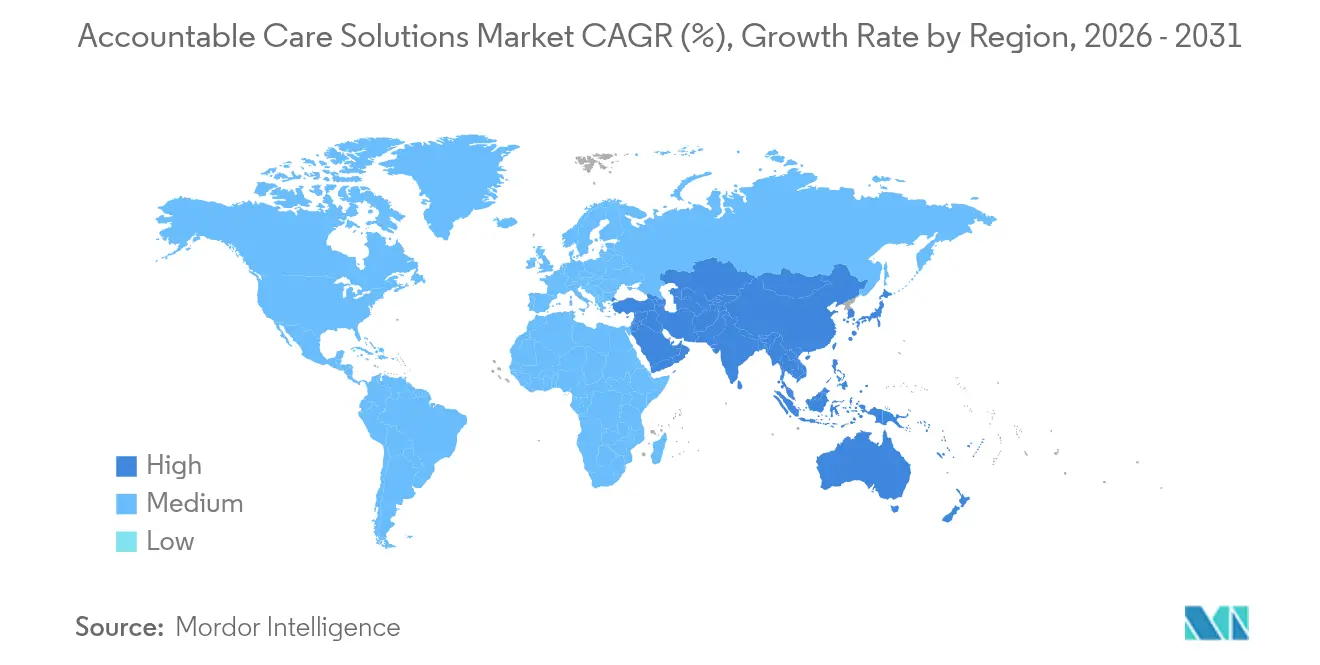
- By geography, North America led with 42.10% revenue share in 2025; Asia-Pacific is set to grow at a 12.34% CAGR to 2031.
Note: Market size and forecast figures in this report are generated using Mordor Intelligence’s proprietary estimation framework, updated with the latest available data and insights as of 2026.
Market Trends and Insights
Drivers Impact Analysis of Accountable Care Solutions Market*
| Driver | (~) % Impact on CAGR Forecast | Geographic Relevance | Impact Timeline |
|---|---|---|---|
| Mandatory value-based-care and reimbursement reforms | +3.2% | North America core, expanding to APAC & Europe | Long term (≥ 4 years) |
| Growing volumes of healthcare big-data analytics | +2.8% | Global, with concentration in North America & Europe | Medium term (2-4 years) |
| Need to curb escalating healthcare expenditures | +2.1% | Global | Long term (≥ 4 years) |
| Rapid migration toward scalable cloud-first IT stacks | +1.9% | Global, led by North America & APAC | Short term (≤ 2 years) |
| AI-powered social-determinants risk-stratification use cases | +1.4% | North America & Europe, emerging in APAC | Medium term (2-4 years) |
| Provider-enablement venture platforms integrating tech + MSO services | +1.1% | North America core, selective APAC markets | Medium term (2-4 years) |
| Source: Mordor Intelligence | |||
Mandatory value-based-care and reimbursement reforms
CMS now counts 476 accountable care organizations (ACOs) that collectively manage care for over 11.2 million Traditional Medicare beneficiaries[1], underscoring a clear shift to outcome-linked payment. New programs such as the ACO Primary Care Flex Model provide upfront investment for primary-care modernization in underserved communities. Commercial insurers and Medicaid programs replicate these models, broadening the accountable care solutions market beyond Medicare. The ACO REACH framework adds equity mandates alongside cost controls, signaling a mature stage for value-based care. Providers that cling to fee-for-service see shrinking margins as reimbursement pivots toward shared savings and capitated payments.
Growing volumes of healthcare big-data analytics
A large percent of hospitals[2] already rely on predictive models to inform clinical decisions, and healthcare AI funding climbed to USD 11 billion in 2024 with most capital aimed at administrative automation. Modern analytics platforms ingest claims, clinical, and social-determinant data to forecast risk and close care gaps in near real time. For accountable entities, earlier identification of high-risk patients trims avoidable admissions, improving both quality scores and shared-savings potential. As datasets grow richer, real-time dashboards help clinicians prioritize outreach, reinforcing the value proposition of integrated platforms within the accountable care solutions market.
Need to curb escalating healthcare expenditures
Automation could cut USD 200 billion–USD 360 billion in healthcare spending by streamlining administrative tasks, according to industry estimates. Seventy-four percent of hospital chief financial officers have adopted automated revenue-cycle workflows to offset labor shortages and uncompensated care pressures. Predictive denials management and centralized referral systems reduce leakage and unnecessary tests. For organizations in shared-savings contracts, avoiding high-cost acute events is essential, making accountable care platforms a frontline tool in cost-containment strategies.
Rapid migration toward scalable cloud-first IT stacks
Seventy-two percent of provider executives report positive results from cloud migration, citing superior performance for AI models and easier interoperability. Real-time image analysis on cloud infrastructure has cut radiology read times by 40% in early deployments. Smaller hospitals gain access to enterprise-grade analytics without large capital budgets, supporting faster uptake of accountable care solutions among SMEs. Multicloud-by-design strategies help providers match workloads to optimal environments while maintaining compliance with HIPAA and regional data-sovereignty rules.
Restraints Impact Analysis of Accountable Care Solutions Market*
| Restraint | (~) % Impact on CAGR Forecast | Geographic Relevance | Impact Timeline |
|---|---|---|---|
| Data-privacy & cyber-security vulnerabilities | -1.8% | Global, acute in North America & Europe | Short term (≤ 2 years) |
| High CAPEX/OPEX for legacy-to-digital transformation | -1.3% | Global, pronounced in established markets | Medium term (2-4 years) |
| Fragmented interoperability across disparate systems | -1.1% | Global, severe in North America & Europe | Medium term (2-4 years) |
| Clinician burnout due to EHR workload & alert-fatigue | -0.9% | Global, concentrated in North America & Europe | Short term (≤ 2 years) |
| Source: Mordor Intelligence | |||
Data-privacy & cyber-security vulnerabilities
Healthcare experienced 677 large-scale breaches in 2024, exposing records of 182.4 million people and raising hesitation around expansive cloud deployments. The Change Healthcare ransomware incident alone affected more than 100 million patients and highlighted systemic risk across interconnected platforms. Average breach costs reached USD 4.88 million, amplifying liability concerns. Regulators responded by finalizing new interoperability and cybersecurity standards that impose penalties for lax security, forcing vendors to fortify defenses.
High CAPEX/OPEX for legacy-to-digital transformation
Three-quarters of health-system executives admit current budgets fall short of full digital transformation needs despite listing it as a priority. Integrating modern care coordination modules with entrenched EHRs demands workflow redesign, staff retraining, and dual-system maintenance. Nearly half of clinicians still cannot seamlessly access outside patient data, underscoring additional integration costs. The drawn-out transition strains operating margins, yet remains unavoidable for organizations seeking to thrive in the accountable care solutions market.
*Our forecasts treat driver/restraint impacts as directional, not additive. The impact forecasts reflect baseline growth, mix effects, and variable interactions.
Accountable Care Solutions Market Segment Analysis
By Component:
Platform consolidation drives solutions dominanceSolutions generated 61.62% of 2025 revenue, showing that organizations favor unified platforms linking clinical, financial, and population-health functions. Services will outpace software with a 12.76% CAGR because expert training, workflow redesign, and ongoing optimization are indispensable once platforms go live. The accountable care solutions market size for services is projected to widen as ACOs seek external help to fine-tune risk-adjustment algorithms and regulatory reporting. Epic Systems’ addition of 176 facilities in 2024 illustrates a consolidation wave toward comprehensive platforms.
Services growth reflects recognition that software alone cannot deliver outcomes without sustained change management. Health systems contract for analytics-as-a-service, virtual command centers, and managed population-health operations. These arrangements keep capital budgets lean and shift accountability for performance metrics to solution partners, reinforcing the trajectory of the accountable care solutions market

By Application:
Population management takes the leadElectronic health records hold 28.96% of 2025 revenue, anchoring data capture for every downstream workflow. Yet population & care management will rise at a 13.08% CAGR to 2031, becoming the primary engine of the accountable care solutions market. Kaiser Permanente’s decision to deploy Innovaccer’s population-health platform across California underscores this pivot toward proactive coordination.
Analytics, revenue-cycle automation, and patient-engagement modules also gain momentum as organizations prioritize end-to-end visibility into risk and resource use. AI-based revenue-cycle tools are already live in a large number of hospitals, streamlining pre-authorization and reducing denials. These interconnected applications cement EHRs as a foundation but push new spending toward high-impact population-health workflows that drive value-based reimbursement success within the accountable care solutions market.
By Deployment Mode:
Cloud adoption acceleratesCloud-based options controlled 63.35% of 2025 spending, and the segment will expand at a 11.88% CAGR as AI models demand scalable compute resources. The accountable care solutions market share for cloud platforms is set to widen because compliance features, once perceived as a weakness, now meet or exceed on-premise security standards. On-premise deployments persist in a minority of institutions with immutable data-sovereignty mandates, while hybrid architectures permit sensitive workloads to remain on site.
Providers moving to multicloud-by-design reduce vendor lock-in and right-size capacity for imaging, claims, or real-time alerting. Early adopters report tangible gains: AI-enhanced imaging workflows cut reading times and reduced re-scans, illustrating how cloud deployment translates into operational efficiencies that strengthen business cases for further investment in the accountable care solutions market.
By Organization Size:
SMEs narrow the digital divideLarge enterprises contributed 70.44% of 2025 revenue, but SMEs will record the faster 12.31% CAGR as subscription-based models erase historic barriers. Cloud delivery removes the need for data-center buildouts, letting regional hospitals and physician groups adopt sophisticated tools at predictable costs. The accountable care solutions market size allocated to SMEs rises as payer contracts increasingly include smaller provider networks in shared-savings arrangements.
For SMEs, preconfigured analytics dashboards, low-code care-management workflows, and vendor-managed cybersecurity enable rapid time-to-value. Large health systems continue to invest in bespoke integrations spanning acute, post-acute, and virtual-care settings. Over time, convergence in functional capabilities narrows the performance gap, promoting more uniform adoption of accountable care principles across the healthcare landscape.
By End-User:
Payers intensify platform spendingHealthcare providers still dominate with 60.12% of 2025 sales, reflecting their frontline care-delivery role. Payers, however, will accelerate at 12.00% CAGR as they shoulder greater responsibility for population health, especially in Medicare Advantage and Medicaid managed-care lines. Optum’s analytics-heavy offerings and Transcarent’s January 2025 acquisition of Accolade for USD 621 million highlight payer moves into integrated navigation and care-coordination.
Payer platforms now ingest multi-payer claims, benefit data, and social-risk indicators to coordinate directly with provider partners, a capability essential for downside-risk contracts. For the accountable care solutions market, this trend expands total addressable spend and pushes vendors to create features that satisfy both clinical and actuarial requirements.
Geography Analysis
North America Accountable Care Solutions Market
North America generated 42.10% of global revenue in 2025, supported by CMS rules that already place 53.4% of Traditional Medicare members under accountable care contracts. Regional growth of 10.82% CAGR through 2031 represents a shift from initial build-out to optimization. Cloud migration, AI-embedded population health, and equity-focused models such as ACO REACH drive refresh cycles of existing platforms. Large systems like Highmark Health now link Epic and Google Cloud for administrative and clinical analytics, demonstrating ecosystem-level collaboration.
APAC Accountable Care Solutions Market
Asia-Pacific is the fastest-growing territory at 12.34% CAGR, propelled by national digital-health blueprints and startup funding. Southeast Asia alone projects USD 6.1 billion in digital-health revenue for 2024, aided by Indonesia’s Halodoc closing a USD 100 million round. Governments in Thailand, Australia, and Singapore inject capital into AI, telemedicine, and IoT monitoring, creating fertile ground for vendors that localize solutions to diverse regulatory settings. Cloud flexibility is critical because data sovereignty rules vary widely across the region.
EMEA and South America Accountable Care Solutions Market
Europe expands at 11.33% CAGR as integrated-care mandates and GDPR compliance shape procurement criteria. Germany’s national cloud strategy for healthcare shows how public-sector guidance accelerates adoption while setting strict data-sovereignty bars. Meanwhile, the Middle East & Africa advance at 11.90% CAGR, reflecting sovereign investments in hospital digitization and national health-information exchanges. South America grows at 11.59% CAGR as countries modernize insurance schemes and subsidize telehealth, using accountable care principles to manage chronic-disease burdens. The geographic spread proves that, while regulatory frameworks differ, the accountable care solutions market meets a common goal: better outcomes at lower cost.
Competitive Landscape
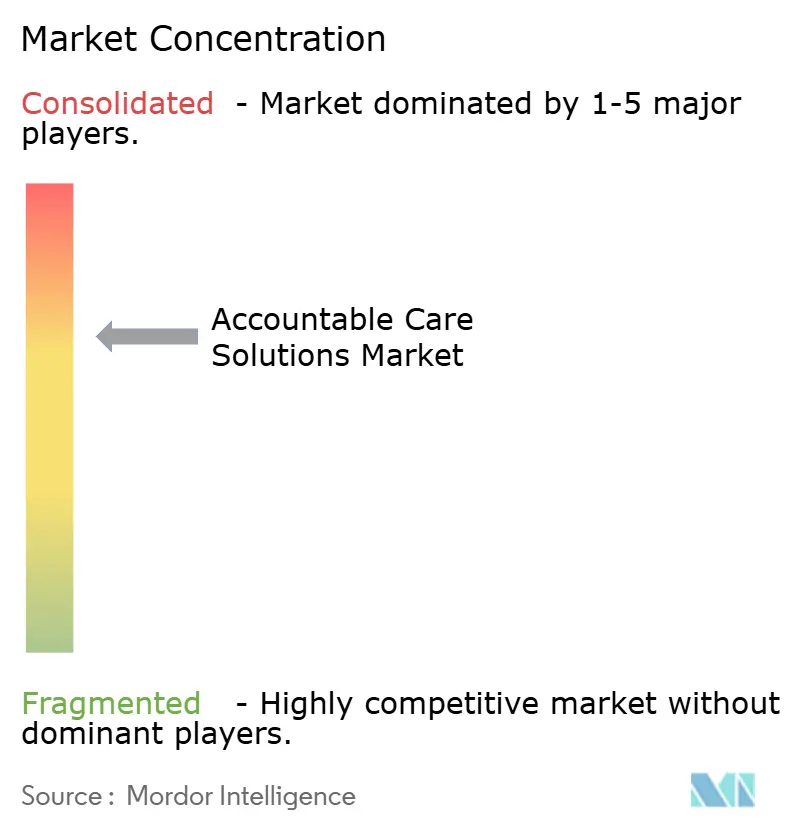
The accountable care solutions market is moderately concentrated. Epic Systems widened its lead in 2024 by winning 176 additional hospitals as Oracle Health ceded 74 sites, signaling provider preference for deeply integrated platforms. UnitedHealth Group scales analytics through Optum but now faces increased antitrust and cybersecurity scrutiny after high-profile breaches.
IBM, Oracle, Innovaccer, Allscripts, and point-solution specialists compete on AI performance, user-experience simplicity, and interoperability standards. Incumbents bundle care-management, risk-adjustment, and revenue-cycle modules into unified suites, locking in long-term clients. Disruptors target niches such as social-determinants analytics or small-provider enablement, often leveraging cloud marketplaces for rapid distribution.
Strategic partnerships abound: AI companies integrate with EHR vendors, and payers invest directly in platform developers to customize features for shared-risk contracts. Success metrics increasingly center on measurable shared savings, hospital readmission rates, and patient engagement scores—quantitative proof that platforms deliver value in the accountable care solutions market.
Accountable Care Solutions Industry Leaders
-
CVS Health Corporation
-
Epic Systems Corporation
-
Oracle Corporation
-
UnitedHealth Group
-
Veradigm, Inc.
- *Disclaimer: Major Players sorted in no particular order
Accountable Care Solutions Market Companies Covered in this Report
- Aledade, Inc.
- Arcadia Solutions, LLC
- Athenahealth
- Conifer Health Solutions
- CVS Health
- eClinicalWorks
- Epic Systems
- Evolent Health LLC
- Exlservice Holdings, Inc.
- Health Catalyst, Inc.
- Lumeris, Inc.
- Mckesson
- Medecision, Inc.
- Merative L.P.
- Oracle
- Persivia, Inc.
- Signify Health, Inc.
- United Health Group
- Veradigm, Inc.
- ZeOmega, Inc.
Market Opportunities and Future Outlook
CMS policy direction keeps expanding the addressable workflow for accountable care platforms, with the stated goal to place 100% of Traditional Medicare beneficiaries in a care relationship with accountability for quality and total cost of care by 2030. Near-term whitespace is concentrated in products that help ACOs operationalize program changes and measurement complexity, including ACO REACH Performance Year 2026 updates (for example, the Quality Withhold increase to 5% and financial methodology refinements) and the transition to the V28 HCC risk adjustment model at full weight in PY 2026. These shifts raise demand for configurable quality reporting, evidence capture, risk documentation, and audit-ready data pipelines that connect EHR, claims, and social-determinants datasets.
Cloud-first modernization also intersects with security-hardening as providers and payers scale analytics while managing breach exposure and compliance. That creates room for vendors and service partners delivering interoperable, cloud-native deployments with embedded cybersecurity controls, along with managed services that reduce implementation burden for organizations with constrained transformation budgets. Procurement attention on automation, workflow orchestration, and interoperability features is further supported by CMS FY 2026 priorities that emphasize administrative efficiency through IT modernization, including AI and cloud-enabled digital infrastructure, particularly in shared-savings and downside-risk contracts.
Recent Industry Developments in Accountable Care Solutions Market
- March 2026: CVS Health completed the sale of its Medicare Shared Savings Program (MSSP) business to Wellvana and terminated its ACO REACH contract. The transaction repositions CVS away from directly operating certain Medicare accountable care arrangements and toward partner-driven execution, which can shift demand toward specialized value-based care enablement firms.
- March 2026: OCHIN and Community Care Cooperative (C3) expanded a Medicare ACO solution to include additional rural and safety-net providers, extending Epic EHR insights into value-based care workflows. The expansion broadens standardized analytics, reporting, and care-management workflows to support participation in Medicare risk arrangements.
- May 2024: The Change Healthcare ransomware incident disrupted healthcare payments and claims operations, affecting more than 100 million patients. The event increased buyer scrutiny of connected platforms, with a stronger emphasis on cybersecurity controls, resilience, and vendor risk management across accountable care and population-health deployments.
Accountable Care Solutions Market Report Scope and Research Methodology
Market Definition and Coverage
For this study, the accountable care solutions market covers the software and related services used by healthcare payers and providers to run value-based care programs, coordinate care, manage risk, and track quality and outcomes across accountable networks.
Scope exclusions: Stand-alone wellness or fitness apps that do not support accountable care contracting or coordinated care workflows are excluded.
Segments Covered in This Report
- By Component
- Solutions
- Services
- By Application
- Electronic Health Records
- Healthcare Analytics
- Population & Care Management
- Revenue Cycle & Claims Management
- Payment & Risk Adjustment
- Health Information Exchange (HIE)
- Patient Engagement & Portals
- Other Applications
- By Deployment Mode
- Cloud-Based
- On-Premise
- Hybrid
- By Organization Size
- Large Enterprises
- SMEs
- By End-User
- Healthcare Providers
- Healthcare Payers
- By Geography
- North America
- United States
- Canada
- Mexico
- Europe
- Germany
- United Kingdom
- France
- Italy
- Spain
- Rest of Europe
- Asia-Pacific
- China
- India
- Japan
- Australia
- South Korea
- Rest of Asia-Pacific
- Middle East and Africa
- GCC
- South Africa
- Rest of Middle East and Africa
- South America
- Brazil
- Argentina
- Rest of South America
- North America
Data Sources, Market Sizing, and Validation
Desk Research
Desk research was used to set the market boundaries, identify the demand pool, and build initial assumptions that can be checked later in interviews. We leaned on public healthcare policy and utilization signals, such as CMS rulemaking and program participation information, CDC health statistics, and OECD health system indicators.
To understand digital health adoption and spending direction, we also reviewed sources such as ONC health IT updates, peer-reviewed journals in health services research, and relevant association publications. This was followed by company filings, investor presentations, and trusted press coverage. In parallel, a paid subscription covering company financials and another covering patents were referenced selectively to avoid missing smaller but fast-growing solution providers and to cross-check product direction. The sources listed here are illustrative, and many other public references were also used for data collection, cross-checks, and clarification.
Primary Interviews and Surveys
Primary inputs were collected through interviews and surveys with payer and provider executives, product and operations leaders, and implementation and analytics specialists. This helped translate the desk assumptions into realistic adoption and pricing ranges. Coverage was balanced across APAC, EMEA, and the Americas, and gaps were closed where public data is thin, such as typical contract scope, integration effort, and service attach rates.
Distribution of primary research fieldwork respondents
| Company type | Respondent position | Region |
|---|---|---|
| Top tier: 25% | CXOs: 14% | APAC: 44% |
| Mid tier: 61% | Functional/Unit leaders: 42% | EMEA: 34% |
| Smaller Players: 14% | Managers: 44% | Americas: 22% |
Market-Sizing & Forecasting
Sizing starts with a top-down demand-pool build that reconstructs value-based care activity from public program direction and adoption signals, then converts that activity into spend using solution penetration and pricing ranges. The model is corroborated with selective bottom-up approximations, where revenues are sanity checked through sampled disclosures, channel conversations, and an ASP times volume logic for software plus service attachments.
Key inputs used in the model include the pace of value-based care enrollment and contracts, ACO and risk-sharing program participation trends, provider consolidation and network scale, cloud deployment share for care and analytics platforms, and typical implementation plus ongoing managed-service mix. Because service revenue can be bundled or reported differently, we use interview-based ratios to split software versus services and to handle gaps where direct disclosures are limited.
For forecasting, scenario analysis is used with a base case anchored to expected policy continuation and measured adoption momentum, then adjusted using expert consensus on timing of procurement cycles, renewal behavior, and pricing progression. Where signals conflict, conservative ranges are applied first, and only tightened after follow-up validation with domain respondents.
Data Validation & Update Cycle
Outputs are checked against independent signals, such as reported value-based care participation, broader health IT spending direction, and observed contract activity, before results are finalized. When a segment or region shows an unexpected jump, the assumptions are reopened, the math is re-checked, and respondents are re-contacted if the variance cannot be explained through visible market events.
A multi-step internal review is followed so definitions, currency handling, and growth logic stay consistent across the model. The report is refreshed annually, and interim updates are made when material events occur, such as major policy shifts, large mergers, or sudden changes in reimbursement incentives. Before delivery, an analyst performs a fresh final pass so clients receive the latest updated view.
Mordor Intelligence's Accountable Care Solutions Market Size Versus Other Published Estimates
Published market sizes for accountable care solutions often do not match because sources count different components, anchor to different base years, and apply different assumptions for services versus software. Currency timing and the way multi-year contracts are recognized can also shift the reported value in a given year.
Stand-alone wellness or fitness apps sit outside Mordor Intelligence's scope, which narrows the spend pool to tools tied to accountable care contracting, risk performance, and outcomes reporting. That exclusion is one reason the numbers can diverge. Differences also come from how service revenue is treated, since some figures include only platform licenses, while others add implementation and ongoing support using fixed ratios that are not always checked with interviews.
Benchmark comparison
| Source | Market Size | Gaps in Research Methodology |
|---|---|---|
| Mordor Intelligence | USD 29.14 B (2026) | |
| Global Advisory A | USD 25.70 B (2024) | Uses an earlier base year and may capture a narrower revenue window that leans on platform revenue recognition, which can understate bundled services and longer implementation cycles. |
| Industry Publisher B | USD 29.02 B (2025) | Anchors the model to a different base year and forecast window, and the handling of service attachments and pricing progression is not clearly traceable to adoption and contract mix inputs. |
Looking across the table, most of the spread can be explained by year alignment and what gets counted as recurring platform revenue versus implementation and ongoing support. The modeling steps remain easier to reproduce when assumptions are tied to visible adoption signals and then checked with primary feedback on contract scope and service mix.
Key Questions Answered in the Report
What regulatory factor is most compelling providers to adopt accountable care solutions?
CMS policies that tie reimbursement to patient outcomes are driving providers toward platforms that coordinate care and document quality performance.
How do cloud-native deployments change the implementation strategy for accountable care platforms?
Cloud delivery supplies on-demand computing for AI workloads and reduces capital spending on data centers, making advanced functionality accessible to organizations of all sizes.
Why are health insurers stepping up investment in accountable care technology?
Payers leverage these platforms to collaborate with provider networks, manage downside-risk contracts, and embed member engagement tools that improve care continuity.
What integration hurdle most often delays digital transformation projects in healthcare?
Aligning new care-coordination modules with entrenched EHR workflows requires significant change-management and staff retraining efforts.
How does big-data analytics strengthen population health programs?
Predictive algorithms surface high-risk patients sooner, enabling care teams to intervene before conditions escalate into costly acute events.
Which cybersecurity concern weighs heaviest on cloud adoption decisions?
The rise of sophisticated ransomware attacks has heightened demand for vendors that offer real-time threat monitoring and stringent data-protection protocols.