
Abutment Implants Market Size and Share
Market Overview
| Study Period | 2020 - 2031 |
|---|---|
| Market Size (2026) | USD 1.20 Billion |
| Market Size (2031) | USD 1.99 Billion |
| Growth Rate (2026 - 2031) | 10.75 % |
| Fastest Growing Market | North America |
| Largest Market | Asia-Pacific |
| Market Concentration | Medium |
Major Players *Disclaimer: Major Players sorted in no particular order Image © Mordor Intelligence. Reuse requires attribution under CC BY 4.0. | |
Abutment Implants Market Analysis by Mordor Intelligence
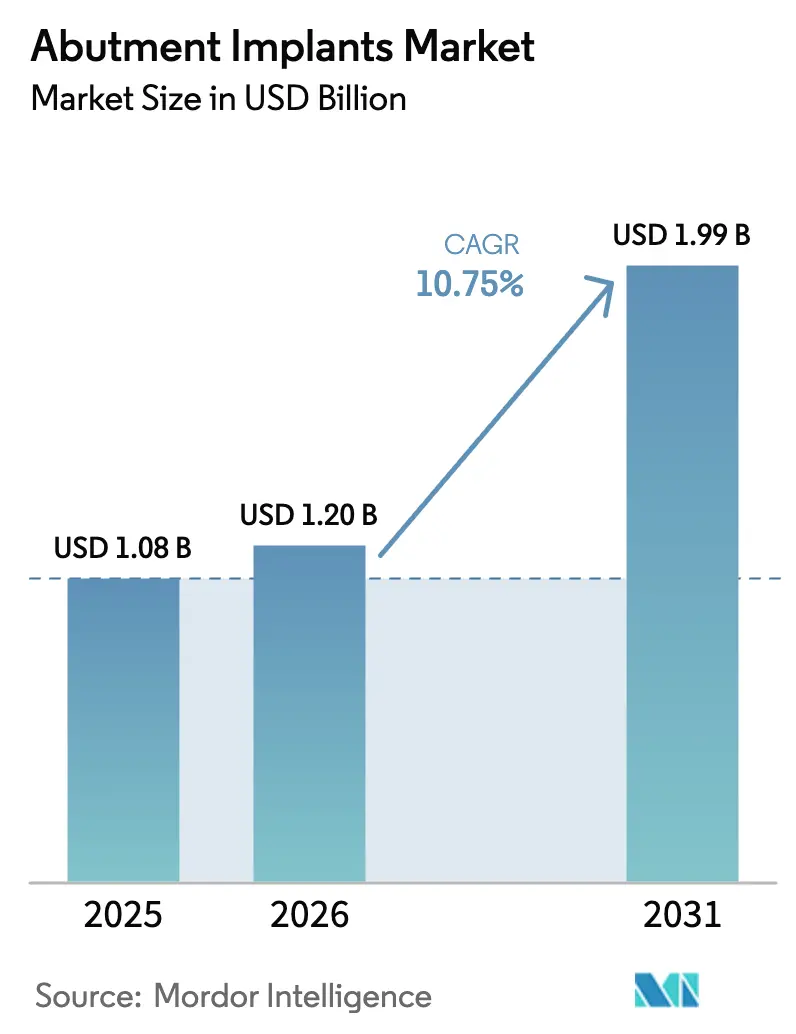
The Abutment Implants Market size was valued at USD 1.08 billion in 2025 and is estimated to grow from USD 1.20 billion in 2026 to reach USD 1.99 billion by 2031, at a CAGR of 10.75% during the forecast period (2026-2031).
Elevated life expectancy, the growing popularity of metal-free anterior restorations, and rapid uptake of digital dentistry are widening the patient pool while shortening treatment timelines. Leading manufacturers now prioritize vertically integrated production and proprietary software ecosystems to lock in recurrent consumable sales, yet contract laboratories are simultaneously gaining bargaining power as design authority shifts away from chairside clinicians. Raw-material inflation of 12%–18% during 2024 compressed gross margins for titanium and zirconia suppliers, further encouraging diversification into polymer‐based abutments. In parallel, AI-assisted design tools have cut custom-abutment turnaround to 48 hours, encouraging same-day prosthetic delivery that differentiates urban clinics and spurs premium pricing.
Key Report Takeaways
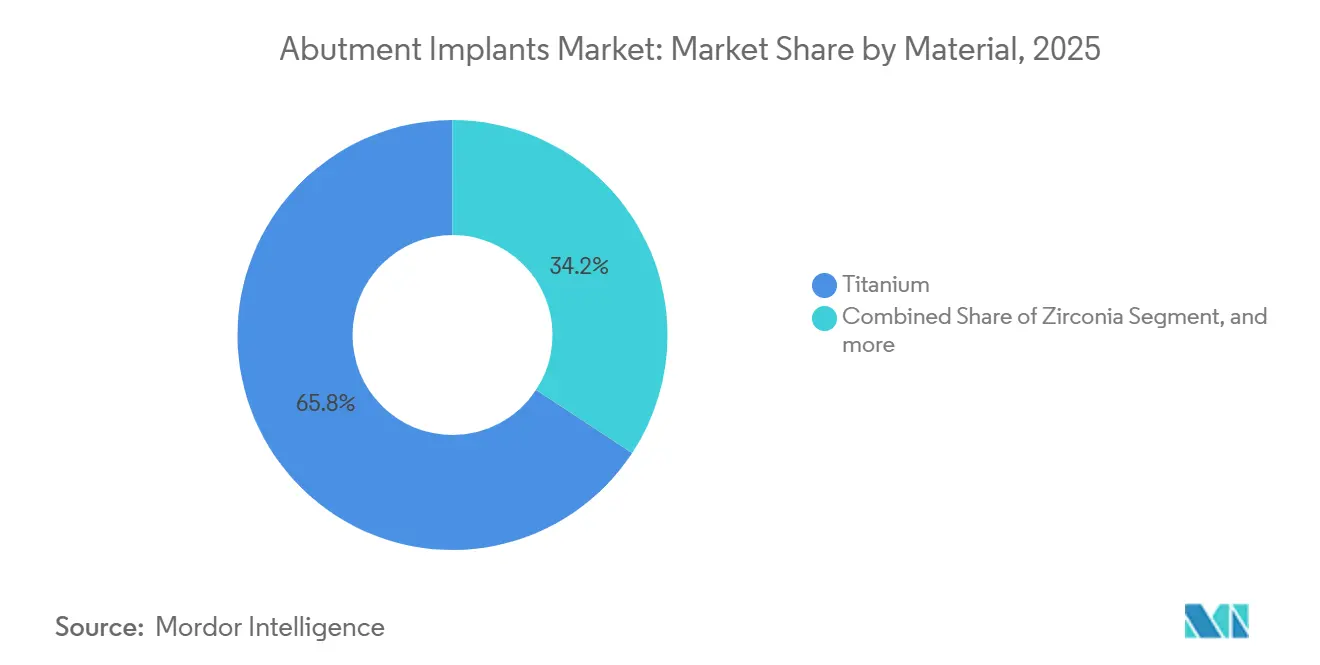
- By material, titanium led with 65.76% of abutment implants market share in 2025, whereas zirconia is set to advance at a 12.65% CAGR through 2031.
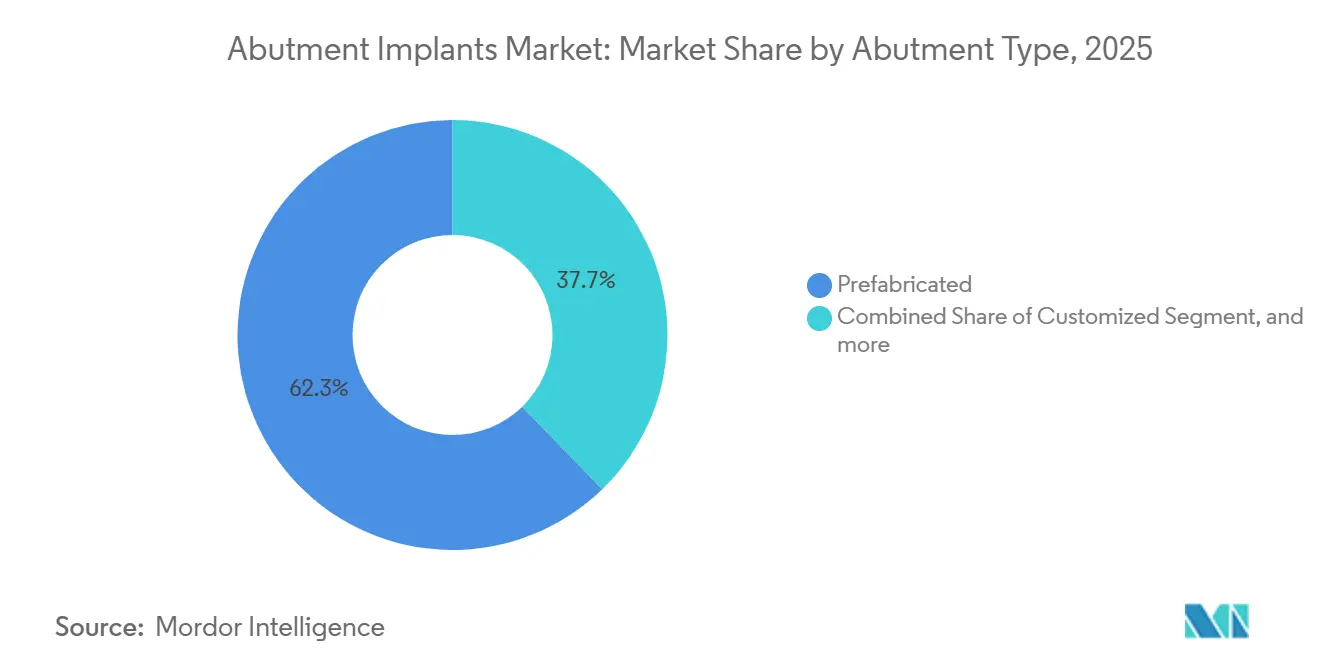
- By abutment type, prefabricated units held 62.26% share of the abutment implants market size in 2025 and customized variants are projected to grow at 13.44% CAGR to 2031.
- By end user, dental clinics captured 46.43% revenue share in 2025, while dental laboratories are forecast to expand at a 13.65% CAGR between 2026 and 2031.
- By geography, North America dominated with 43.54% of abutment implants market share in 2025; Asia-Pacific is the fastest growing region at an 11.54% CAGR through 2031.
Note: Market size and forecast figures in this report are generated using Mordor Intelligence’s proprietary estimation framework, updated with the latest available data and insights as of January 2026.
Market Trends and Insights
Drivers Impact Analysis of Abutment Implants Market*
| Driver | (~) % Impact on CAGR Forecast | Geographic Relevance | Impact Timeline |
|---|---|---|---|
| Demographic Shift Toward Older Population | +2.1% | Global, with concentration in Japan, South Korea, Germany, and Italy | Long term (≥ 4 years) |
| Rising Demand For Aesthetic Restorations | +1.8% | North America, Western Europe, urban Asia-Pacific | Medium term (2-4 years) |
| Rapid Adoption Of Digital Dentistry Technologies | +2.4% | North America, Europe, Asia-Pacific core markets | Short term (≤ 2 years) |
| Expansion Of Insurance Coverage For Implant Procedures | +1.6% | United States (ACA expansion states), select European Union markets | Medium term (2-4 years) |
| Integration Of Artificial Intelligence In Custom Abutment Design | +1.3% | North America, Western Europe, Japan, South Korea | Short term (≤ 2 years) |
| Proliferation Of Low-Cost Polymer And PEEK Abutments In Emerging Markets | +1.2% | India, Southeast Asia, Latin America, Middle East & Africa | Medium term (2-4 years) |
| Source: Mordor Intelligence | |||
Demographic Shift Toward Older Population
The global cohort aged 65 plus is expected to reach 1.6 billion by 2050, driving a sustained need for fixed restorations as edentulism rates remain 15%–25% in this group. China already hosts 280 million citizens aged 60 and over, while Japan’s super-aged society translates into per-capita implant use triple the world average. Older patients increasingly prefer multi-unit solutions that offer immediate function and fewer surgical visits, supporting premium pricing in the abutment implants market. Urban households earning above USD 30,000 annually further accelerate elective spending, particularly on full-arch restorations that require multiple abutments. Manufacturers respond with angulated multi-unit designs that simplify prosthesis delivery for mobility-impaired seniors.
Rising Demand for Aesthetic Restorations
Cosmetic dentistry revenue in the United States exceeded USD 18 billion in 2024, with anterior implants representing 35% of volume as patients prioritize smile esthetics. Zirconia abutments, priced 40%–60% above titanium, have gained momentum by eliminating gray metal shine through thin gingiva. Social-media influencers openly documenting smile makeovers normalize implant procedures for Millennials and Generation Z, channeling new demand into high-volume practices that negotiate bulk discounts while still growing average selling prices in the abutment implants market. Custom abutments that tailor emergence profiles now dominate anterior cases, improving papilla regeneration and soft-tissue support.
Rapid Adoption of Digital Dentistry Technologies
U.S. intraoral scanner penetration jumped from 48% in 2023 to 57% in 2024, trimming impression failures and enabling real-time abutment evaluation. Dental 3D printing, valued at USD 450.75 million in 2024, is projected to reach USD 1.12 billion by 2032, with abutment production comprising 22% of print jobs. Straumann’s iEXCEL platform integrates planning, design, and milling into a single interface, reinforcing ecosystem lock-in and securing consumable sales over the forecast period. Open-architecture rivals instead emphasize interoperability, dividing the competitive field along software-hardware alignment and influencing procurement preferences within the abutment implants market.
Expansion of Insurance Coverage for Implant Procedures
The April 2024 CMS rule allows U.S. states to add adult dental benefits to ACA plans starting in 2027, potentially covering 15–20 million new candidates for implant therapy. Private payers such as UnitedHealthcare now reimburse 50% of abutment costs after a waiting period, nudging bridge-first patients toward implant solutions. Although annual maximums still leave 60%–70% of treatment out of pocket, even partial coverage can expand the abutment implants market by 8%–12% in mature economies. Medical tourism fills reimbursement gaps elsewhere, especially in India where complete implant packages cost one-third of Western prices.
Restraints Impact Analysis of Abutment Implants Market*
| Restraint | (~) % Impact on CAGR Forecast | Geographic Relevance | Impact Timeline |
|---|---|---|---|
| High Treatment Cost And Limited Reimbursement In Developing Regions | -1.9% | India, Southeast Asia, Sub-Saharan Africa, Latin America | Long term (≥ 4 years) |
| Insufficient Skilled Dental Implant Workforce | -1.4% | United States, United Kingdom, Germany, rural Asia-Pacific | Medium term (2-4 years) |
| Increasing Incidence Of Peri-Implant Diseases | -1.1% | Global, with higher rates in smokers and diabetic populations | Medium term (2-4 years) |
| Supply Chain And Sustainability Challenges For Titanium And Zirconia | -0.8% | Global, acute in regions dependent on single-source suppliers | Short term (≤ 2 years) |
| Source: Mordor Intelligence | |||
High Treatment Cost and Limited Reimbursement in Developing Regions
Complete implant therapy costs USD 2,500–5,000 in developed markets but only USD 600–1,200 in India and Turkey, still unaffordable for vast populations earning below USD 2,000 per capita[1]World Bank, “GDP per Capita Indicators,” worldbank.org . Public schemes in Brazil and South Africa exclude implants, confining adoption to self-pay urban elites. Micro-credit options exist yet default rates of 8%–12% deter widespread rollout, constraining addressable demand for the abutment implants industry in lower-income nations.
Insufficient Skilled Dental Implant Workforce
The United States will require an extra 10,000 dentists by 2030, but specialty training pipelines graduate just 350 prosthodontists per year. Europe confronts similar shortages amid aging clinician pools and restrictive cross-border licensing. Limited expertise raises procedure costs and elongates waiting lists, slowing growth of the abutment implants market in underserved areas despite latent demand.
*Our forecasts treat driver/restraint impacts as directional, not additive. The impact forecasts reflect baseline growth, mix effects, and variable interactions.
Abutment Implants Market Segment Analysis
By Material:
Zirconia Gains on Aesthetic ImperativeZirconia will grow at a 12.65% CAGR, outpacing the broader abutment implants market as patients accept 40%–60% premiums for translucency that eliminates the gray shine of titanium in the smile zone. Titanium retained 65.76% share in 2025 due to decades of posterior load success and compatibility with the installed base. PEEK addresses low-income needs, especially in India and Southeast Asia, yet remains a niche area with scant long-term evidence. Hybrid metal-ceramic laminates aim to combine strength and esthetics but face multi-year regulatory hurdles before influencing the abutment implants market.
Titanium’s ductility still dominates screw-retained full-arch protocols by preventing fracture under torque, while zirconia thrives in anterior cementless workflows that favor soft-tissue health. Polymer uptake sits at the intersection of affordability and radiolucency advantages although limited color options confine it to non-esthetic sites. Manufacturers continue R&D into surface textures that reduce bacterial adhesion, yet any breakthrough faces strict biocompatibility trials before reshaping the abutment implants market share.


By Abutment Type:
Customization Accelerates with Digital WorkflowsCustomized abutments are forecast to expand 13.44% CAGR as intraoral scanning and AI design platforms slash delivery to 48 hours, freeing clinic capital and enabling same-day smiles. Prefabricated units still held 62.26% share in 2025 because of ready inventory, lower unit cost, and simplicity in posterior cases. Multi-unit abutments, critical for All-on-4-style rehabilitations, command USD 200–400 per piece and rely on precision machining, which narrows supplier pools.
Clinicians adopt definitive abutment placement during initial surgery, shrinking the role of healing abutments, reducing total component spend per case, and raising value for high-margin custom parts. Chinese-made prefabs priced 60% below Western brands pressure loyalty in price-sensitive regions, but established players defend share with digital workflows that integrate seamlessly into practice management ecosystems across the abutment implants market.
By End-User Facility:
Laboratories Gain Design AuthorityDental laboratories will post a 13.65% CAGR through 2031 as design control migrates from chairside clinicians to CAD technicians who manipulate margin lines and emergence profiles. Dental clinics retained 46.43% share in 2025 as primary surgical sites but increasingly outsource design, concentrating on placement and final torque. Hospitals manage medically complex cases, while academic centers shape future product innovation rather than immediate volume.
Laboratories in tier-2 cities harness subscription AI platforms for USD 500–1,200 monthly, enabling 30–40 abutment designs per day and increasing throughput by 8x. Clinics benefit from reduced chairside adjustments, but laboratories capture a larger slice of abutment implants market revenue by selling high-precision custom pieces directly to dentists.
Geography Analysis
North America Abutment Implants Market
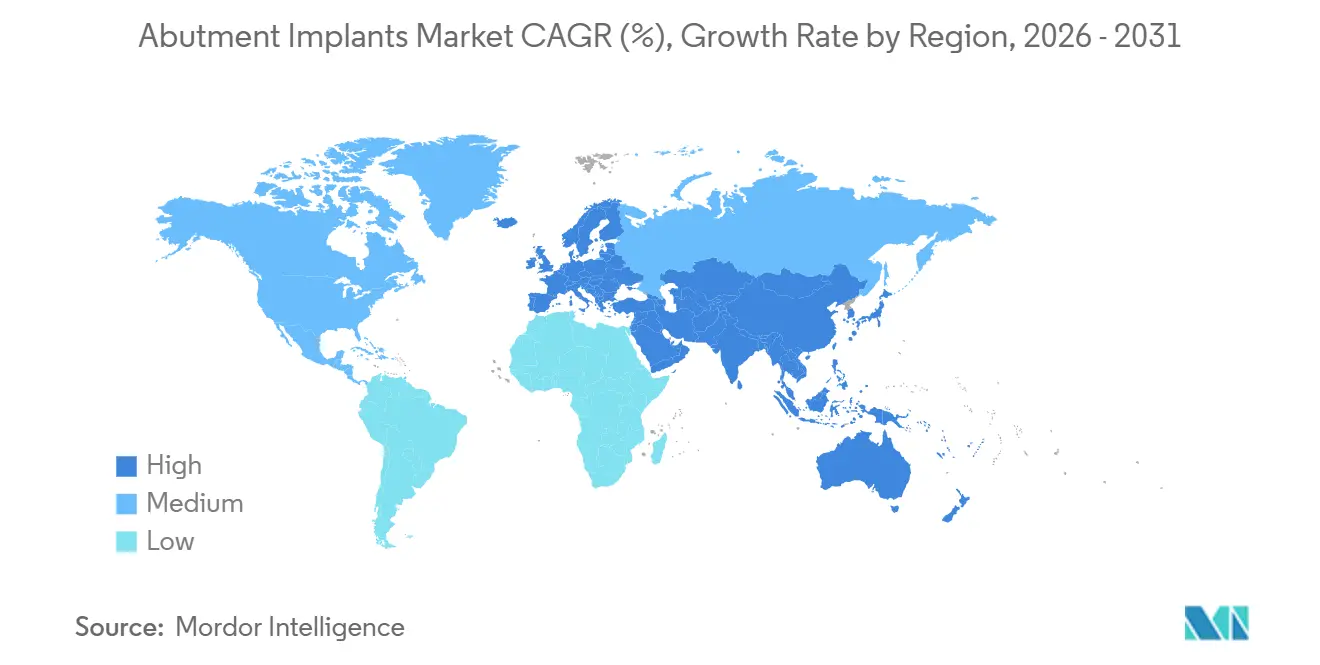
North America accounted for 43.54% of global revenue in 2025, driven by about 5.5 million annual placements in the United States. Consolidation of Dental Service Organizations, now controlling 64% of U.S. practice revenue, unlocks volume-rebate deals but squeezes supplier margins. The 2027 rollout of adult dental benefits under ACA could add up to 20 million eligible implant candidates, expanding multi-unit demand targeted at the Medicare-eligible segment[2]. Canada lags due to limited public reimbursement, whereas Mexican border clinics thrive on U.S. cross-border traffic, though many patients return home for restorative stages, limiting local abutment uptake.
APAC and South America Abutment Implants Market
Asia-Pacific leads growth at 11.54% CAGR as China’s 280 million seniors and India’s burgeoning middle class boost elective care spending. Japan’s implant density is triple the global average, yet mature penetration tempers incremental growth. South Korea’s >70% CAD/CAM penetration enables same-day abutments, exemplifying digital leadership. Domestic brands Osstem and MegaGen undercut Western prices by 30%–40%, prompting Straumann to open its 2026 Neodent facility in Brazil to replicate cost advantages regionally, but it still faces fierce local competition across Asia-Pacific.
Europe Abutment Implants Market
Europe ranks second by value, with Germany alone placing 1.3 million implants in 2024 under a co-payment regime that covers 50% of standard prosthetics but excludes fixtures and abutments. The EU Medical Device Regulation imposes strict post-market surveillance, favoring established manufacturers who can absorb compliance costs. Eastern Europe attracts budget-minded Western Europeans for discounted treatments, yet language and quality variability limit the flow to border regions, capping gains in the abutment implants market.
MEA and South America Abutment Implants Market
The Middle East & Africa and South America remain nascent, with penetration under 5% among edentulous populations. GCC states support premium clinics but generate modest unit volumes. Brazil dominates South America; Straumann’s Brazilian plant should secure supply chain resilience and price competitiveness despite local currency swings. South African private clinics cater to regional tourists, yet political volatility deters large-scale capital investment in the abutment implants market.

Regulatory Landscape
Endosseous dental implant abutments are regulated as Class II medical devices in the United States (21 CFR 872.3630, Product Code NHA). Most products reach the market through the FDA 510(k) pathway, along with associated special controls. In 2024, the FDA issued a Safety and Performance Based Pathway guidance (FDA-2024-D-4409) for endosseous dental implants and implant abutments, with a stated emphasis on objective performance criteria.
Recent clearances show continued submissions for abutment-related components, including February 2026 510(k) clearance for Creodent Hudson Valley (K251515), November 2025 clearance for Glidewell Laboratories (K252582), and April 2025 clearance for Dentsply Sirona (K250295) for a titanium bases system. In the European Union, implant abutments are typically classified as higher-risk devices (often Class IIb or Class III) under EU MDR 2017/745, which increases the burden for clinical evaluation and post-market clinical follow-up (PMCF) versus legacy directives. As CAD/CAM customization expands, regulatory interpretation around custom-made devices versus mass-produced components becomes more consequential for dental laboratories and manufacturers, supporting the need for ISO 13485-aligned quality systems and standardized mechanical testing such as ISO 14801 for implant-abutment assemblies.
Value Chain Analysis
The abutment implants value chain starts with medical-grade raw inputs, primarily titanium (commonly ASTM F67/F136) and zirconia blanks. These are then processed through precision machining or CAD/CAM manufacturing, surface finishing, cleaning, packaging, and sterile or non-sterile distribution. Lead times for titanium bar stock can extend to 12-16 weeks, and capacity constraints at ISO 13485-certified machining partners can create bottlenecks for both prefabricated and custom abutments, especially for multi-unit components that require tight tolerances.
Downstream, OEMs and dental technology platforms increasingly tie abutment sales to digital workflows (scan bodies, design software, milling or printing, and restorative materials), while distributors and DSOs shape product standardization. Recent announcements highlight how access and localization affect the chain: Dentsply Sirona renewed its U.S. dental technology distribution agreement with Patterson Dental in January 2026 to support continued reach for CEREC-linked restorative workflows, Straumann announced a CHF 60-80 million investment in its Villeret, Switzerland site and progressive localization for China at its Shanghai campus in June 2025, and ZimVie signed an exclusive distribution agreement with Osstem Implant for China in July 2025 to use Osstem's network across 90 cities.
Competitive Landscape
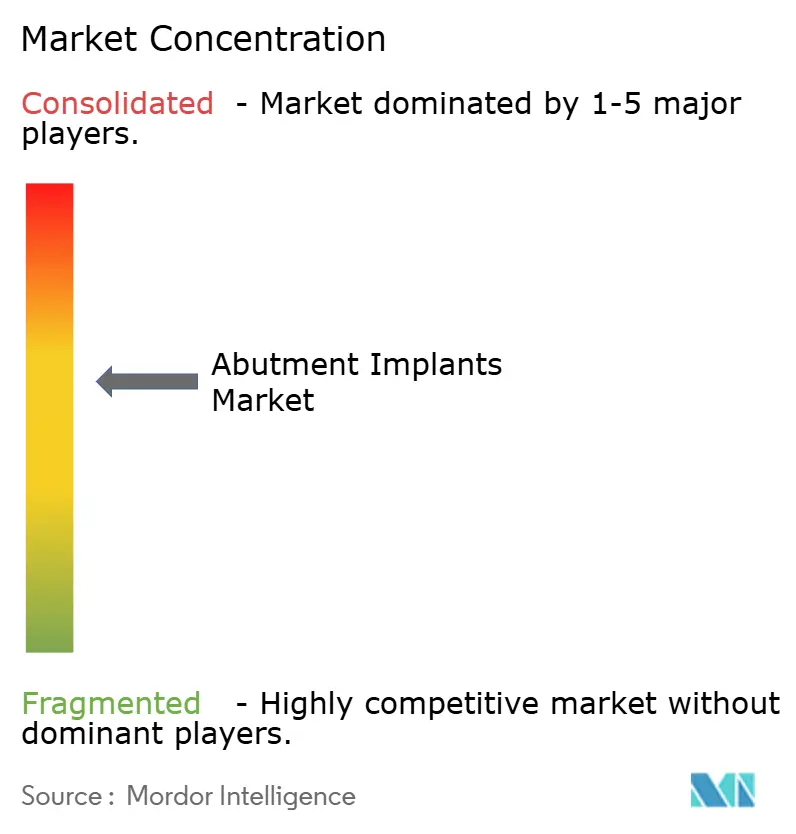
Straumann, Dentsply Sirona, Envista, and Zimmer Biomet together commanded roughly 55%–60% global revenue in 2025, reflecting moderate consolidation. Straumann posted CHF 585.5 million (USD 660 million) in implant sales in Q3 2024, driven by its iEXCEL digital ecosystem, which embeds recurring revenue streams. Dentsply Sirona suffered a slide to USD 158 million in the same quarter and wrote down USD 359 million in goodwill, underscoring the gap between digital leaders and laggards. Envista’s Nobel Biocare regained share in Europe through new launches, while Zimmer Biomet secured FDA clearance for a surface-enhanced TSV system, reducing healing time to eight weeks.
Regional challengers such as Osstem and MegaGen leverage 30%-plus price advantages in Asia-Pacific, whereas BioHorizons gains traction in North America with tapered threads optimized for soft bone. Polymer entrants focus on emerging markets where cost sensitivity is highest. Suppliers now bundle scanners, design software, milling units, and implants to create switching costs, mimicking enterprise IT models. DSOs amplify this dynamic by negotiating platform-wide deals, compelling smaller vendors to differentiate via open-architecture interoperability within the abutment implants market.
Abutment Implants Industry Leaders
Nobel Biocare
Dentsply Sirona
Straumann Group
Envista
Zimmer Biomet
- *Disclaimer: Major Players sorted in no particular order
Abutment Implants Market Companies Covered in this Report
- Anthogyr (Straumann)
- Bicon
- BioHorizons
- Camlog Biotechnologies
- Dentium Co., Ltd.
- Dentsply Sirona
- Envista (Nobel Biocare)
- Henry Schein
- Straumann Group
- MegaGen Implant
- MIS Implants Technologies
- Neoss Ltd.
- Osstem Implant Co., Ltd.
- Planmeca
- Southern Implants
- Sweden & Martina SpA
- Thommen Medical
- Zimmer Biomet
- ZimVie

Market Opportunities and Future Outlook
Interoperable restorative ecosystems and cross-platform compatibility create a niche for components that reduce procurement friction across multiple implant bases and laboratory workflows. Preat Corporation’s January 2026 announcement that PreatLoc, an FDA-cleared overdenture attachment system, is available with stated compatibility across 18 implant systems and 35 connections is a specific example aimed at clinics and laboratories managing mixed implant portfolios that want to standardize attachments and related restorative parts.
Product development and manufacturing methods also support differentiation around customization speed, cost, and material performance. Neoss Group’s February 2026 launch of a new multiunit abutment for the Neoss4+ system (including a 10-degree option and fixed screw design) reflects ongoing innovation for full-arch and angled restorative protocols, where inventory simplification and prosthetic passivity affect purchasing decisions. At the research level, published 2026 work on hybrid additive manufacturing routes for Ti6Al4V personalized abutments and comparative biocompatibility signals for additively manufactured PEEK healing abutments indicates continued R&D that can translate into new product lines, particularly where faster turnaround and material-specific soft-tissue response are key in premium restorative cases.
Recent Industry Developments in Abutment Implants Market
- February 2026: Neoss Group launched a new multiunit abutment for the Neoss4+ treatment system, adding a 10-degree option and a fixed screw mechanism. The release targets streamlined restorative workflows for angled and full-arch cases where component standardization and precision fit influence chair time and prosthetic delivery.
- May 2025: CG MedTech acquired All Abutment, a custom dental abutment provider, to strengthen its digital dentistry manufacturing capabilities. The deal supports tighter integration between design and production, improving responsiveness for customized abutments that compete on turnaround time and fit accuracy.
- March 2024: Envista highlighted continued momentum in its implant portfolio, including Nobel Biocare, in its fourth-quarter 2024 results communication. The update reinforced ongoing investment focus around premium implant and restorative ecosystems, which directly shape abutment attach rates through platform-based selling.


Abutment Implants Market Report Scope and Research Methodology
Market Definition and Coverage
For this study, the abutment implants market is defined as the revenue generated from dental implant abutments and closely related abutment systems sold for restorative implant procedures across care settings.
Scope exclusions: We exclude full implant fixtures, crowns, bridges, and clinical service fees unless they are priced and sold as part of the abutment system itself.
Segments Covered in This Report
- By Material
- Titanium
- Zirconia
- Peek & High-Performance Polymers
- Hybrid/Composite Alloys
- By Abutment Type
- Prefabricated
- Customized
- Healing
- Multi-Unit
- By End-User Facility
- Academic & Research Institutes
- Dental Clinics
- Dental Laboratories
- Hospitals & Surgery Centers
- Geography
- North America
- United States
- Canada
- Mexico
- Europe
- Germany
- United Kingdom
- France
- Italy
- Spain
- Rest of Europe
- Asia-Pacific
- China
- Japan
- India
- Australia
- South Korea
- Rest of Asia-Pacific
- Middle East & Africa
- GCC
- South Africa
- Rest of Middle East & Africa
- South America
- Brazil
- Argentina
- Rest of South America
- North America
Data Sources, Market Sizing, and Validation
Desk Research
Desk research was used to map the demand base and product boundaries before numbers were modeled. We relied on public oral health and procedure context from sources such as the World Health Organization, the US CDC, and national health ministries, which helped frame population drivers, edentulism levels, and treatment access signals.
We also reviewed guidance and clinical standards from dental associations and peer reviewed journals to understand how abutment selection shifts by material and workflow (for example, customized versus stock). Import and export statistics and customs trade headings were used where helpful for directional checks, and patents were scanned using a paid patent database to spot technology shifts that may affect average selling prices over time. Company filings, investor presentations, and reputed press were also used to cross-check product mix comments and regional exposure. The desk sources listed here are illustrative only, and many other public references were also used for data collection, validation, and clarification.
Primary Interviews and Surveys
Primary interviews and structured surveys were run with a mix of implant component manufacturers, dental distributors, lab aligned stakeholders, and clinic side buyers to confirm volumes, pricing movement, and adoption of custom workflows. For the global view, inputs were balanced across key demand centers so regional procedure intensity and reimbursement realities could be reflected in the final model.
Distribution of primary research fieldwork respondents
| Company type | Respondent position | Region |
|---|---|---|
| Top tier: 39% | CXOs: 15% | APAC: 48% |
| Mid tier: 43% | Functional/Unit leaders: 29% | EMEA: 29% |
| Smaller Players: 18% | Managers: 56% | Americas: 23% |
Market-Sizing & Forecasting
The market was sized using a top-down build that starts from addressable implant restoration activity, then reconstructs abutment demand using procedure rates, tooth replacement penetration, and region level care access patterns. After shaping this demand pool, revenue was derived using a price ladder that reflects typical stock versus custom share and material mix, with currency normalization done at the year level for consistency.
To keep the totals realistic, we also ran selective bottom-up approximations using supplier and channel checks. In these checks, sampled average selling prices were multiplied by plausible unit volumes and then compared back to the main model. The variables that mattered most in this market included dental implant procedure intensity, share of customized abutments, titanium versus zirconia mix, lab and clinic workflow adoption (including CAD-CAM enabled ordering), and regional reimbursement and out of pocket spending sensitivity. When a local data point was missing, we filled gaps using proxy ratios from similar markets and then pressure tested the assumptions through follow up calls.
For forecasting, scenario analysis was used so different adoption speeds for custom systems and different price progression paths could be applied. We then converged on the most supported case based on expert consensus. Short term changes were checked against supply availability and purchasing behavior, and longer term growth was aligned to demographic aging and implant treatment uptake signals.
Data Validation & Update Cycle
Outputs were validated through triangulation across independent signals, including procedure activity indicators, product mix commentary, and price benchmarks gathered during interviews. If a region showed an unusual jump or drop, the drivers were reviewed, the input assumptions were rechecked, and the relevant experts were recontacted to confirm whether it was a real shift or a modeling artifact.
Before sign off, the model and narrative pass through multiple analyst reviews so definitions, currency handling, and growth math remain consistent. Reports are refreshed annually, and interim updates are made when material events occur that can change demand or pricing. Right before delivery, we perform a final check so the client receives the latest updated view that matches the most recent data cut.
Mordor Intelligence's Abutment Implants Market Size Compared Against Other Published Estimates
Published market values for abutment implants can look far apart, even when they are describing the same broad area, because the counting rules are not always the same. The biggest differences usually come from what is included in the revenue line, how custom versus stock systems are treated, and whether the current year is anchored to verified pricing and procedure signals or extended from older assumptions.
In this study, the spread is mainly explained by whether adjacent implant components and service related revenue are bundled into the estimate, and by how fast average selling prices are assumed to move as digital workflows expand. When the demand pool is tied back to implant restoration activity and then stress tested with regional pricing checks and channel feedback, the 2025 total stays closer to what clinics and distributors describe in real buying behavior, which is the approach applied by Mordor Intelligence.
Benchmark comparison
| Source | Market Size | Gaps in Research Methodology |
|---|---|---|
| Mordor Intelligence | USD 1.08 B (2025) | |
| Industry Publisher A | USD 0.89 B (2025) | This figure appears to use a tighter product definition that leans toward stock abutments and selected regions, and it can also rely on slower ASP progression, which reduces the revenue line versus a broader global capture. |
| Market Tracker B | USD 2.56 B (2025) | This estimate likely rolls the market into a wider implant abutment or abutment systems bucket, where related components and a broader set of transaction types can be counted, thereby lifting the 2025 value above an abutment focused scope. |
Overall, the differences mainly come down to scope boundaries, price ramp assumptions, and how current year demand is anchored. Our approach keeps each step traceable to procedure activity, mix shifts, and practical pricing checks, which helps users interpret the numbers and apply them with fewer hidden inclusions.


Key Questions Answered in the Report
How large will global spending on abutment components become by 2031?
The abutment implants market size is forecast to reach USD 1.99 billion by 2031, reflecting a 10.75% CAGR from 2026.
Which material is gaining traction for anterior implant restorations?
Zirconia is expanding the fastest at a 12.65% CAGR thanks to superior esthetics and soft-tissue response.
What impact will U.S. insurance changes have on demand?
ACA adult dental coverage starting in 2027 could add up to 20 million insured candidates, enlarging the addressable patient pool for multi-unit restorations.
Why are dental laboratories growing faster than clinics?
Digital impressions and AI design tools let labs control abutment geometry and cut delivery times to 48 hours, driving a 13.65% CAGR through 2031.
Which region will see the quickest revenue growth?
Asia-Pacific leads with an 11.54% CAGR as China's aging society and India's middle class boost elective implant uptake.
How are supply-chain risks being managed by manufacturers?
Companies like Straumann are regionalizing production—e.g., a new Brazilian plant—to reduce tariff exposure and titanium price volatility.
Page last updated on:


 Your data is secure and never sold or shared.


