| Study Period | 2017 - 2030 |
| Base Year For Estimation | 2024 |
| Forecast Data Period | 2025 - 2030 |
| Market Size (2025) | USD 43.3 Billion |
| Market Size (2030) | USD 60.92 Billion |
| CAGR (2025 - 2030) | 7.07 % |
| Market Concentration | Low |
Major Players*Disclaimer: Major Players sorted in no particular order |

ASEAN Cross Border Road Freight Transport Market Analysis
The ASEAN Cross Border Road Freight Transport Market size is estimated at 43.3 billion USD in 2025, and is expected to reach 60.92 billion USD by 2030, growing at a CAGR of 7.07% during the forecast period (2025-2030).
The ASEAN cross-border road freight transport landscape is experiencing significant transformation driven by substantial infrastructure investments and modernization initiatives. Thailand's Ministry of Transport announced a landmark investment of USD 45 billion in 37 infrastructure projects in 2022, with USD 29.7 billion allocated to 24 new projects. In 2023, the government further committed USD 19.18 billion for infrastructure development, including USD 3.26 billion specifically for new highway construction. These investments reflect a broader regional commitment to enhancing connectivity and logistics efficiency, with similar initiatives being implemented across other ASEAN nations to strengthen their transportation networks.
The region's logistics infrastructure is witnessing rapid modernization through strategic private sector investments and technological integration. A notable example is Idec Group Asia Vietnam's December 2023 investment of USD 51.3 million in a state-of-the-art logistics warehouse in Bac Ninh province. The 12-hectare facility, designed to meet European standards, represents the increasing sophistication of ASEAN's logistics infrastructure, featuring advanced specifications like a 5-ton/sq. m floor load capacity and NFPA-compliant fire protection systems. This trend of modernization is reshaping the industry's operational capabilities and efficiency standards, particularly in international road freight transport.
Cross-border trade dynamics are evolving rapidly, with significant developments in regional cooperation and trade facilitation. The implementation of the ASEAN Customs Transit System (ACTS) marks a pivotal advancement in streamlining cross-border operations across Cambodia, Laos, Malaysia, Singapore, Thailand, and Vietnam. The system's rollout aligns with ASEAN's ambitious goal of doubling intra-ASEAN trade by 2025 while targeting a 10% reduction in trade transaction costs. This initiative represents a fundamental shift in how cross-border multimodal transport operations are conducted, promoting greater efficiency and regional integration.
Recent economic indicators demonstrate the robust growth potential in the region's cross-border trade sector. Vietnam's manufacturing and processing industries expanded by 6.98% in Q1 2024, indicating strong industrial activity driving freight demand. Malaysia's imports recorded a significant 13.1% year-over-year growth in Q1 2024, primarily driven by robust imports of capital and intermediate goods for manufacturing. These trends, coupled with Indonesia's industrial sector exports reaching USD 206.35 billion in 2022 (a 16.45% increase), highlight the region's growing role in global supply chains and the increasing importance of efficient international road freight transport services.
ASEAN Cross Border Road Freight Transport Market Trends
Rising FDI in ASEAN countries supported by infrastructure construction projects by country governments driving economic growth
- In May 2024, the Japanese government announced a loan of about JPY140.7 billion (USD 900 million) to build a high-speed rail line in Jakarta, Indonesia. The East-West rail project will cover 84.1 km and be completed in two phases, starting in 2026 and finishing by 2031. The new rail line will feature Japanese technology for trains and signaling systems. Such initiatives are expected to boost GDP contribution from transport and storage sector.
- In February 2024, the Transport Ministry announced plans to invest USD 18.83 billion in around 150 transport projects by the end of 2025 to enhance Thailand's infrastructure. In 2024, 64 projects will commence, with an additional 31 projects valued at USD 11.23 billion in the pipeline. For 2025, there are 57 new projects planned, totaling USD 7.59 billion. These initiatives include 18 motorway projects, 9 railway projects, and plans for regional port development, all aimed at bolstering the transport and storage sector's contribution to GDP in the future.
,-Share---Of-GDP,-ASEAN,-2017---2022.svg)
Understand The Key Trends Shaping This Market
Download PDF
Impact of the Iran-Israel conflict and Ukraine-Russia war on ASEAN countries led to increased fuel prices and supply chain disruptions
- Indonesia expects a 29% increase in oil and gas sector investments in 2024 to boost drilling and exploration after Shell and Chevron's recent exits. This push is vital for Indonesia to counter a long-term decline in output amid rising financing challenges for fossil fuel projects. Foreign companies like Eni, Exxon Mobil, and BP will contribute 40% of 2024's planned investments. Also, in early 2024, the Ministry of Oil and Gas announced that fuel prices at gas stations will stay stable until at least June 2024, despite the Iran-Israel conflict potentially raising oil prices to USD 100 per barrel.
- Diesel prices in Malaysia surged by over 50% in June 2024 as part of Prime Minister Anwar Ibrahim's efforts to reform the country's long-standing fuel subsidy system. The restructuring aimed to alleviate pressure on national finances by eliminating universal energy subsidies and focusing assistance on those most in need. This move also aims to address issues like the smuggling of subsidized diesel to neighboring countries, where it fetches higher prices.

OTHER KEY INDUSTRY TRENDS COVERED IN THE REPORT
- ASEAN economies are promoting the agriculture sector to bolster food availability and affordability
- ASEAN's e-commerce market is expected to grow rapidly, registering a CAGR of 11% during 2023-27
- Improvements in some ASEAN country LPI ranks, fueled by infrastructure growth and e-commerce expansion
- ASEAN economies anticipates growth in exports by 2030 led by development in manufacturing sector
- Rising fuel costs and truck driver shortages are impacting the operational costs in the region
- ASEAN's truck volume is expected to reach 1.7 million units by 2030, registering a CAGR of 7.9% during 2020-2030
- Countries across the ASEAN region are aiming to reduce road freight costs via various initiatives during 2024-2030
- Indonesia, Malaysia, and Thailand are leading oil and gas GDP growth in the ASEAN region, followed by the manufacturing sector demand
- Thailand's Electric Vehicle Policy aims for 30% of the total vehicle production to account for electric cars by 2030
- Construction of new expressways, coupled with significant road expansions and infrastructural investments, are driving market growth in the region
- Huge reliance on wheat imports has become a major concern to food security for ASEAN countries
- Thailand is rapidly becoming a major production hub for medium and heavy commercial vehicles in the region, with Scania's production and R&D center
- The primary focus of Thailand's government within the ASEAN region is on infrastructure projects, with investments exceeding USD 45 billion
- ASEAN countries witnessed a significant rise in producer and consumer prices due to increases in fuel and food costs
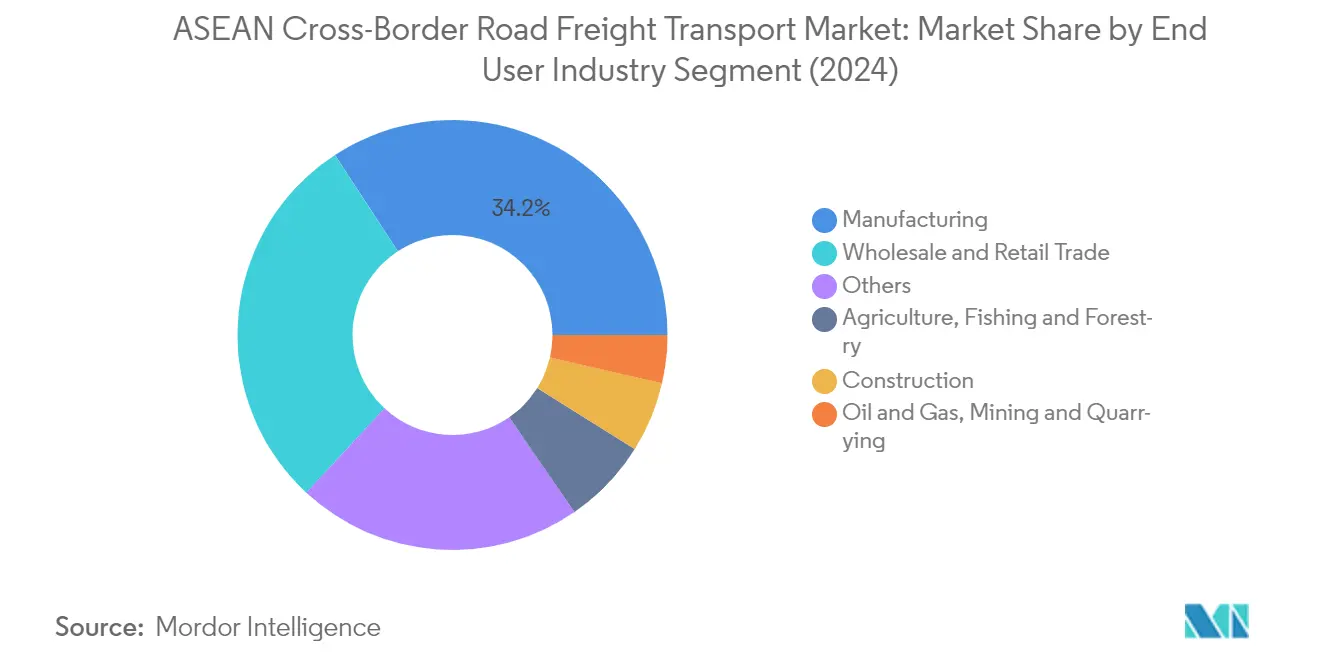
Segment Analysis: End User Industry
Manufacturing Segment in ASEAN Cross-Border Road Freight Transport Market
The manufacturing segment dominates the ASEAN cross-border road freight transport market, accounting for approximately 34% market share in 2024. This significant share is driven by the robust growth of manufacturing activities across the region, particularly in countries like Indonesia, Thailand, and Vietnam. The ASEAN manufacturing sector has established itself as a major player in the global market, with automotive parts, electronics, and consumer goods manufacturing being key contributors. Indonesia's manufacturing industry has shown strong performance, while Thailand's automotive industry has become a significant regional hub. The sector's strength is further enhanced by increasing mechanization in Malaysia's manufacturing operations, particularly in semiconductor production, where the country produces over 8% of global back-end semiconductor output. Singapore's manufacturing sector, contributing between 20% and 25% of its GDP, focuses on key sub-sectors including chemicals, electronics, biomedical sciences, and transport engineering. The role of international road freight transport is crucial in facilitating the seamless movement of goods across these manufacturing hubs.
Wholesale and Retail Trade Segment in ASEAN Cross-Border Road Freight Transport Market
The wholesale and retail trade segment is experiencing the fastest growth in the ASEAN cross-border road freight transport market, with a projected growth rate of approximately 9% during 2024-2029. This remarkable growth is primarily driven by the rapid expansion of cross-border e-commerce in the region. Singapore and Malaysia collectively account for about 50% of the cross-border e-commerce market in Southeast Asia, while Thailand is undergoing significant growth supported by its Thailand 4.0 policy designed to foster internet connectivity across the country. Vietnam has emerged as one of the fastest-growing cross-border e-commerce markets in the region, while Thailand's Industry 4.0 initiative promotes technological innovation for boosting economic growth. The surge in smartphone usage and internet penetration, particularly in Indonesia where the internet penetration rate increased to 73.7% in 2024, has been a key driver for the rise of e-commerce. The 'unbanked' population, primarily in Vietnam, is expected to grow significantly in digital payments, further driving market growth. The efficiency of international road freight transport plays a pivotal role in supporting this expansion by ensuring timely delivery of goods.
Remaining Segments in End User Industry
The other segments in the ASEAN cross-border road freight transport market include agriculture, fishing, and forestry; construction; and oil and gas, mining, and quarrying sectors. The agriculture, fishing, and forestry segment plays a crucial role in regional trade, particularly in countries like Thailand and Vietnam, where agricultural exports significantly contribute to cross-border transportation. The construction segment is driven by massive infrastructure development projects across ASEAN countries, particularly in Vietnam and Singapore, where significant investments in transportation infrastructure are ongoing. The oil and gas, mining, and quarrying segment's demand is primarily influenced by energy sector developments and mineral resource trade between ASEAN nations, with Indonesia and Malaysia being key players in this sector. These segments collectively contribute to the diverse nature of the ASEAN cross-border road freight transport market, each bringing unique requirements and growth opportunities.
ASEAN Cross Border Road Freight Transport Market Geography Segment Analysis
ASEAN Cross-Border Road Freight Transport Market in Indonesia
Indonesia dominates the ASEAN cross-border road freight transport landscape, commanding approximately 46% of the market share. The country's strategic focus on expressway development has been instrumental in facilitating international road freight transport services, with construction increasing by 4.76% year-over-year. The Indonesian government has been actively working to transform the country's manufacturing capabilities from low-value to complex products and new technologies, driving increased freight movement. The implementation of at least 15 trade agreements offering zero or highly discounted duty rates for goods manufactured in participating countries has significantly boosted cross-border volumes. The country's commitment to sustainability is evident in its revised emission reduction target of 32% lower emissions by 2030, influencing the adoption of greener transport solutions. Additionally, the surge in cross-border e-commerce has been remarkable, with Indonesia witnessing unprecedented growth in imported e-commerce parcels, reflecting changing consumer preferences and market dynamics.
ASEAN Cross-Border Road Freight Transport Market in Vietnam
Vietnam has emerged as a dynamic force in the ASEAN cross-border road freight transport sector, with projections indicating approximately 8% growth annually from 2024 to 2029. The country's Road Network Development Plan for 2021-2030 demonstrates its ambitious infrastructure expansion goals, aiming to develop over 5,000 km of expressways. Vietnam's manufacturing sector has shown remarkable resilience, with the manufacturing and processing industries expanding by 6.98% in Q1 2024, driven by higher domestic consumption and increased foreign investment. The country has positioned itself as ASEAN's primary manufacturing center, leveraging its export-focused economy by importing raw materials and exporting finished products. The implementation of numerous free trade agreements has significantly facilitated manufacturing industry growth. Vietnam's strategic position as a gateway connecting trade between ASEAN and China is further enhanced by infrastructure developments like the Ha Long - Van Don Expressway, which has substantially reduced travel times and improved regional connectivity. The integration of cross-border multimodal transport solutions has further bolstered Vietnam's role in regional trade.
ASEAN Cross-Border Road Freight Transport Market in Thailand
Thailand's position in the ASEAN cross-border road freight transport market is strengthened by its role as a major regional transport hub. The country's commitment to infrastructure development is evident through its comprehensive investment strategy, with significant allocations for new highway construction and improvement projects. Thailand's automotive industry has established itself as a major player in the global market, with auto parts and accessories accounting for a substantial portion of its exports. The country's Industry 4.0 initiative actively promotes technological innovation for boosting economic growth, while its Electric Vehicle Policy aims for 30% of total vehicle production to be electric cars by 2030. The successful persuasion of Chinese EV makers to establish regional production bases in Thailand further demonstrates the country's strategic importance in the regional automotive sector. Additionally, Thailand's active development of its ICT infrastructure has elevated the country into a regional leader in mobile commerce.
ASEAN Cross-Border Road Freight Transport Market in Malaysia
Malaysia's cross-border road freight transport market is characterized by its strong focus on digital transformation and sustainable development. The country's Digital Free Trade Zone, established to facilitate seamless cross-border trade, has been instrumental in enabling local SMEs to export their goods through online marketplaces. Malaysia has been at the forefront of promoting electric vehicle usage in truck fleets, with major manufacturers like Volvo introducing zero-exhaust emission trucks in the market. The country's strategic location and well-developed infrastructure network have made it a crucial hub for cross-border e-commerce, with cross-border spending accounting for 44% of total Malaysian e-commerce sales. Malaysia's commitment to sustainability is reflected in its national plan to reach net zero greenhouse gas emissions by 2050, with electrifying road transport being a key measure in achieving this target. The focus on international road freight transport continues to drive Malaysia's economic integration within ASEAN.
ASEAN Cross-Border Road Freight Transport Market in Other Countries
The remaining ASEAN countries, including Singapore, the Philippines, Laos, Cambodia, Myanmar, and Brunei, each contribute uniquely to the regional cross-border road freight transport ecosystem. Singapore's role as a technological and logistics hub has been pivotal in driving innovation across the region, while the Philippines has shown strong potential in cross-border e-commerce logistics. Laos's strategic position as a land-linked country has led to significant investments in connectivity infrastructure, particularly in its borders with Thailand and Vietnam. Cambodia's improving logistics infrastructure and Myanmar's emerging transport corridor developments have created new opportunities for cross-border trade. These countries collectively demonstrate the region's commitment to enhancing connectivity and facilitating seamless cross-border movement of goods, supported by various bilateral and multilateral trade agreements. The development of international road freight transport systems across these nations is crucial for sustaining regional economic growth.
Get Analysis on Important Geographic Markets
Download PDF
ASEAN Cross Border Road Freight Transport Industry Overview
Top Companies in ASEAN Cross-Border Road Freight Transport Market
The market is characterized by companies focusing on technological advancement and digital transformation of logistics services. Major players are investing in expanding their warehousing capacities and distribution networks to accommodate growing order volumes and improve delivery efficiency. Companies are increasingly adopting sustainable practices, with several operators implementing renewable fuel solutions and electric vehicles in their fleets. Strategic partnerships and collaborations are being formed to enhance cross-border capabilities and leverage complementary strengths. Digital logistics platforms and advanced tracking systems are being implemented to provide real-time visibility and improve customer experience. Companies are also emphasizing the development of specialized solutions for different industries, particularly e-commerce, manufacturing, and retail sectors. The integration of smart technologies and automation in operations has become a key focus area for maintaining competitive advantage.
Fragmented Market with Strong Regional Players
The market structure is characterized by a mix of global logistics giants and established regional players with strong local networks. Global players bring international expertise and advanced technological capabilities, while regional operators leverage their deep understanding of local markets and established relationships. The market remains relatively fragmented, with numerous small and medium-sized operators serving specific routes or specialized segments. Recent years have witnessed increased merger and acquisition activity as larger players seek to expand their geographical presence and service capabilities through strategic acquisitions of local operators.
The competitive dynamics are shaped by the presence of both integrated logistics providers offering end-to-end solutions and specialized cross-border transport operators. Major conglomerates are expanding their presence through vertical integration and acquisition of specialized logistics providers. The market has seen the emergence of technology-driven logistics platforms that are disrupting traditional business models. Companies are increasingly forming strategic alliances and joint ventures to strengthen their market position and expand their service offerings across the ASEAN region. The rise of cross-border multimodal transport solutions is further enhancing the efficiency and reach of these operators.
Innovation and Network Expansion Drive Success
Success in the market increasingly depends on the ability to provide integrated logistics solutions while maintaining operational efficiency. Companies need to invest in digital transformation and automation to streamline operations and enhance service quality. Building strong relationships with customs authorities and understanding complex cross-border regulations is crucial for maintaining competitive advantage. The development of specialized solutions for high-growth sectors like e-commerce and manufacturing is becoming increasingly important. Companies must also focus on sustainability initiatives and green logistics solutions to meet evolving customer expectations and regulatory requirements.
Market leaders are strengthening their position through network expansion and service diversification, while new entrants are focusing on niche segments and innovative business models. The ability to provide value-added services and customize solutions for specific industry requirements is becoming a key differentiator. Companies need to maintain strong relationships with key clients while expanding their customer base across different industries. Investment in talent development and training is crucial for maintaining service quality and operational excellence. The market shows potential for further consolidation as companies seek to achieve economies of scale and expand their service capabilities. The integration of international road freight transport solutions is pivotal for companies aiming to enhance their cross-border service offerings.
ASEAN Cross Border Road Freight Transport Market Leaders
-
Deutsche Bahn AG (including DB Schenker)
-
DHL Group
-
Konoike Group (including Konoike Transport Co., Ltd.)
-
Mitsui O.S.K. Lines
-
SF Express (KEX-SF)
- *Disclaimer: Major Players sorted in no particular order

Need More Details on Market Players and Competiters?
Download PDF
ASEAN Cross Border Road Freight Transport Market News
- November 2024: Tiong Nam Logistics Holdings Bhd invested an estimated RM460 million in capital expenditures (capex) over 2025 and 2026. As of June 30, 2024, the company was in the process of constructing four new warehouses located in Johor Bahru, Kedah, Sabah, and Singapore. These warehouses, boasting a combined capacity of 1.3 million square feet, were slated to begin operations in stages over the next two financial years. Furthermore, Tiong Nam had plans for an additional four warehouses in Johor Bahru, Selangor, and Kedah, which would add another 0.7 million sq ft to their capacity.
- September 2024: K Line had decided to set up a holding company, positioning it as the parent entity of K Line Logistics, Ltd. The company intended to shift its shares of K Line Logistics to this newly minted holding company. After obtaining the requisite approvals and licenses from pertinent authorities, K Line had consented to transfer 47% of the holding company's total shares to Kamigumi.
- July 2024: DHL Express introduced a range of digital tools aimed at empowering small and medium enterprises (SMEs) to broaden their global reach and enhance their international trade and shipping endeavors. These tools were designed to assist resource-limited SMEs in efficiently navigating cross-border shipping logistics, facilitating smoother import and export activities from diverse sources and locations. Among the suite of digital solutions crafted by DHL Express were My Global Trade Services (myGTS), DHL Express Commerce, Track & Trace, DHL Pass, and On Demand Delivery. In addition to digital tools, DHL Express also introduced the GoTrade program, which supports small businesses in trading their goods internationally.
Free With This Report
We provide a complimentary and exhaustive set of data points on global and regional metrics that present the fundamental structure of the industry. Presented in the form of 60+ free charts, the section covers difficult to find data on various regions pertaining to e-commerce industry trends, economic contribution of the transportation & storage sector, export and import trends among other key indicators.


ASEAN Cross Border Road Freight Transport Market Report - Table of Contents
1. EXECUTIVE SUMMARY & KEY FINDINGS
2. REPORT OFFERS
3. INTRODUCTION
- 3.1 Study Assumptions & Market Definition
- 3.2 Scope of the Study
- 3.3 Research Methodology
4. KEY INDUSTRY TRENDS
- 4.1 GDP Distribution By Economic Activity
- 4.2 GDP Growth By Economic Activity
-
4.3 Economic Performance And Profile
- 4.3.1 Trends in E-Commerce Industry
- 4.3.2 Trends in Manufacturing Industry
- 4.4 Transport And Storage Sector GDP
- 4.5 Logistics Performance
- 4.6 Length Of Roads
- 4.7 Export Trends
- 4.8 Import Trends
- 4.9 Fuel Pricing Trends
- 4.10 Trucking Operational Costs
- 4.11 Trucking Fleet Size By Type
- 4.12 Major Truck Suppliers
- 4.13 Road Freight Tonnage Trends
- 4.14 Road Freight Pricing Trends
- 4.15 Inflation
- 4.16 Regulatory Framework
- 4.17 Value Chain & Distribution Channel Analysis
5. MARKET SEGMENTATION (includes market size in Value in USD, Forecasts up to 2030 and analysis of growth prospects)
-
5.1 End User Industry
- 5.1.1 Agriculture, Fishing, and Forestry
- 5.1.2 Construction
- 5.1.3 Manufacturing
- 5.1.4 Oil and Gas, Mining and Quarrying
- 5.1.5 Wholesale and Retail Trade
- 5.1.6 Others
-
5.2 Country
- 5.2.1 Indonesia
- 5.2.2 Malaysia
- 5.2.3 Thailand
- 5.2.4 Vietnam
- 5.2.5 Rest of ASEAN
6. COMPETITIVE LANDSCAPE
- 6.1 Key Strategic Moves
- 6.2 Market Share Analysis
- 6.3 Company Landscape
-
6.4 Company Profiles
- 6.4.1 Deutsche Bahn AG (including DB Schenker)
- 6.4.2 DHL Group
- 6.4.3 Gemadept
- 6.4.4 Konoike Group (including Konoike Transport Co., Ltd.)
- 6.4.5 Mitsui O.S.K. Lines
- 6.4.6 Profreight Group
- 6.4.7 SF Express (KEX-SF)
- 6.4.8 Tiong Nam Logistics Holdings Bhd
- 6.4.9 Yatfai
- 6.4.10 “K”Line Logistics, Ltd.
- *List Not Exhaustive
7. KEY STRATEGIC QUESTIONS FOR ROAD FREIGHT CEOS
8. APPENDIX
-
8.1 Global Logistics Market Overview
- 8.1.1 Overview
- 8.1.2 Porter’s Five Forces Framework
- 8.1.3 Global Value Chain Analysis
- 8.1.4 Market Dynamics (Market Drivers, Restraints & Opportunities)
- 8.2 Sources & References
- 8.3 List of Tables & Figures
- 8.4 Primary Insights
- 8.5 Data Pack
- 8.6 Glossary of Terms
- 8.7 Currency Exchange Rate
You Can Purchase Parts Of This Report. Check Out Prices For Specific Sections
Get Price Break-up Now
List of Tables & Figures
- Figure 1:
- DISTRIBUTION OF GROSS DOMESTIC PRODUCT (GDP) BY ECONOMIC ACTIVITY, SHARE %, ASEAN, 2022
- Figure 2:
- GROWTH OF GROSS DOMESTIC PRODUCT (GDP) BY ECONOMIC ACTIVITY, CAGR %, ASEAN, 2017 – 2022
- Figure 3:
- GROSS MERCHANDISE VALUE (GMV) OF E-COMMERCE INDUSTRY, USD, ASEAN, 2017 - 2027
- Figure 4:
- SECTORAL SHARE IN E-COMMERCE INDUSTRY GROSS MERCHANDISE VALUE (GMV), SHARE %, ASEAN, 2022
- Figure 5:
- GROSS VALUE ADDED (GVA) OF MANUFACTURING INDUSTRY (IN CURRENT PRICES), USD, ASEAN, 2017 - 2022
- Figure 6:
- SECTORAL SHARE IN GROSS VALUE ADDED (GVA) OF MANUFACTURING INDUSTRY, SHARE %, ASEAN, 2022
- Figure 7:
- VALUE OF TRANSPORT AND STORAGE SECTOR GROSS DOMESTIC PRODUCT (GDP), USD, ASEAN, 2017 – 2022
- Figure 8:
- TRANSPORT AND STORAGE SECTOR GROSS DOMESTIC PRODUCT (GDP), SHARE % OF GDP, ASEAN, 2017-2022
- Figure 9:
- RANK OF LOGISTICS PERFORMANCE, RANK, ASEAN, 2010 - 2023
- Figure 10:
- SHARE OF ROAD LENGTH BY SURFACE CATEGORY, %, ASEAN, 2022
- Figure 11:
- SHARE OF ROAD LENGTH BY SURFACE CLASSIFICATION, %, ASEAN, 2022
- Figure 12:
- VALUE OF EXPORTS, USD, ASEAN, 2017 - 2022
- Figure 13:
- VALUE OF IMPORTS, USD, ASEAN, 2017 - 2022
- Figure 14:
- FUEL PRICE BY TYPE OF FUEL, USD/LITER, ASEAN, 2017 - 2022
- Figure 15:
- OPERATIONAL COSTS OF TRUCKING - BREAKDOWN BY OPERATING COST ELEMENT, %, ASEAN, 2022
- Figure 16:
- TRUCKING FLEET SIZE BY TYPE, SHARE %, ASEAN, 2022
- Figure 17:
- MARKET SHARE OF MAJOR TRUCK SUPPLIER BRANDS, SHARE %, ASEAN, 2022
- Figure 18:
- FREIGHT HANDLED BY ROAD TRANSPORT, TONS, ASEAN, 2017 - 2030
- Figure 19:
- PRICE TREND OF ROAD FREIGHT TRANSPORT SERVICE, USD/TON-KM, ASEAN, 2017 - 2022
- Figure 20:
- WHOLESALE PRICE INFLATION RATE, %, ASEAN, 2017 - 2022
- Figure 21:
- CONSUMER PRICE INFLATION RATE, %, ASEAN, 2017 - 2022
- Figure 22:
- VOLUME OF CROSS BORDER ROAD FREIGHT TRANSPORT MARKET, TON-KM, ASEAN, 2017 - 2030
- Figure 23:
- VALUE OF CROSS BORDER ROAD FREIGHT TRANSPORT MARKET, USD, ASEAN, 2017 - 2030
- Figure 24:
- VOLUME OF CROSS BORDER ROAD FREIGHT TRANSPORT MARKET BY END USER INDUSTRY, TON-KM, ASEAN, 2017 - 2030
- Figure 25:
- VALUE OF CROSS BORDER ROAD FREIGHT TRANSPORT MARKET BY END USER INDUSTRY, USD, ASEAN, 2017 - 2030
- Figure 26:
- VALUE SHARE OF CROSS BORDER ROAD FREIGHT TRANSPORT MARKET BY END USER INDUSTRY, %, ASEAN, 2017 - 2030
- Figure 27:
- VOLUME OF AFF INDUSTRY (AGRICULTURE, FISHING, AND FORESTRY) CROSS BORDER ROAD FREIGHT TRANSPORT MARKET, TON-KM, ASEAN, 2017 - 2030
- Figure 28:
- VALUE OF AFF INDUSTRY (AGRICULTURE, FISHING, AND FORESTRY) CROSS BORDER ROAD FREIGHT TRANSPORT MARKET, USD, ASEAN, 2017 - 2030
- Figure 29:
- VALUE SHARE OF AGRICULTURE, FISHING, AND FORESTRY INDUSTRY CROSS BORDER ROAD FREIGHT TRANSPORT MARKET BY DESTINATION, %, ASEAN, 2022 VS 2030
- Figure 30:
- VOLUME OF CONSTRUCTION INDUSTRY CROSS BORDER ROAD FREIGHT TRANSPORT MARKET, TON-KM, ASEAN, 2017 - 2030
- Figure 31:
- VALUE OF CONSTRUCTION INDUSTRY CROSS BORDER ROAD FREIGHT TRANSPORT MARKET, USD, ASEAN, 2017 - 2030
- Figure 32:
- VALUE SHARE OF CONSTRUCTION INDUSTRY CROSS BORDER ROAD FREIGHT TRANSPORT MARKET BY DESTINATION, %, ASEAN, 2022 VS 2030
- Figure 33:
- VOLUME OF MANUFACTURING INDUSTRY CROSS BORDER ROAD FREIGHT TRANSPORT MARKET, TON-KM, ASEAN, 2017 - 2030
- Figure 34:
- VALUE OF MANUFACTURING INDUSTRY CROSS BORDER ROAD FREIGHT TRANSPORT MARKET, USD, ASEAN, 2017 - 2030
- Figure 35:
- VALUE SHARE OF MANUFACTURING INDUSTRY CROSS BORDER ROAD FREIGHT TRANSPORT MARKET BY DESTINATION, %, ASEAN, 2022 VS 2030
- Figure 36:
- VOLUME OF EXTRACTION INDUSTRY (OIL AND GAS, MINING AND QUARRYING) CROSS BORDER ROAD FREIGHT TRANSPORT MARKET, TON-KM, ASEAN, 2017 - 2030
- Figure 37:
- VALUE OF EXTRACTION INDUSTRY (OIL AND GAS, MINING AND QUARRYING) CROSS BORDER ROAD FREIGHT TRANSPORT MARKET, USD, ASEAN, 2017 - 2030
- Figure 38:
- VALUE SHARE OF EXTRACTION INDUSTRY CROSS BORDER ROAD FREIGHT TRANSPORT MARKET BY DESTINATION, %, ASEAN, 2022 VS 2030
- Figure 39:
- VOLUME OF DISTRIBUTIVE TRADE INDUSTRY (WHOLESALE AND RETAIL TRADE) CROSS BORDER ROAD FREIGHT TRANSPORT MARKET, TON-KM, ASEAN, 2017 - 2030
- Figure 40:
- VALUE OF DISTRIBUTIVE TRADE INDUSTRY (WHOLESALE AND RETAIL TRADE) CROSS BORDER ROAD FREIGHT TRANSPORT MARKET, USD, ASEAN, 2017 - 2030
- Figure 41:
- VALUE SHARE OF WHOLESALE AND RETAIL TRADE INDUSTRY CROSS BORDER ROAD FREIGHT TRANSPORT MARKET BY DESTINATION, %, ASEAN, 2022 VS 2030
- Figure 42:
- VOLUME OF OTHER END USER INDUSTRIES CROSS BORDER ROAD FREIGHT TRANSPORT MARKET, TON-KM, ASEAN, 2017 - 2030
- Figure 43:
- VALUE OF OTHER END USER INDUSTRIES CROSS BORDER ROAD FREIGHT TRANSPORT MARKET, USD, ASEAN, 2017 - 2030
- Figure 44:
- VALUE SHARE OF OTHER END USER INDUSTRIES CROSS BORDER ROAD FREIGHT TRANSPORT MARKET BY DESTINATION, %, ASEAN, 2022 VS 2030
- Figure 45:
- VALUE OF CROSS BORDER ROAD FREIGHT TRANSPORT MARKET BY COUNTRY, USD, ASEAN, 2017 - 2030
- Figure 46:
- VALUE SHARE OF CROSS BORDER ROAD FREIGHT TRANSPORT MARKET BY COUNTRY, %, ASEAN, 2017 - 2030
- Figure 47:
- VALUE OF INDONESIA CROSS BORDER ROAD FREIGHT TRANSPORT MARKET, USD, INDONESIA, 2017 - 2030
- Figure 48:
- CAGR OF INDONESIA CROSS BORDER ROAD FREIGHT TRANSPORT MARKET, %, INDONESIA, 2017 - 2030
- Figure 49:
- VALUE OF MALAYSIA CROSS BORDER ROAD FREIGHT TRANSPORT MARKET, USD, MALAYSIA, 2017 - 2030
- Figure 50:
- CAGR OF MALAYSIA CROSS BORDER ROAD FREIGHT TRANSPORT MARKET, %, MALAYSIA, 2017 - 2030
- Figure 51:
- VALUE OF THAILAND CROSS BORDER ROAD FREIGHT TRANSPORT MARKET, USD, THAILAND, 2017 - 2030
- Figure 52:
- CAGR OF THAILAND CROSS BORDER ROAD FREIGHT TRANSPORT MARKET, %, THAILAND, 2017 - 2030
- Figure 53:
- VALUE OF VIETNAM CROSS BORDER ROAD FREIGHT TRANSPORT MARKET, USD, VIETNAM, 2017 - 2030
- Figure 54:
- CAGR OF VIETNAM CROSS BORDER ROAD FREIGHT TRANSPORT MARKET, %, VIETNAM, 2017 - 2030
- Figure 55:
- VALUE OF REST OF ASEAN CROSS BORDER ROAD FREIGHT TRANSPORT MARKET, USD, REST OF ASEAN, 2017 - 2030
- Figure 56:
- CAGR OF REST OF ASEAN CROSS BORDER ROAD FREIGHT TRANSPORT MARKET, %, REST OF ASEAN, 2017 - 2030
- Figure 57:
- MOST ACTIVE COMPANIES BY NUMBER OF STRATEGIC MOVES, COUNT, ASEAN, 2017 - 2023
- Figure 58:
- MOST ADOPTED STRATEGIES, COUNT, ASEAN, 2017 - 2023
- Figure 59:
- VALUE SHARE OF MAJOR PLAYERS, %, ASEAN
ASEAN Cross Border Road Freight Transport Industry Segmentation
Agriculture, Fishing, and Forestry, Construction, Manufacturing, Oil and Gas, Mining and Quarrying, Wholesale and Retail Trade, Others are covered as segments by End User Industry. Indonesia, Malaysia, Thailand, Vietnam are covered as segments by Country.| End User Industry | Agriculture, Fishing, and Forestry |
| Construction | |
| Manufacturing | |
| Oil and Gas, Mining and Quarrying | |
| Wholesale and Retail Trade | |
| Others | |
| Country | Indonesia |
| Malaysia | |
| Thailand | |
| Vietnam | |
| Rest of ASEAN |
Need A Different Region or Segment?
Customize Now
Market Definition
- Agriculture, Fishing, and Forestry (AFF) - This end user industry segment captures the external (outsourced) logistics expenditure incurred by the AFF industry players on road freight transport service. The end user players considered are the establishments primarily engaged in growing crops, raising animals, harvesting timber, harvesting fish & other animals from their natural habitats and providing related support activities. Herein, across the value chain, Logistics Service Providers (LSPs) play a crucial role in acquisition, storage, handling, transportation, and distribution activities for the optimal & continuous flow of inputs (seeds, pesticides, fertilizers, equipment, and water) from manufacturers or suppliers to the producers and smooth flow of output (produce, agro-goods) to distributors/ consumers. This includes both termperature controlled and non-temperature controlled logistics, as and when required according to the shelf life of goods being transported or stored.
- Construction - This end user industry segment captures the external (outsourced) logistics expenditure incurred by the construction industry players, on road freight transport service. The end user players considered are the establishments primarily engaged in constructing, repairing and renovating residential & commercial buildings, infrastructure, engineering works, subdividing and developing land. Logistics Service Providers (LSPs) play a crucial role in increasing profitability of construction projects by maintaing the inventory of raw materials & equipment, time-critical supplies and by providing other value added services for effective project management.
- Containerized Road Freight Transport - The segment captures the external (outsourced) logistics expenditure incurred by the road freight transport service end users on Full-Truck-Load (FTL) services. FTL road freight transport is characterized as a full single load not combined with other shipments. It comprises of shipments (i) devoted to the goods of a single shipper (ii) taken directly from a point of origin to one or more destination points (iii) comprising of bulk mail truck transportation (iv) comprising of both Container (Full Container Load, FCL)/Non-Container trucking services (v)comprsing of goods requiring temperature controlled or non-temperature controlled transportation services (vi) comprising of bulk liquid tankering (vii) invoving trucking of waste (viii) hazardous material trucking. Related value added services (VAS) of sorting, consolidation, deconslidation are included in the other services segment of freight and logistics market.
- Export Trends and Import Trends - Overall logistics performance of an economy is positively and significantly (statistically) correlated to its trade performance (exports and imports). Hence, in this industry trend, total value of trade, major commodities/ commodity groups and the major trade partners, for the studied geography (country or region as per the scope of report) have been analysed alongside the impact of major trade/logistics infrastructure investments & regulatory environment.
- Fluid Goods - The segment captures the external (outsourced) logistics expenditure incurred by the road freight transport service end users for the transport of bulk liquids, that are often used in extraction, manufacturing, food processing, agriculture industries among others. It includes transportation of liquids like (i) Chemicals/ hazardous goods (for instance acids) (ii) Water (potable as well as waste) (iii) Oil and gas (upstream as well as downstream like gasoline, fuel, crude oil, or propane), (iv) Food grade bulk liquids (like milk, or juice), (v) Rubber, (vi) Agrichemical products, among others. These goods are generally transported through tanker trucking.
- Fuel Price - Fuel price spikes can cause delays and diruption for logistics service providers (LSPs), while drops in the same can result in higher short-term profitability and increased market rivalry to offer consumers with the best deals. Hence, the fuel price variations have been studied over the review period and presented along with the causes as well as market impacts.
- Full-Truck-Load (FTL) Road Freight Transport - The segment captures the external (outsourced) logistics expenditure incurred by the road freight transport service end users on Full-Truck-Load (FTL) services. FTL road freight transport is characterized as a full single load not combined with other shipments. It comprises of shipments (i) devoted to the goods of a single shipper (ii) taken directly from a point of origin to one or more destination points (iii) comprising of bulk mail truck transportation (iv) comprising of both Container (Full Container Load, FCL)/Non-Container trucking services (v)comprsing of goods requiring temperature controlled or non-temperature controlled transportation services (vi) comprising of bulk liquid tankering (vii) invoving trucking of waste (viii) hazardous material trucking. Related value added services (VAS) of sorting, consolidation, deconslidation are included in the other services segment of freight and logistics market.
- GDP Distribution by Economic Activity - Nominal Gross Domestic Product and distribution of the same, across major economic sectors in the geography studied (country or region as per scope of the report) have been studied and presented in this industry trend. As GDP is positively related to the profitability and growth of logistics industry, this data has been used in adjunction to the input-output tables/ supply-use tables for analyzing the potential major contributing sectors towards the logistics demand.
- GDP Growth by Economic Activity - Growth of Nominal Gross Domestic Product across major economic sectors, for the geography studied (country or region as per scope of the report) have been presented in this industry trend. This data has been utilized for assessing the growth of logistics demand from all the market end users (economic sectors considered here).
- Inflation - Variations in both Wholesale Price Inflation (YoY change in producer price index) and Consumer Price Inflation have been presented in this industry trend. This data has been used to assess the inflationary environment as it plays a vital role in smooth functioning of the supply chain, directly impacting the logistics operational cost components e.g., pricing of tyres, driver wages & benefits, energy/fuel prices, maintenace costs, toll charges, warehousing rents, custom brokerage, forwarding rates, courier rates etc. hence impacting the overall freight and logistics market.
- Key Industry Trends - The report section named "Key Industry Trends" include all the key variables/parameters studied to better analyze the market size estimates and forecasts. All the trends have been presented in the form of data points (time series or latest available data points) along with analysis of the paramter in the form of concise market relevant commentary, for the geography studied (country or region as per the scope of report).
- Key Strategic Moves - The action taken by a company to differentiate from its competitor or used as a general strategy is referred to as a key strategic move (KSM). This includes (1) Agreements (2) Expansions (3) Financial Restructuring (4) Mergers and Acquisitions (5) Partnerships, and (6) Product Innovations. Key players (Logistics Service Providers, LSPs) in the market have been shortlisted, their KSM have been studied and presented in this section.
- Less than-Truck-Load (LTL) Road Freight Transport - The segment captures the external (outsourced) logistics expenditure incurred by the road freight transport service end users on Less than-Truck-Load (LTL) services. LTL road freight transport is characterized as multiple shipments combined onto a single truck for multiple deliveries within a network. It comprises of establishments (i) primarily engaged in general and specialized freight trucking of less than complete truck-loads, (ii) characterized by the use of terminals to consolidate shipments, generally from several shippers, into a single truck for haulage between a load assembly terminal and a disassembly terminal, where the load is sorted and shipments are re-routed for delivery (iv) Less than-Container-Load (LCL) shipping/ Groupage Shipping in case of trucking services. The activities in scope include (i) local pick-up, (ii) line-haul, and (iii) local delivery. Related value added services (VAS) of sorting, consolidation, deconslidation are included in the other services segment of freight and logistics market.
- Logistics Performance - Logistics Performance and Logistics Costs are the backbone of trade, and influences trade costs, making countries compete globally. Logistics performance is influenced by market wide adopted supply chain management strategies, government services, investments & policies, fuel/ energy costs, inflationary environment etc. Hence, in this industry trend, the logistics performance of the geography studied (country/ region as per the scope of report) has been analysed and presented over the review period.
- Major Truck Suppliers - Market share of truck brands is influenced by factors like geographical preferences, portfolio of truck types, truck prices, local production, truck repair & maintenance service peneteration, customer support, technological innovations (like electric vehicles, digitalization, autonomous trucks), fuel efficiency, financing options, annual maintenance costs, availability of substitutes, marketing startegies etc. Hence, the distribution (share % for base year of the study) of truck sales volume for leading truck brands and commentary on current market scenario & market anticipation over the forecast period have been presented in this industry trend.
- Manufacturing - This end user industry segment captures the external (outsourced) logistics expenditure incurred by the Manufacturing industry players, on road freight transport service. The end user players considered are the establishments primarily engaged in the chemical, mechanical or physical transformation of materials or substances into new products. Logistics Service Providers (LSPs) play a crucial role in maintaining a smooth flow of raw materials across the supply chain, enabling timely delivery of finished goods to distributors or end customers and storing & supplying the raw materials to clients for just-in-time manufacturing.
- Modal Share - Freight Modal Share is influenced by factors like modal productivity, government regulations, containerization, distance of shipment, temperature control requirements, type of goods, international trade, terrain, speed of delivery, shipment weight, bulk shipments, etc. Also, modal share by tonnage (tons) and modal share by freight turnover (ton-km) differ as per average distance of shipments, weight of major commodity groups transported in the economy and number of trips. This industry trend represents the distribution of freight transported by mode of transport (tons as well as ton-km), for the study base year.
- Oil and Gas, Mining and Quarrying - This end user industry segment captures the external (outsourced) logistics expenditure incurred by the extraction industry players, on road freight transport service. The end user players considered are the establishments that extract naturally occurring mineral solids, such as coal and ores; liquid minerals, such as crude petroleum; and gases, such as natural gas. Logistics Service Providers (LSPs) covers entire phases from upstream to downstream and plays a crucial role in the transportation of machinery, drilling equipments, extracted minerals, crude oil & natural gas and refined/ processed products from one place to another.
- Other End Users - Other end user segment captures the external (outsourced) logistics expenditure incurred by the financial services (BFSI), real estate, educational services, healthcare, and professional services (administrative, waste management, legal, architectural, engineering, design, consulting, scientific R&D), on road freight transport service. Logistics Service Providers (LSPs) plays a crucial role in the reliable movement of supplies and documents to/from these industries such as transporting any equipment or resources required, shipping confidential documents and files, movement of medical goods & supplies (surgical supplies and instruments, including gloves, masks, syringes, equipment) to name a few.
- Producer Price Inflation - It indicates inflation from viewpoint of the producers viz. the average selling price received for their output over a period of time. Annual change (YoY) of producer price index is reported as wholesale price inflation in the "Inflation" industry trend. As WPI captures dynamic price movements in most comprehensive way, it is widely used by governments, banks, industry, business circles and is deemed important in formulation of trade, fiscal and other economic policies. The data has been used in adjunction to consumer price inflation for better understanding the inflationary environment.
- Road Freight Pricing Trends - Freight pricing by mode of transport (USD/tonkm), over the review period, has been presented in this industry trend. The data has been used in assessing the inflationary environment, impact on trade, freight turnover (tonkm), road freight transport market demand and hence the road freight transport market size.
- Road Freight Tonnage Trends - Freight tonnage (weight of goods in tons) handled by mode of transport, over the review period, has been presented in this industry trend. The data has been used as one of the parameters apart from average distance per shipment (km), freight volume (tonkm), and freight pricing (USD/tonkm) to assess the freight transport market size.
- Road Freight Transport - Hiring a road freight transport logistics service provider (LSP) or haulier (outsourced logistics), for the transport of commodities constitutes road freight transport market. The scope of study includes (i) road transport of goods reported by hauliers registered in the reporting countries (ii) transport of raw materials or manufactured goods (solids as well as fluids) (iii) transport using commerical motor vehicles (rigid trucks or tractor-trailers, (iv) Full-Truck-Load (FTL) or Less than-Truck-Load (LTL) transport (v) containerized or non-containerized transport (vi) temperature controlled or non-temperature controlled trasnport, (vii) short haul or long haul (Over-the-road, OTR) transport, (viii) used office or household goods transport (movers and packers), (ix) other specialized cargo transport (dangerous goods, oversized cargo) and (x) outsourced first mile/ middle mile/last mile delivery shipments undertaken by road freight transport players. The scope does not include (i) transport undertaken by hauliers registered in other countries (ii) last mile meal delivery market (iii) grocery delivery market (iv) transportation via road network undertaken/ reported by Courier, Express, and Parcel (CEP) players.
- Road Length - As infrastructure plays a vital role in an economy's logistics performance, variables like length of roads, distribution of road length by surface category (paved v/s unpaved), distribution of road length by road classification (expressways v/s highways v/s other roads), have been analysed and presented in this industry trend.
- Segmental Revenue - Segmental Revenue has been triangulated or computed and presented for all the major players in the market. It refers to the road freight transport market specific revenue earned by the company, over the base year of study, in the geography studied (country or region as per the scope of report). It is computed through the study and analysis of major parameters like financials, service portfolio, employee strength, fleet size, investments, number of countries present in, major economies of concern, etc. that have been reported by the company in its annual reports, webpage. For companies having scarce financial disclosures, paid databases like D&B Hoovers, Dow Jones Factiva have been resorted to and verified through industry/expert interactions.
- Short Haul Road Freight Transport - The segment captures the external (outsourced) logistics expenditure incurred by the road freight transport service end users on local trucking (less than 100 miles). It includes the road transport of goods (i) within a single administrative area and its hinterland, (ii) by smaller trucks and pickup trucks (iii) via containerized as well as dry bulk services (iv) intermodal from ports, container terminals or airports, and (v) outsourced first mile/ last mile delivery shipments undertaken by road freight transport players.
- Transport and Storage Sector GDP - Value and growth of Transport and Storage Sector GDP has a direct relation to the freight and logistics market size, and hence road freight transport market size. Therefore, this variable has been studied and presented over the review period, in value terms (USD) and as share % of total GDP, in this industry trend. The data has been supported by concise and relevant commentary around the investments, developments, and current market scenario.
- Trends in E-Commerce Industry - Enhanced internet connectivity and boom in smartphone penetration, coupled with increasing disposable incomes, has led to a phenomenal growth in the e-commerce market globally. Online shoppers require fast and efficient delivery of their orders leading to an increase in the demand for logistics services especially e-commerce fulfilment services. Hence, the Gross Merchandise Value (GMV), historial and projected growth, breakup of major commodity groups in e-commerce industry for the studied geography (country or region as per scope of the report) have been analysed and presented in this industry trend.
- Trends in Manufacturing Industry - Manufacturing industry involves the transformation of raw materials into finished products, while logistics industry ensures the efficient flow of raw materials to the factory, and the transport of manufactured products to the distributors & consumers. Demand-Supply of both industries are highly cross-linked and critical for a seamless supply chain. Hence, the Gross Value Added (GVA), breakup of GVA into major manufacturing sectors, and growth of manufacturing industry over the review period have been analysed and presented, in this industry trend.
- Trucking Fleet Size By Type - Market share of truck types is influenced by factors like geographical preferences, major end user industries, truck prices, local production, truck repair & maintenance service peneteration, customer support, technological disruptions (like electric vehicles, digitalization, autonomous trucks) etc. Hence, the distribution (share % for base year of study) of truck parc volume by type of truck, market disruptors, truck manufacturing investments, truck specifications, truck use & import regulations, and market anticipation over the forecast period have been presented in this industry trend.
- Trucking Operational Costs - The prime reasons for measuring/ benchmarking logistics performance of any trucking company are to reduce operational costs and increase profitability. On the other hand, measuring operational costs helps to identify whether and where to make operational changes to control expenses and identify areas for improved performance. Hence, in this industry trend, trucking operational costs and the variables involved viz. driver wages & benefits, fuel prices, repairs & maintenance costs, tyre costs etc. have been studied over the base year of study, and presented for the geography studied (country or region as per the scope of report).
- Wholesale and Retail Trade - This end user industry segment captures the external (outsourced) logistics expenditure incurred by the wholesalers and retailers, on road freight transport service. The end user players considered are the establishments primarily engaged in wholesaling or retailing merchandise, generally without transformation, and rendering services incidental to the sale of merchandise. Logistics Service Providers (LSPs) plays a crucial role in the reliable movement of supplies to and finished products from production houses to the distributors and finally to the end customer covering activites like material sourcing, transportation, order fulfillment, warehousing & storage, demand forecasting, inventory management etc.
| Keyword | Definition |
|---|---|
| Cabotage | Road transport by a motor vehicle registered in a country performed on the national territory of another country. |
| Cross Docking | Cross docking is a logistics procedure where products from a supplier or manufacturing plant are distributed directly to a customer or retail chain with marginal to no handling or storage time. Cross docking takes place in a distribution docking terminal; usually consisting of trucks and dock doors on two (inbound and outbound) sides with minimal storage space. The name ‘cross docking’ explains the process of receiving products through an inbound dock and then transferring them across the dock to the outbound transportation dock. |
| Cross Trade | International road transport between two different countries performed by a road motor vehicle registered in a third country. A third country is a country other than the country of loading/embarkation and than the country of unloading/disembarkation. |
| Dangerous Goods | The classes of dangerous goods carried by Road are those defined by the fifteenth revised edition of the UN Recommendations on the Transport of Dangerous Goods, United Nations, Geneva 2007. They include Class 1: Explosives; Class 2: Gases; Class 3: Flammable Liquids; Class 4: Flammable solids- substances liable to spontaneous combustion; substances which, on contact with water, emit flammable gases; Class 5: Oxidizing substances and organic peroxides; Class 6: Toxic and infectious substances; Class 7: Radioactive material and Class 8: Corrosive substances, Class 9: Miscellaneous dangerous substances and articles. |
| Direct Shipment | Direct shipment is a method of delivering goods from the supplier or the product owner to the customer directly. In most cases, the customer orders the goods from the product owner. This delivery scheme reduces transportation and storage costs, but requires additional planning and administration. |
| Drayage | A drayage is a form of trucking service that connects the different modes of shipping (intermodal), such as ocean freight or air freight. It’s a short-haul trip that transports goods from one place to another, usually before or after its long-haul shipping process. Drayage trucks move cargo to and from various destinations, such as container ships, storage lots, order fulfillment warehouses, and rail yards. Typically, drayage only transports goods in short distances and operates only in one metropolitan area. It also requires only one trucker in a single shift. But despite this, but it plays an important role in long-haul shipping because it gets the goods to the cargo and vice versa. It makes intermodal transport much more efficient and enables the seamless transfer of goods to the end customer. |
| Dry van | A dry van is a type of semi-trailer that's fully enclosed to protect shipments from outside elements. Designed to carry palletized, boxed or loose freight, dry vans aren't temperature-controlled (unlike refrigerated “reefer” units) and can't carry oversized shipments (unlike flatbed trailers). |
| Final Demand | Final demand includes all types of commodities (goods as well as services) consumed as final use and might include personal consumption, or consumption by government, by businesses as capital investment, and as exports. includes all types of commodities (goods as well as services) consumed as final use and might include personal consumption, or consumption by government, by businesses as capital investment, and as exports. |
| Flatbed Truck | A flatbed truck is a type of truck with rigid design. It has a back body that is flatly shaped for easy loading and unloading of goods. The flatbed truck is mostly used to transport heavy, oversized, wide and indelicate goods such as machinery, building supplies or equipment. Due to the truck open body, the goods transported with it must not be vulnerable to rain. By functionality, the flatbed truck is comparable to a flatbed trailer. |
| Inbound Logistics | Inbound logistics is the way materials and other goods are brought into a company. This process includes the steps to order, receive, store, transport and manage incoming supplies. Inbound logistics focuses on the supply part of the supply-demand equation. |
| Intermediate Demand | Intermediate demand includes goods, services, and maintenance and repair construction sold to businesses, excluding capital investment. |
| International Loaded | Place of loading of goods in reporting country (i.e., country in which the vehicle performing the transport is registered) and place of unloading in a different country. |
| International Unloaded | Place of unloading of goods in reporting country (i.e., country in which the vehicle performing the transport is registered) and place of loading in a different country. |
| OOG cargo | Out of Gauge (OOG) cargo is any cargo that can not be loaded into six-sided shipping containers simply because it is too large. The term is a very loose classification of all cargo with dimensions beyond the maximum 40HC container dimensions. That is a length beyond 12.05 meters – a width beyond 2.33 meters – or a height beyond 2.59 meters. |
| Pallets | Raised platform, intended to facilitate the lifting and stacking of goods. |
| Part load | A part load describes goods which only fills a truck partially. In essence, the quantity of the shipment is bigger than the Less Than Truckload (LTL) shipment. Also, the shipment cannot fully occupy a truck i.e. its capacity is much lower than a Full Truckload (FTL) shipment. |
| Paved Road | Road surfaced with crushed stone (macadam) with hydrocarbon binder or bituminized agents, with concrete or with cobblestone. |
| Reverse Logistics | Reverse logistics comprises of the sector of supply chains that process anything returning inwards through the supply chain or traveling ‘backward’ through the supply chain. |
| Road Freight Transport Service | Hiring a trucking agency for transport of commodities (raw materials or manufactured goods including both solids and liquids) form the origin to a destination within the country (domestic) or cross-border (international) constitutes road freight transport market. The service might be Full-Truck-Load or Less than-Truck-Load, containerized or non-containerized, temperature controlled or non temperature controlled, short haul or long haul. |
| Tautliner vehicle | Tautliner and curtainsider are used as generic names for curtain sided trucks/trailers. The curtains are permanently fixed to a runner at the top and detachable rails/poles at front and rear, allowing the curtains to be drawn open and forklifts used all along the sides for easy and efficient loading and unloading. When closed for travel, vertical load restraint straps are attached to a rope rail beneath the truck bed, connecting the truck bed and curtain along both sides. Winches at either end of the curtain tension it, hence the 'Tautliner' name. This stops the curtain from flapping or drumming in the wind and can also help retain light loads from slipping sideways. |
| Transport for hire or reward | The carriage for remuneration of goods. |
| Unpaved Road | Road with a stabilized base not surfaced with crushed stone, hydrocarbon binder or bituminized agents, concrete or cobblestone. |
Need More Details on Market Definition?
Ask a Question
Research Methodology
Mordor Intelligence follows a four-step methodology in all our reports.
- Step-1: Identify Key Variables: In order to build a robust forecasting methodology, the variables and factors identified in Step-1 are tested against available historical market numbers. Through an iterative process, the variables required for market forecast are set and the model is built on the basis of these variables.
- Step-2: Build a Market Model: Market-size estimations for the forecast years are in nominal terms. Inflation is considered to be a part of the pricing, and the average selling price (ASP) is varying throughout the forecast period for each country
- Step-3: Validate and Finalize: In this important step, all market numbers, variables and analyst calls are validated through an extensive network of primary research experts from the market studied. The respondents are selected across levels and functions to generate a holistic picture of the market studied.
- Step-4: Research Outputs: Syndicated Reports, Custom Consulting Assignments, Databases & Subscription Platforms

Get More Details On Research Methodology
Download PDF


