
5G Enterprise Market Size and Share
Market Overview
| Study Period | 2020 - 2031 |
|---|---|
| Market Size (2026) | USD 8.73 Billion |
| Market Size (2031) | USD 32.08 Billion |
| Growth Rate (2026 - 2031) | 29.74% CAGR |
| Fastest Growing Market | Asia-Pacific |
| Largest Market | North America |
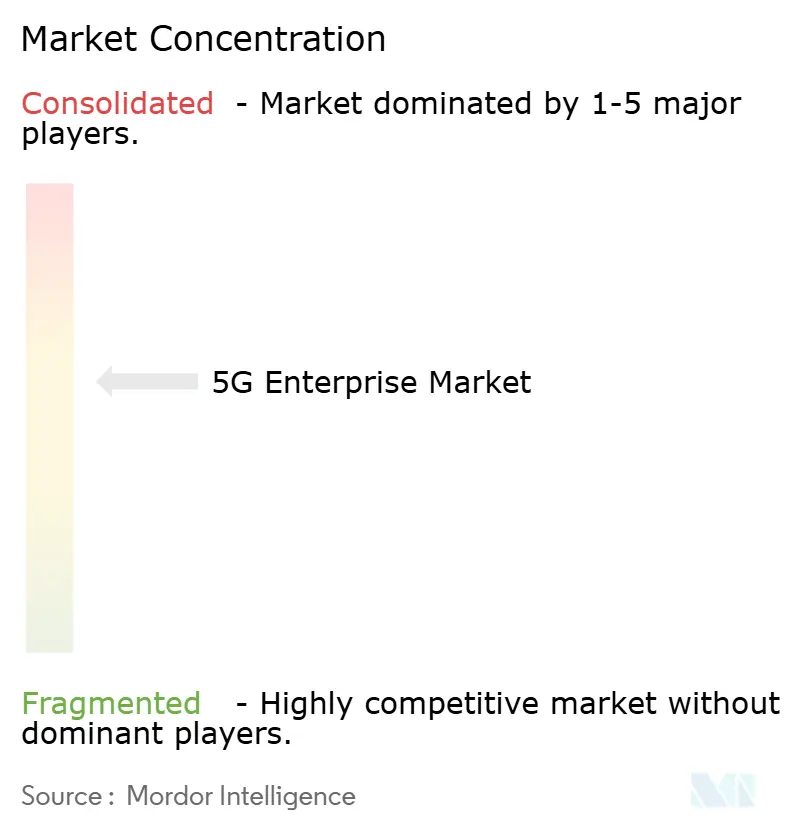
| Market Concentration | Medium |
Major Players *Disclaimer: Major Players sorted in no particular order Image © Mordor Intelligence. Reuse requires attribution under CC BY 4.0. | |
5G Enterprise Market Analysis by Mordor Intelligence
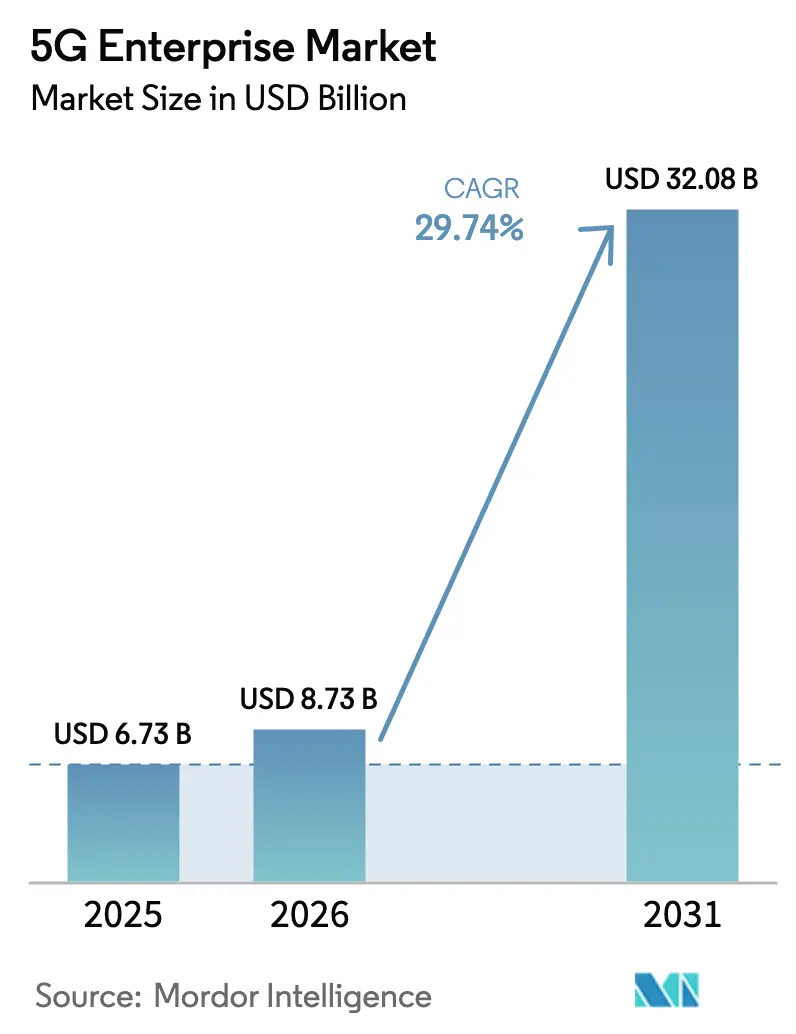
The 5G Enterprise Market size was valued at USD 6.73 billion in 2025 and estimated to grow from USD 8.73 billion in 2026 to reach USD 32.08 billion by 2031, at a CAGR of 29.74% during the forecast period (2026-2031).
This expansion springs from enterprises treating 5G as the digital backbone for automation, analytics, and immersive applications. Robust interest in standalone 5G, already offered by 47 mobile operators, is speeding up adoption of features such as network slicing and ultra-reliable low-latency communications[1]GSMA, “The Mobile Economy Europe 2025,” gsma.com. Private deployments and edge architectures are removing performance bottlenecks, while unlicensed and shared spectrum access is lowering entry barriers. Early industrial rollouts show measurable productivity gains, and satellite-5G partnerships now span 43 countries, broadening coverage footprints. Even so, high capital outlays, brown-field integration complexity, and a pronounced shortage of cross-disciplinary 5G/OT talent temper the near-term uptake.
Key Report Takeaways
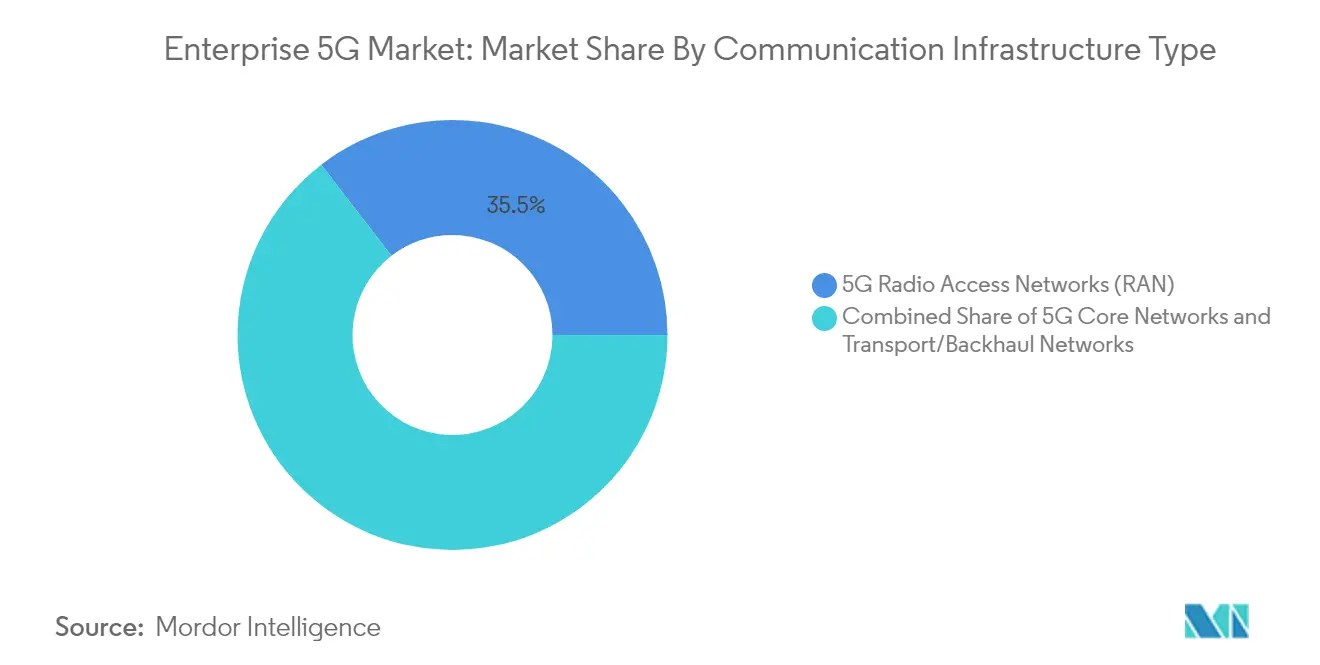
- By communication infrastructure type, Radio Access Networks led with a 35.45% revenue share in 2025, while 5G core networks are projected to advance at a 31.88% CAGR through 2031.
- By deployment model, private networks held 37.60% of 5G enterprise market share in 2025; the same segment is forecast to expand at a 35.48% CAGR to 2031.
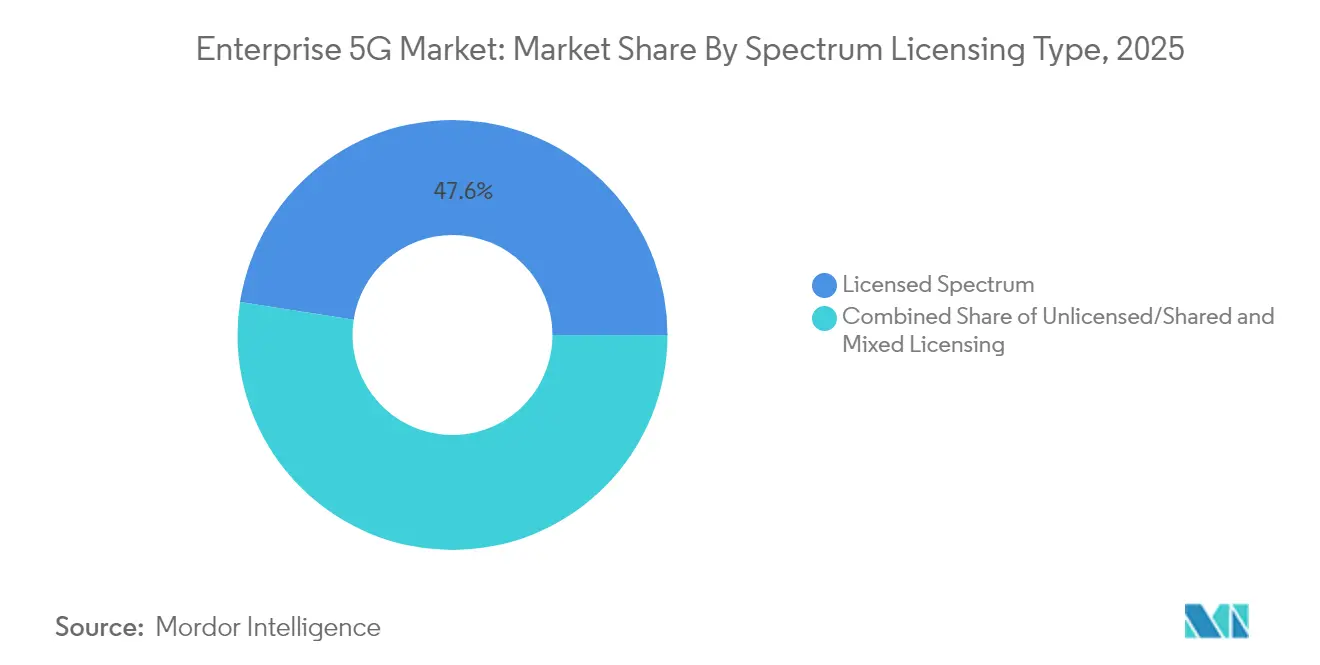
- By spectrum licensing, licensed bands captured 47.55% of the 5G enterprise market size in 2025; unlicensed/shared bands recorded the fastest growth at a 38.85% CAGR.
- By enterprise vertical, discrete manufacturing accounted for 28.85% of the 5G enterprise market size in 2025, whereas healthcare is moving ahead at a 31.5% CAGR.
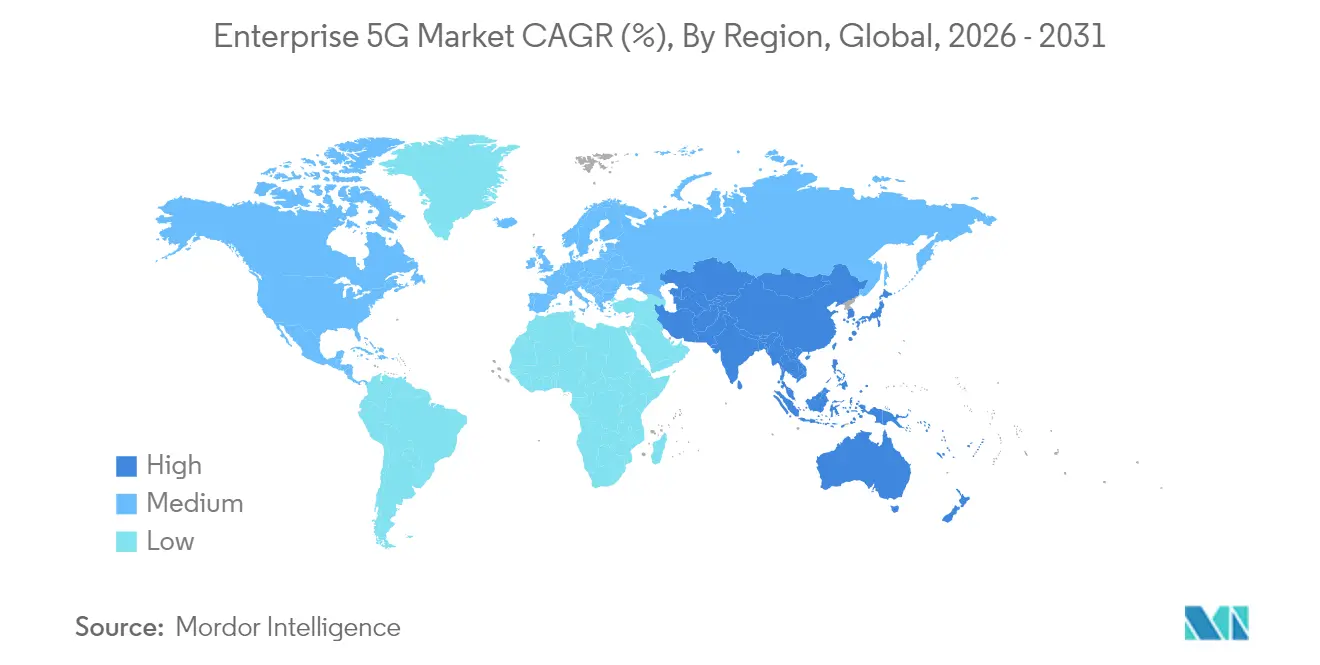
- By geography, North America commanded 37.10% revenue share in 2025; Asia-Pacific is on track for a 32.88% CAGR through 2031.
Note: Market size and forecast figures in this report are generated using Mordor Intelligence’s proprietary estimation framework, updated with the latest available data and insights as of 2026.
Global 5G Enterprise Market Trends and Insights
Drivers Impact Analysis*
| Driver | (~) % Impact on CAGR Forecast | Geographic Relevance | Impact Timeline |
|---|---|---|---|
| Release of unlicensed/shared spectrum | +8.50% | North America, Europe, select APAC countries | Medium term (2-4 years) |
| Edge computing and network slicing | +7.20% | Global, early in North America and East Asia | Medium term (2-4 years) |
| Industrial-IoT adoption in smart plants | +6.40% | North America, Europe, China, Japan, South Korea | Short term (≤ 2 years) |
| Net-zero mandates for energy-optimised 5G | +3.90% | Europe, North America, advanced APAC economies | Long term (≥ 4 years) |
| 5G-TSN convergence for deterministic control | +2.8% | Europe, North America, Japan | Medium term (2-4 years) |
| Non-terrestrial networks for remote coverage | +2.2% | Global, focus on remote regions | Long term (≥ 4 years) |
| Source: Mordor Intelligence | |||
Release of Unlicensed/Shared Spectrum Transforms Enterprise Access
Regulators opening mid-band frequencies have made private 5G viable for firms that once shied away from spectrum fees. In the United States, the Citizens Band Radio Service has already supported more than 250,000 industrial device activations, encouraging similar frameworks in Europe’s 3.8-4.2 GHz band. Siemens anticipates deployments moving from pilots to scale during 2025 as harmonization progresses. Greater flexibility allows factories, logistics hubs, and energy sites to customize coverage footprints, improving uptime and security. Shared spectrum also stimulates a growing ecosystem of network-in-a-box vendors that package radios, edge cores, and management tools as turnkey kits. The cumulative effect is a wider funnel of prospects entering the 5G enterprise market, accelerating time to revenue for suppliers.
Edge Computing and Network Slicing Redefine Enterprise Architectures
Enterprises are refactoring networks so that latency-sensitive workloads sit within meters of connected assets. Operators such as T-Mobile illustrate the concept through priority slices for first responders. Forty-seven operator groups are now standardizing APIs that expose slice configuration to developers, lowering orchestration effort. Combining dedicated slices with on-premises compute nodes helps manufacturers push decision loops below 1 ms, enabling synchronous robotics and vision inspection. A Wray Castle study indicates network slicing can boost overall spectrum utilisation by 40%. These gains feed directly into OpEx savings, reinforcing the value proposition of private-edge architecture inside the 5G enterprise market.
Industrial IoT Accelerates Manufacturing Transformation
Latency under 1 ms and support for one million devices per square kilometer have made massive sensor grids practical on factory floors. Transport and logistics already represented 26% of global 5G IoT links in 2024, with telematics and real-time navigation yielding quick ROI. Pilot plants such as ZTE’s AI-empowered facility report throughput improvements above 30% thanks to closed-loop control. The Manufacturing Institute found that 91% of producers see 5G as central to competitiveness, predicting average cost cuts of 38%. Although only 2% of enterprises had live private networks by late 2024, falling equipment prices and cloud-managed offerings suggest a tipping point is near.
Net-Zero Mandates Drive Energy-Optimized Deployments
Telecom stakeholders are aligning with global climate goals, embedding efficiency metrics into RFPs and design guides. Ten UK connectivity firms representing approximately GBP 50 billion in annual turnover have set joint standards for supplier emissions disclosure[2]Ericsson, “United Kingdom Telecoms Sign Supplier Emissions Commitment,” ericsson.com. Nokia targets net-zero operations by 2040, bundling renewable-powered radios and intelligent cooling as part of its enterprise portfolio. These commitments resonate with buyers facing their own ESG targets, shifting procurement toward low-carbon network gear. In turn, spectrum regulators in Europe and North America reward greener deployments through expedited licensing and policy support, adding momentum to the 5G enterprise market.
Restraints Impact Analysis*
| Restraint | (~) % Impact on CAGR Forecast | Geographic Relevance | Impact Timeline |
|---|---|---|---|
| High CAPEX and integration complexity | -5.80% | Global, greater impact in emerging markets | Short term (≤ 2 years) |
| Scarcity of 5G/OT engineering talent | -4.30% | Global, acute in fast-growing markets | Medium term (2-4 years) |
| Fragmented device-certification ecosystem | -3.1% | Global, varying with regulatory maturity | Medium term (2-4 years) |
| Local-spectrum rules hindering multinational roll-outs | -2.7% | Global, impact on multinational enterprises | Long term (≥ 4 years) |
| Source: Mordor Intelligence | |||
High CAPEX and Integration Complexity Slow Adoption
Standalone 5G cores, multi-band radios, and industrial gateways can push a mid-sized brown-field deployment into multi-million-dollar territory. A 2024 Kyndryl survey showed many firms deferring projects until they blueprint migration paths for legacy SCADA and MES layers. Open RAN promises vendor diversity yet introduces fresh interoperability testing, as flagged by the Open RAN Integration Playbook. Network-as-a-Service models are emerging to smooth cash-flow peaks by shifting spend from capex to OpEx, but clarity around service-level commitments still varies. This financial and technical inertia trims early growth in segments with razor-thin margins.
Scarcity of 5G/OT Engineering Talent Creates Implementation Bottleneck
Enterprises need professionals who grasp both radio optimization and operational workflows, yet the talent pool remains shallow. India alone reports a gap of 2.4 million skilled telecom workers, with employability at 40% of graduates in relevant streams. Ericsson’s academic private 5G network at Tecnologico de Monterrey exemplifies partnerships designed to fill the pipeline. Until supply catches up, integrators are charging premium rates and projects risk delays, capping roll-out velocity for the 5G enterprise market.
*Our forecasts treat driver/restraint impacts as directional, not additive. The impact forecasts reflect baseline growth, mix effects, and variable interactions.
Segment Analysis
By Communication Infrastructure Type: Core Networks Poised for Accelerated Uptake
The 5G Radio Access Network segment generated the largest slice of revenue in 2025 at 35.45%, reflecting its indispensable role in linking endpoints. This foundational investment gave operators and integrators a head starts in monetizing coverage obligations. Rising enterprise need for deterministic performance now shifts attention to cloud-native 5G cores, which are on course for a 31.88% CAGR. The 5G enterprise market size for core solutions is projected to expand sharply as standalone deployments move beyond trials. Network function virtualization lets firms bolt on low-code policy engines, converged charging, and AI-driven assurance, driving higher ARPU per site.
Transport and backhaul, though smaller in absolute terms, are evolving rapidly. Partnerships such as Ericsson with Juniper and ECI Telecom confirm demand for high-capacity packet transport between cell sites and data centers. E-band and emerging W-band links unlock multi-gigabit throughput, complementing fibre in dense industrial parks. These innovations reduce bottlenecks that once throttled remote-vision analytics. As a result, core and transport segments are becoming tightly coupled, expanding their combined wallet share inside the 5G enterprise market.


By Deployment Model: Private Networks Solidify Strategic Relevance
Private deployments captured 37.60% of revenue in 2025, reinforcing the preference for on-premises control. With a 35.48% CAGR, the 5G enterprise market size for private deployments is set to multiply, led by factories, hospitals, and logistics yards that value deterministic Quality of Service. A 2024 Digitalization World survey forecasts global private-5G revenues at USD 6 billion by 2027. Contrast that with public 5G, which suits use cases where coverage breadth outweighs micro latency needs.
Hybrid models are also standing out. Enterprises employ public slices for non-sensitive traffic while reserving a campus-wide micro-core for robotics or AGVs. Neutral-host solutions enable venue owners to share infrastructure costs, facilitating rapid multi-tenant coverage. This approach helps operators penetrate new verticals without redeploying full stacks, broadening addressable revenue streams across the 5G enterprise market.
By Spectrum Licensing Type: Unlicensed Choices Catalyze Growth
Licensed bands commanded 47.55% revenue in 2025 as mobile network operators used existing allocations to serve enterprises. Guaranteed interference protection remains compelling for mission-critical mobility. Unlicensed and shared access, however, posts the fastest 38.85% CAGR. The 5G enterprise market share of unlicensed deployments rises as CBRS and similar models let firms self-provision radios. Entry cost falls and procurement cycles shorten, though enterprises must master interference management.
Hybrid spectrum plans are gaining ground. Organizations route control traffic through licensed mid-band and reserve best-effort data for 60 GHz unlicensed channels. The Wireless Infrastructure Association notes that a balanced allocation across bands improves reliability while containing spend. The net effect is a broader inclusion of small and medium enterprises in the 5G enterprise industry, deepening overall penetration.
By Enterprise Vertical: Healthcare Outpaces All Others
Discrete manufacturing held a 28.85% revenue share in 2025, benefiting from deterministic TSN integration and real-time machine monitoring. Early adopters report production cost drops near 38% alongside productivity hikes above 40%. Process sectors such as chemicals and food are now replicating these gains through sensor-dense environments.
Healthcare moves fastest with a 31.5% CAGR. Tele-ultrasound, remote surgery support, and always-connected ambulances require sustained uplink capacity and single-digit millisecond latency. Studies show 5G enables high-resolution imaging without perceptible delay, improving diagnostic accuracy. BFSI, energy, and utilities trail closely, each trialing blockchain-ready secure channels and grid modernization tools. Retail, e-commerce, and transport use 5G for inventory robotics and real-time fleet telemetry. Collectively, these deployments confirm vertical depth inside the 5G enterprise market.
Geography Analysis
North America commanded the largest regional footprint at 37.10% revenue share in 2025, anchored by early spectrum releases and active systems-integration ecosystems. The United States sees 76% of manufacturers planning private networks, though a recent policy shift caused an 11% dip in short-term enthusiasm. Public funding proposals worth USD 9 billion aim to extend 5G broadband into rural zones, which will widen the customer base. Canada follows with strong incentives for Industry 4.0 testbeds. Together, these initiatives reinforce leadership even as North American coverage ambitions mature.
Asia-Pacific is the fastest climber with a 32.88% CAGR through 2031. China’s 5G+ Smart Factory programs show quantifiable gains in throughput and defect reduction. Japan and South Korea exploit longstanding industrial automation cultures, layering 5G over existing lean-manufacturing cells. India’s telecom-sector skills gap tops 2.4 million workers, which policy makers address via reskilling campaigns lightreading. Despite talent constraints, lower equipment prices bolster adoption among mid-tier enterprises.
Europe retains a solid foothold despite coverage gaps. Germany’s auction of 3.8-4.2 GHz licenses directly to industry pioneers expanded campus network pilots. Pan-EU harmonization simplifies device certification, although total capital investment slid for the first time in seven years to EUR 57.9 billion. Open RAN and edge cloud projects attract new entrants, fueling competitive variety. GSMA expects 5G to contribute over EUR 160 billion to European GDP by 2030. These figures underscore steady, if uneven, progression.
The Middle East and Africa witness growing momentum led by Saudi Arabia’s fresh spectrum auctions, driving vendor revenue up 9% in Q4 2024 for Nokia. Latin America remains in the early adoption phase but benefits from satellite-backed 5G coverage for mining and agriculture. Collectively, global demand diversity positions the 5G enterprise market for broad-based expansion.

Regulatory Landscape
The regulatory environment for enterprise 5G continues to be shaped by spectrum access models and standardization milestones. In February 2026, ITU-R updated IMT-2020 specifications via Recommendation M.2150-3, providing a refreshed reference for compliant 5G radio interface implementations used across public and private deployments. In the United States, the FCC has also tightened mid- and high-band governance with measures such as accelerated construction timelines in the 37-37.2 GHz band (FCC 25-24), aimed at discouraging speculative filings and improving the availability of usable spectrum assets.
Unlicensed and shared spectrum policies are also affecting enterprise architectures that combine 5G with Wi-Fi and edge. FCC rules effective April 27, 2026 expanded 6 GHz unlicensed use by enabling higher power for geofencing-enabled very low power devices, reinforcing coexistence requirements for enterprise deployments rather than reserving 6 GHz solely for enterprise use cases. In Europe, the European Commission reported 75.3% harmonized spectrum assignment for 5G as of 2025. The Radio Spectrum Policy Group (RSPG) advanced work on an upper 6 GHz position and a 6G spectrum roadmap with a 2030 horizon, including the 6425-7125 MHz band as a target for harmonized conditions by 2027, which feeds into long-lead planning for industrial campus networks and device ecosystems.
Value Chain Analysis
The 5G enterprise value chain covers standards and spectrum enablers, equipment and silicon suppliers, core/RAN/transport software providers, systems integration, and managed service delivery into vertical workflows. Standards bodies such as 3GPP (including SA5 for management and orchestration) define the interfaces that underpin multi-vendor deployments, with Release 20 service requirements frozen in June 2025 and architecture work tracking toward broad completion during 2026. On the supply side, integrated vendors and specialist players provide radios, cloud-native cores, edge platforms, and devices, while operators monetize licensed assets through campus services, network slicing, and enterprise-grade SLAs.
Downstream, global system integrators and technology partners increasingly influence enterprise time-to-value by bundling connectivity with cloud, AI, and OT integration, and by operating the network under outcome-based contracts. Multi-vendor operations rely on standardized management patterns, including service-based management and open APIs, to connect telecom telemetry and policy control with enterprise IT and OT tools. This is especially relevant in brownfield plants, where interoperability testing, device certification, and workflow integration tend to be the main delivery bottlenecks. As a result, go-to-market models are shifting toward federated ecosystems that combine telcos, GSIs, hyperscalers, and independent software vendors, particularly for private and hybrid 5G deployments that need ongoing lifecycle management beyond one-time infrastructure installs.
Competitive Landscape
The supplier base is moderately concentrated. Nokia, Ericsson, and Huawei provide full-stack portfolios covering radios, transport, and cloud-native cores, which anchor incumbency across several continents. New entrants focus on private-network simplicity: Celona rallies around a modest-footprint solution that edges into incumbent share, characterizing the contest as a “three-horse race”. Cisco pairs with NEC to supply turnkey private 5G bundles in EMEA, blending NEC’s systems integration experience with Cisco’s standalone core.
Vertical-specific capability marks the next battleground. T-Mobile partners with NVIDIA, Ericsson, and Nokia in an AI-RAN Innovation Center that uses GPU-accelerated analytics to balance cell-edge loads and cut latency. Such differentiation layers artificial intelligence on telecom fundamentals, raising performance ceilings. Suppliers also hedge geopolitical risk: Nokia and Ericsson have expanded U.S. production sites to offset potential tariff costs, a move their CEOs argue keeps total cost of ownership stable for domestic carriers. The 5G enterprise industry thus sees rival camps sharpening propositions around integration speed, AI-ready architectures, and compliance confidence.
White-space opportunities concentrate on healthcare and discrete manufacturing, where tailored SLAs, deterministic networking, and edge analytics remain underserved. Mergers such as Vodafone and Three in the United Kingdom, approved in June 2025, create aggregated spectrum pools and promise GBP 11 billion in new 5G spend, injecting fresh rivalry among enterprise service providers. Strategic outsourcing of AI infrastructure to partners like NVIDIA underscores a growing preference for collaborative ecosystems over solitary rollouts, reshaping partnership dynamics within the 5G enterprise market.
5G Enterprise Industry Leaders
Cisco System Inc.
Telefonaktiebolaget LM Ericsson
Huawei Technologies Co. Ltd.
NEC Corporation
Samsung Electronics
- *Disclaimer: Major Players sorted in no particular order

Market Opportunities and Future Outlook
Enterprise opportunities are concentrating around 5G Standalone as a programmable foundation for slicing, deterministic performance, and tighter coupling with edge compute. Operator and vendor actions in 2026 highlight this shift: Ericsson signed a multi-year framework agreement in March 2026 to modernize SoftBank Corp.'s core network in Japan for 5G SA and 5G Advanced use cases. It also extended a five-year partnership in March 2026 with Virgin Media O2 to support 5G SA evolution across the majority of its UK radio network. These moves expand the addressable base for enterprise-grade slicing and low-latency services that rely on cloud-native cores and policy control.
Private and hybrid networks continue to offer whitespace in manufacturing-led deployments and in multi-site enterprise governance. As of 1Q26, GSA identified 2,003 organizations deploying private LTE or 5G networks worldwide, with 5G representing 48% of these deployments, and manufacturing leading by sector, followed by education, mining, defense, and power utilities. New equipment form factors and software-defined cells further reduce deployment friction, illustrated by Airspan Networks launching AirUnity Small Cells in February 2026 for enterprise and carrier coverage and capacity needs. National programs also reinforce commercial pathways for managed private connectivity; for example, the UK DSIT's 2026 sector study quantified a revenue uplift for Private Enterprise Networks between 2025 and 2031, supporting a stronger procurement pipeline for campus connectivity bundles that combine spectrum access, integration services, and lifecycle operations.
Recent Industry Developments
- July 2026: SK Telecom worked with Samsung, Ericsson, and Nokia on an AI-RAN initiative aimed at supporting autonomous robot factory use cases in South Korea. The collaboration signals deeper convergence of enterprise automation requirements with radio intelligence, raising the strategic value of RAN software and AI tooling in industrial private and hybrid networks.
- June 2026: Ericsson expanded availability of Ericsson Private 5G for Verizon Business private networks internationally, extending the solution to support global enterprise deployments beyond a single-country footprint. The move strengthens multi-site governance options for enterprises that want consistent private network architectures across regions while leveraging an operator-led delivery model.
- September 2024: Ericsson introduced a three-tier enterprise portfolio that included Private 5G Compact and neutral-host options aimed at simplifying private campus deployments. The packaging approach supported faster procurement and deployment by offering more standardized configurations that fit different site sizes and multi-tenant venues.


Research Methodology Framework and Report Scope
Market Definition and Coverage
For this study, the market covers revenues earned from 5G connectivity and related network capabilities that are sold to enterprises and public-sector users, including private or hybrid networks and supporting network platforms that enable low latency and reliable performance.
Scope exclusions: Consumer mobile subscriptions and home-focused fixed wireless access services are excluded from this market sizing.
Segmentation Overview
- By Communication Infrastructure Type
- 5G Radio Access Networks (RAN)
- 5G Core Networks
- Transport/Backhaul Networks
- By Deployment Model
- Private 5G Networks
- Public 5G Networks
- Hybrid/Shared Networks
- By Spectrum Licensing Type
- Licensed Spectrum
- Unlicensed/Shared (e.g., CBRS, LAA)
- Mixed Licensing
- By Enterprise Vertical
- IT and Telecommunications
- BFSI
- Manufacturing - Discrete
- Manufacturing - Process
- Retail and E-commerce
- Healthcare
- Energy and Utilities
- Transportation and Logistics
- Other Verticals
- By Geography
- North America
- United States
- Canada
- Mexico
- South America
- Brazil
- Argentina
- Rest of South America
- Europe
- United Kingdom
- Germany
- France
- Italy
- Spain
- Russia
- Rest of Europe
- Asia-Pacific
- China
- India
- Japan
- South Korea
- ASEAN
- Rest of Asia-Pacific
- Middle East and Africa
- Saudi Arabia
- United Arab Emirates
- South Africa
- Nigeria
- Rest of Middle East and Africa
- North America
Data Sources, Market Sizing, and Validation
Desk Research
Desk research was used to frame the demand environment and the supply ecosystem around enterprise 5G. We relied on public, non-paywalled sources such as ITU statistics, OECD broadband and telecom indicators, the FCC and other national spectrum regulators, GSMA publications, and 3GPP releases to map rollout timelines, spectrum availability, and technology transitions.
To keep the market model grounded, we also reviewed company annual reports, earnings call transcripts, investor decks, and enterprise case studies published via association websites and reputable press. Where needed, paid subscriptions were used for company financials and news screening, and patent databases were reviewed to identify enterprise 5G and private network innovation themes. These examples are not exhaustive, and additional sources were used for data collection, cross-checking, and clarification.
Primary Interviews and Surveys
Primary work focused on validating how enterprise 5G revenues are formed across private networks, hybrid setups, and managed connectivity offers, and how spending differs by vertical demand patterns. We spoke with a balanced mix of network operators, system integrators, and enterprise technology decision-makers across APAC, EMEA, and the Americas, so assumptions like rollout pace, pricing direction, and deployment mix could be checked and adjusted.
Distribution of primary research fieldwork respondents
| Company type | Respondent position | Region |
|---|---|---|
| Top tier: 39% | CXOs: 15% | APAC: 45% |
| Mid tier: 46% | Functional/Unit leaders: 29% | EMEA: 37% |
| Smaller Players: 15% | Managers: 56% | Americas: 18% |
Market-Sizing & Forecasting
Market sizing was built using a top-down approach where telecom investment, spectrum readiness, and enterprise adoption signals were used to reconstruct the addressable spending pool for 5G in business settings, then filtered by deployment mix and monetization maturity. Totals were corroborated with selective bottom-up approximations, such as sampled deal sizes for private or hybrid networks, cross-checked against observed deployment volumes and indicative pricing.
Key inputs used in the model included the pace of standalone core adoption, private network rollout intensity in industrial sites, enterprise device and module readiness, spectrum licensing patterns (licensed versus shared), and the direction of managed service pricing as networks scale. Because forecasting depends on several moving parts, scenario analysis was used around rollout speed and pricing progression, with interview feedback used to keep assumptions realistic by region and enterprise vertical. Where bottom-up visibility is limited, gaps were handled through conservative adoption curves anchored to observed network build activity, then reviewed during validation.
Data Validation & Update Cycle
Outputs were checked through multiple steps to ensure the final totals align with real market signals. We compared the modeled revenue trajectory with independent indicators like spectrum assignments, enterprise network build momentum, and publicly visible 5G rollout milestones, then investigated any sharp jumps before sign-off.
A second analyst review was used to recheck formulas, currency handling, and year alignment, followed by targeted re-contact when assumptions moved outside the range shared by interviewees. Reports are refreshed annually, with interim updates when major policy, macro, or rollout events materially change the outlook. Before delivery, a final review pass is completed so clients receive the latest updated view.
Mordor Intelligence's 5g Enterprise Market Size Versus Other Published Estimates
Published market values for enterprise 5G do not always match, even when the growth story looks similar. Differences usually come from what is counted as enterprise 5G revenue, the year used as the starting point, and how pricing and rollout timing are carried into the forecast.
The table shows a fairly tight 2025 value across sources but a wider gap in later years, which often happens when long-range forecasts apply different adoption curves and include adjacent categories. In Mordor Intelligence's model, enterprise and public-sector spend is counted only when it is linked to 5G connectivity, infrastructure, or managed services for business use cases, rather than factory-gate device revenue that can inflate totals.
Benchmark comparison
| Source | Market Size | Gaps in Research Methodology |
|---|---|---|
| Mordor Intelligence | USD 6.73 B (2025) | |
| Global Research House A | USD 6.52 B (2025) | Uses a similar base-year framing, but its long-dated forecast horizon can compound adoption and pricing assumptions, which may lift the end-year total if enterprise rollout is assumed to accelerate earlier across more verticals. |
| Industry Research Publisher B | USD 8.26 B (2026) | Uses factory-gate valuation and explicitly includes device and equipment categories such as smartphones, tablets, and test tools, which can broaden the revenue pool beyond enterprise connectivity and managed network revenues. |
Reading the three figures together, the biggest spread is explained by scope boundaries and how revenue is recognized, not by a disagreement that enterprise 5G is growing fast. By keeping inputs tied to observable rollout signals and validating pricing and adoption through interviews, our estimate stays traceable to clear demand drivers and repeatable steps.


Key Questions Answered in the Report
What is the current 5G enterprise market size and how fast is it growing?
The 5G enterprise market stands at USD 8.73 billion in 2026 and is projected to reach USD 32.08 billion by 2031, expanding at a 29.74% CAGR.
Which deployment model leads revenue today?
Private 5G networks are ahead with 37.60% revenue share in 2025 and are also the fastest-growing segment at a 35.48% CAGR.
Why are unlicensed and shared spectrum bands important for enterprises?
They remove spectrum-acquisition costs, simplify licensing, and let firms customise coverage, propelling unlicensed/shared deployments at a 38.85% CAGR.
Which vertical is poised for the highest growth through 2031?
Healthcare shows the quickest acceleration with a 31.5% CAGR, supported by telemedicine, remote surgery, and real-time patient monitoring use cases.
What are the main obstacles slowing wider 5G enterprise adoption?
High capital expenditure, integration with legacy systems, and a global shortage of 5G/OT engineering talent are the chief headwinds identified by enterprises and integrators.
How concentrated is the supplier landscape?
A moderate concentration exists: the top five vendors hold just above 60% combined share, giving a score of 6 on a 1–10 scale and leaving competitive space for innovative niche players.
Page last updated on:






