Market Overview
| Study Period | 2020 - 2031 |
|---|---|
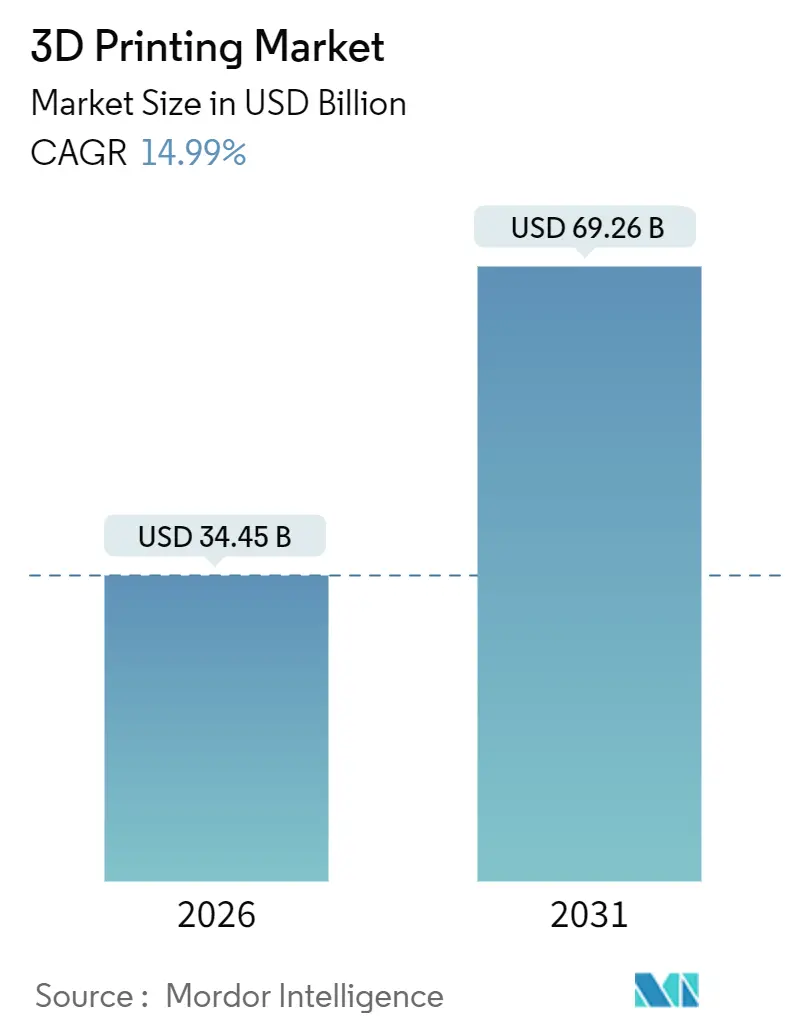
| Market Size (2026) | USD 34.45 Billion |
| Market Size (2031) | USD 69.26 Billion |
| Growth Rate (2026 - 2031) | 14.99% CAGR |
| Fastest Growing Market | Asia Pacific |
| Largest Market | North America |
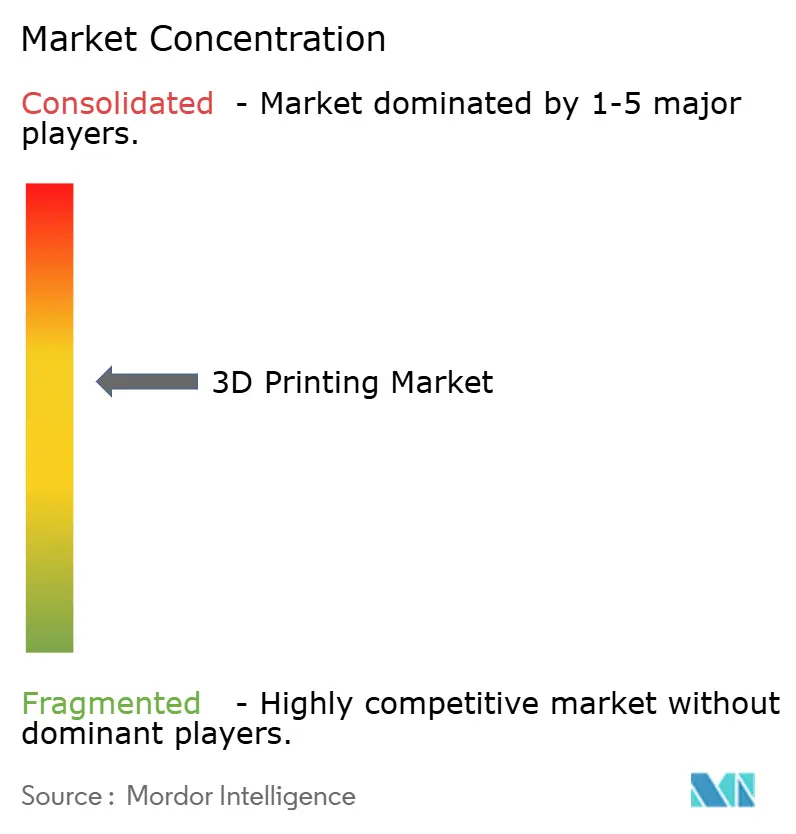
| Market Concentration | Medium |
Major Players *Disclaimer: Major Players sorted in no particular order Image © Mordor Intelligence. Reuse requires attribution under CC BY 4.0. | |
3D Printing Market Analysis by Mordor Intelligence
The 3D printing market size is valued at USD 34.45 billion in 2026, and it is forecast to reach USD 69.26 billion by 2031 while advancing at a 14.99% CAGR, underscoring the broad transition from prototyping toward serial production of certified, end-use parts. Hardware retains a commanding position because metal powder bed fusion and large-format polymer systems still anchor most production budgets; however, services are expanding faster as companies look outside their walls for post-processing, regulatory documentation, and design-for-additive-manufacturing skills. North America holds an early-mover advantage through federally funded Manufacturing USA institutes and Department of Defense flight-qualification programs, whereas Asia Pacific is closing the gap on the back of China’s industrial subsidies and India’s medical-device incentives. Technology leadership sits with powder bed fusion for dense metal parts, yet binder jetting is now carving out a high-volume niche in automotive contracts where geometric complexity is moderate. Material demand is gradually tilting toward titanium, nickel, and aluminum alloys as aerospace and automotive customers unlock weight reduction, fuel-burn savings, and supply-chain resilience that justify premium powder costs.
Key Report Takeaways
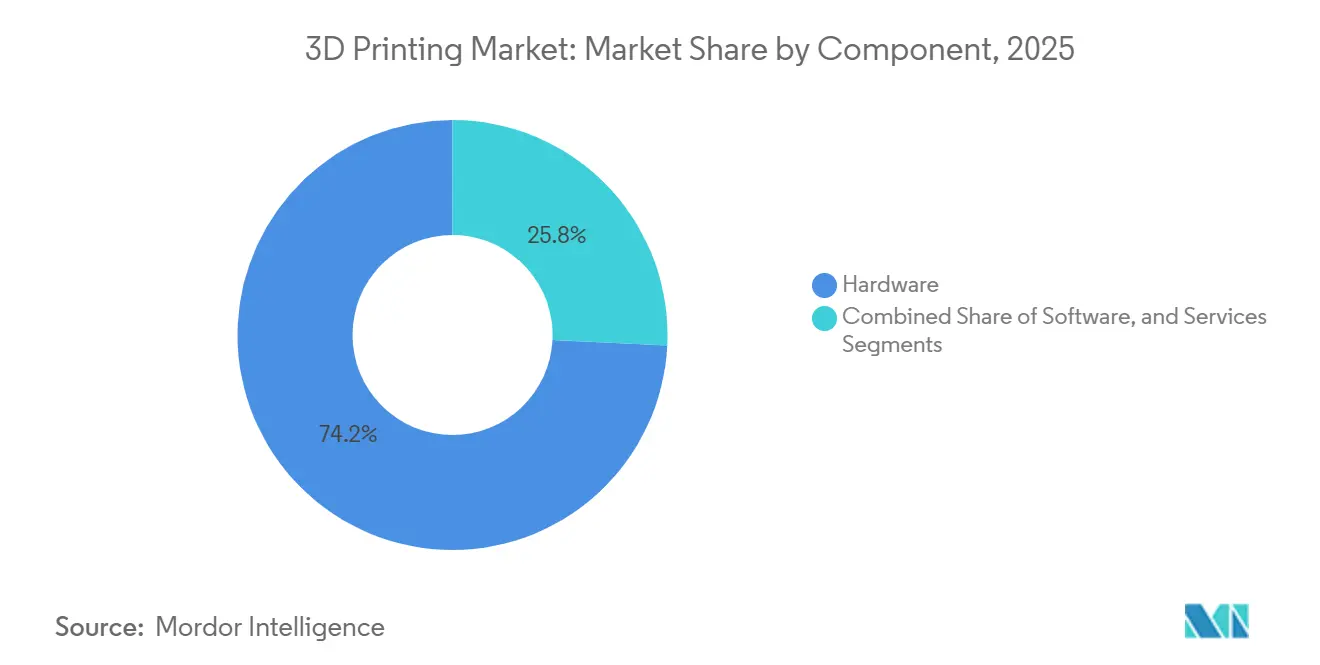
- By component, hardware captured 74.22% of 3D printing market share in 2025, but services are projected to post the fastest 16.22% CAGR through 2031.
- By printer type, industrial systems dominated with 64.56% revenue share in 2025, whereas desktop units are anticipated to advance at a 15.56% CAGR on rising education and SME adoption.
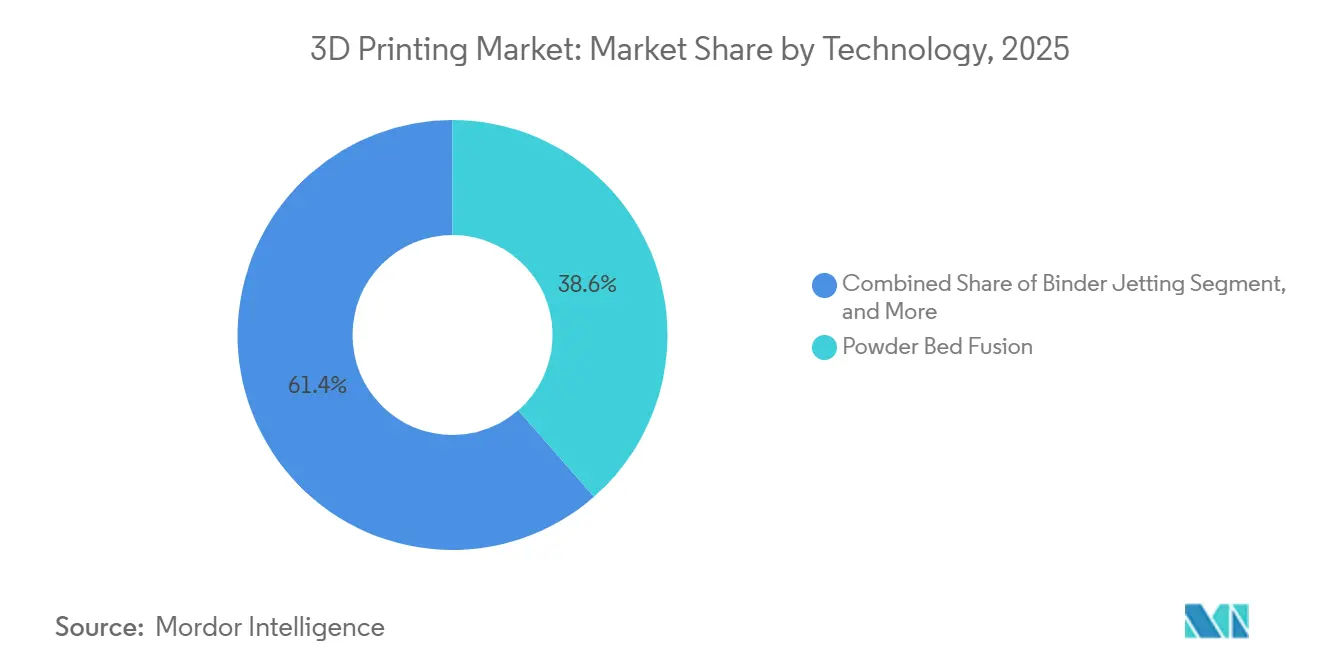
- By technology, powder bed fusion led with 38.56% share in 2025; binder jetting is forecast to record the highest 15.28% CAGR through 2031.
- By material, polymers commanded 44.88% of the 3D printing market size in 2025, while metals and alloys are expected to grow at a 16.82% CAGR as more aerospace programs certify titanium and nickel superalloys.
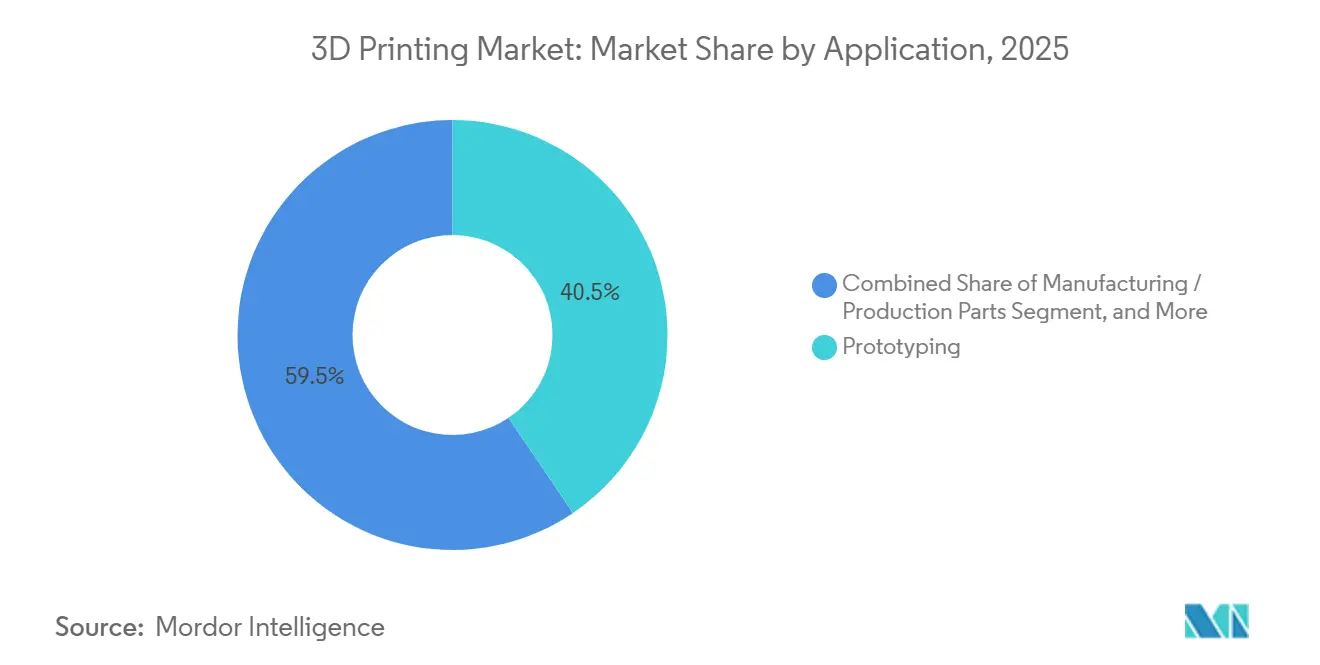
- By application, prototyping accounted for 40.52% revenue share in 2025; manufacturing and production parts are predicted to expand at a 16.46% CAGR to 2031.
- By end-user, aerospace and defense retained the largest 29.64% slice in 2025, whereas healthcare and dental are projected to rise at a 15.02% CAGR given accelerating uptake of patient-specific implants.
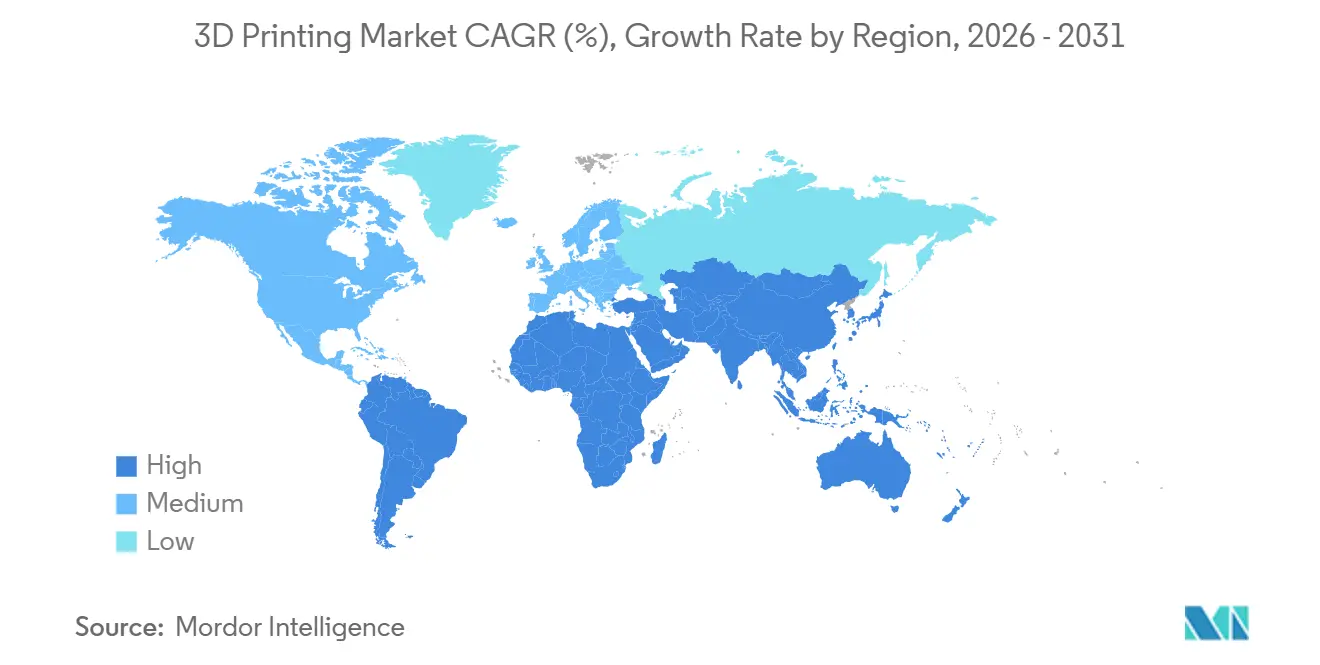
- By geography, North America held 35.72% share in 2025, yet Asia Pacific is on track for the fastest 16.54% CAGR through 2031 on robust Chinese and Indian policy support.
Note: Market size and forecast figures in this report are generated using Mordor Intelligence’s proprietary estimation framework, updated with the latest available data and insights as of January 2026.
Global 3D Printing Market Trends and Insights
Drivers Impact Analysis*
| Driver | (~) % Impact on CAGR Forecast | Geographic Relevance | Impact Timeline |
|---|---|---|---|
| Government-Funded Additive Manufacturing Hubs | +2.4% | North America, spillover to Europe | Medium term (2-4 years) |
| Surging Metal AM for On-Demand Aerospace Spares | +2.8% | Europe, North America aerospace clusters | Medium term (2-4 years) |
| China’s ‘Made in China 2025’ Equipment Subsidies | +2.1% | China, export impact on Asia Pacific | Long term (≥ 4 years) |
| Demand for Patient-Specific Orthopedic Implants | +1.3% | India, Southeast Asia | Medium term (2-4 years) |
| Energy-Sector Lightweight Lattice Heat Exchangers | +1.1% | Middle East (GCC), global energy sector | Long term (≥ 4 years) |
| Rapid Tooling Needs for EV Platforms | +2.6% | Global, concentrated in North America, Europe, China | Short term (≤ 2 years) |
| Source: Mordor Intelligence | |||
Government-Funded Additive Manufacturing Hubs
Federal programs have injected USD 80 million into America Makes since its 2024 expansion, providing shared machines, powder characterization labs, and intellectual-property frameworks that cut per-project qualification costs for SMEs by up to 30%.[1]National Institute of Standards and Technology, “Manufacturing USA Network Expansion,” nist.gov The Office of Naval Research added USD 45 million in 2025 for shipboard metal systems that aim to halve spare-parts inventory on deployed vessels. Momentum accelerated when the CHIPS and Science Act allocated USD 200 million to advanced manufacturing, explicitly covering additive processes for semiconductor tooling. These investments give U.S. machine builders a captive testbed to refine multi-laser coordination, closed-loop melt-pool monitoring, and AI-driven quality analytics. They also shorten the path from R&D to serial production because end-users, regulators, and machine OEMs co-locate inside the hubs, ensuring early, iterative feedback on design allowables and statistical process control.
Surging Metal AM Adoption for On-demand Aerospace Spare Parts in Europe
Materialise secured EN 9100 certification for its Belgian powder bed fusion campus in 2025, unlocking direct supply of titanium and Inconel brackets to Airbus and Safran under rigorous aerospace quality-management requirements. EASA’s Certification Memorandum CM-S-008 slashed average approval time for non-rotating parts from 5 years to 2.5 years, removing one of the most persistent barriers to production scaling.[2]European Union Aviation Safety Agency, “Certification Memorandum CM-S-008,” easa.europa.eu Airbus subsequently produced 30,000 metal ducts and brackets via additive processes in 2025, trimming 12-month forging lead times and reducing part mass by 30%. Rolls-Royce advanced the technology frontier by qualifying titanium-aluminide turbine blades printed through directed energy deposition for its UltraFan demonstrator, the first rotating aero-engine component to earn flight clearance. Airlines that adopt distributed digital inventories now keep smaller physical stocks at regional MRO bases, releasing 20–25% working capital without sacrificing dispatch reliability.
China’s ‘Made in China 2025’ Subsidies for Industrial 3DP Equipment
The National Additive Manufacturing Innovation Center in Xi’an opened in 2024 with CNY 1.2 billion (USD 168 million) in state backing, coordinating powder research across 15 universities and 40 enterprises. Tax rebates of up to 25% on domestic powder bed fusion machines, coupled with low-interest export credits from the China Development Bank, helped Farsoon Technologies and Bright Laser Technologies capture about 60% of Chinese installations by 2025. Competitive pricing, localized service networks, and government procurement preferences all hamper foreign OEMs from expanding share. Accelerated depreciation allowances are also encouraging Chinese tier-one automotive suppliers to place binder-jetting systems that feed both domestic and Southeast Asian factories, creating a self-reinforcing ecosystem for locally sourced powders and spare parts.
Growing Demand for Patient-Specific Orthopedic Implants in India
Stratasys opened a clinical application center in New Delhi in 2024 alongside the All India Institute of Medical Sciences to print titanium spinal cages guided by pre-operative CT scans. India’s production-linked incentive scheme earmarked INR 3,420 crore (USD 410 million) for device makers adopting additive manufacturing, effectively cutting capital costs by 15% for powder bed fusion and post-processing lines. Draft 2025 CDSCO guidance exempted patient-matched implants from full clinical trials if designs fall within an approved envelope, slashing time-to-market by 12 months. As a result, Zimmer Biomet and Stryker have localized build capacity to serve India’s estimated 1.2 million joint replacements per year, while surgeons report 20-30% shorter procedures owing to perfectly fitted acetabular cups.
Restraints Impact Analysis*
| Restraint | (~) % Impact on CAGR Forecast | Geographic Relevance | Impact Timeline |
|---|---|---|---|
| Persistent Certification Bottlenecks for Flight-Critical Parts | -1.8% | North America, Europe aerospace hubs | Medium term (2-4 years) |
| Volatility in High-Performance Metal Powder Pricing | -1.4% | Global, acute in Europe and North America | Short term (≤ 2 years) |
| Limited Printable Material Palette for Food-Contact Applications | -0.6% | North America, Europe | Long term (≥ 4 years) |
| Inter-Operability Gaps Between AM Software and Legacy PLM Suites | -0.9% | Global, concentrated in large enterprises | Medium term (2-4 years) |
| Source: Mordor Intelligence | |||
Persistent Certification Bottlenecks for Flight-Critical Parts
FAA Advisory Circular 20-67 obliges each part number to undergo 30-50 statistically controlled builds before approval, pushing qualification costs well above USD 1 million per component and extending market entry by up to two years. EASA adds a 10-year traceability mandate for powder batches and in-process data, placing a storage and cybersecurity burden on small suppliers. Boeing’s 787 fleet still counts fewer than 20 qualified additive parts despite pilots dating back to 2020, illustrating the drag on widespread adoption. Absence of harmonized global standards forces dual or triple qualification for FAA, EASA, and CAAC, raising redundancy costs. Until regulators converge on statistical-equivalence frameworks, serial production of safety-critical hardware will remain gated, tempering the overall 3D printing market growth trajectory.
Volatility in High-Performance Metal Powder Pricing
Titanium Ti-6Al-4V powder swung between USD 65 and USD 95 per kg in 2025, driven by supply disruptions in Ukrainian sponge titanium output and tight capacity at the gas-atomization plant. Inconel 718 climbed to USD 180 per kg, a 35% jump over 2024, as aerospace demand rebounded faster than atomizers could scale. Although GE Additive’s AP&C unit commissioned a 5,000-tpa plasma atomization line in Canada in late 2025, analysts still forecast a 15-20% shortfall through 2027. Powder reuse mitigates some cost risk, yet oxygen pickup after five to seven cycles forces suppliers to top up with virgin feedstock, exposing them again to spot-market volatility. The unpredictability compels contract manufacturers to embed 20-25% contingencies in bids, eroding price parity with subtractive machining.
*Our forecasts treat driver/restraint impacts as directional, not additive. The impact forecasts reflect baseline growth, mix effects, and variable interactions.
Segment Analysis
By Component: Services Scale Faster as Outsourcing Bridges the Skills Gap
Services revenue is forecast to expand at 16.22% through 2031 while hardware held 74.22% of 3D printing market share in 2025. Post-processing steps, notably heat treatment, hot isostatic pressing, and five-axis CNC finishing, account for 40-50% of metal part cost, incentivizing enterprises to outsource rather than invest in specialized furnaces and inspection rigs. Consultancy packages that bundle generative-design workshops, regulatory coaching, and build-failure analytics are finding traction with aviation, medical, and energy OEMs that lack internal know-how. Materialise posted 22% year-on-year growth in services during 2025 on the back of multi-year agreements with orthopedic-implant makers, confirming that the skills gap is an enduring catalyst. Hardware sales remain essential, yet OEMs are pivoting to usage-based pricing models that wrap machines, powder, and remote monitoring under one subscription, smoothing capex spikes and feeding powder pull-through.
Software occupies the smallest revenue slice, but its strategic importance is climbing because lattice-structure design, generative optimization, and melt-pool simulation directly influence scrap rates and inspection costs. Dassault Systèmes’ 3DEXPERIENCE platform and Siemens NX now embed inverse-process modeling to predict distortion, letting engineers compensate geometry before build. These capabilities, once proprietary to machine OEMs, are migrating into enterprise PLM suites, enabling traceability from design to qualification. As a result, the services segment increasingly includes data-management outsourcing, where bureaus host build-logs and CT scans on secure clouds to satisfy 10-year aerospace retention rules, adding another annuity stream.


By Printer Type: Desktop Units Democratize Entry, Industrial Systems Preserve Throughput
Industrial systems commanded 64.56% of the 3D printing market in 2025 thanks to multi-laser metal platforms and large-bed polymer machines that support serial volumes. Build envelopes exceeding 400 liters, combined with in-situ optical tomography, allow aerospace and automotive suppliers to consolidate multicomponent assemblies into single builds with 99.9% density. However, desktop machines priced below USD 5,000 are proliferating across schools, maker spaces, and SME design studios. Formlabs shipped 100,000 Form 4 stereolithography printers in 2025 by bundling automated resin handling and 25-micron resolution suitable for dental models.
Desktop Metal’s Studio System 2 bridges the gap, offering office-friendly bound-metal deposition that prints stainless-steel parts without loose powder, easing EHS compliance burdens. Falling resin and filament prices, down 15-20% between 2024 and 2025 as commodity suppliers entered the arena, lower consumables barriers. The trajectory suggests desktop growth will feed a future pipeline of engineers literate in design-for-additive-manufacturing, indirectly expanding industrial-machine demand. Nonetheless, automotive tier-ones continue to favor industrial binder-jet and powder bed fusion installations because they meet statistical process-control requirements and integrate with robotic powder-offload lines for 24/7 lights-out operation.
By Technology: Binder Jetting Challenges Powder Bed Fusion on Cost and Speed
Powder bed fusion retained 38.56% revenue share in 2025 by delivering fully dense titanium, Inconel, and aluminum parts crucial for turbine blades and orthopedic implants. Its main constraint is build speed because recoater layers cap throughput, and support-structure removal adds labor. Binder jetting, advancing at 15.28% CAGR, sidesteps both hurdles by dispensing a binder onto thin powder layers, allowing unfettered stacking of parts without supports. HP’s Metal Jet won a multi-year contract with Volkswagen to produce 50,000 shift knobs and mirror mounts per month by 2027, proving mass-production credentials. Desktop Metal’s P-50 single-pass jetting platform introduced in 2025 features anti-balling agents that widen powder recyclability windows and reduce material scrap.
Material extrusion, dominated by fused filament fabrication, remains vital for conceptual prototypes but faces commoditization as sub-USD 300 hobbyist printers flood e-commerce channels. Vat photopolymerization keeps a competitive edge in dental and jewelry where 16-micron z-resolution and pristine surface finish matter more than unit cost. Directed energy deposition claims a niche for repair and cladding of meter-scale parts, while sheet lamination and material jetting serve specialized paper-laminate and pharmaceutical applications respectively. Hybrid machines that combine additive and subtractive heads inside one enclosure are attracting aerospace suppliers who want in-situ finishing of tight tolerance features.
By Material: Metals Gain Momentum as Regulatory Approvals Multiply
Polymers still led 2025 volume at 44.88%, yet metals and alloys are growing at 16.82% through 2031 as titanium Ti-6Al-4V and nickel Inconel 718 receive FAA and EASA clearance for engine brackets and fuel nozzles. Each new qualified material widens design freedom because engineers can now substitute light alloys for stainless parts without re-qualifying the entire assembly. Aluminum AlSi10Mg is under evaluation for crash-critical automotive brackets thanks to weight savings approaching 40% compared with cast alternatives, though fatigue validation remains ongoing. Powder producers face an 8,000-10,000-ton global titanium output ceiling in 2025, well below the 15,000 tons that market analysts believe is needed by 2030.
Ceramics maintain niche relevance in dental crowns and aerospace thermal barriers, where Lithoz’s lithography-based process delivers 10-micron features in zirconia and alumina. Composites, especially continuous carbon-fiber-reinforced nylon, are edging into aerospace interiors, with Markforged’s FX20 able to print components whose tensile strength rivals aluminum at one-third the mass. Emerging research on refractory metals such as tungsten for radiation shielding and copper alloys for heat sinks indicate the material mix will keep diversifying, but powder supplier capacity must scale in tandem.
By Application: Production Parts Climb the S-Curve as Costs Fall
Manufacturing and production parts, growing at a 16.46% CAGR, are eroding prototyping’s 40.52% share because part consolidation and inventory reductions now outweigh powder premiums. GE Aviation prints more than 30,000 LEAP fuel nozzles annually, replacing 20 machined components with a single additive build that cuts weight by 25% and improves durability. Tooling and fixtures benefit when OEMs compress product-development cycles; Ford cites 60% cost savings on F-150 Lightning assembly fixtures compared with CNC machining.
Research and development activity remains brisk across universities exploring high-entropy alloys and gradient structures, while personalized consumer products such as Adidas lattice midsoles demonstrate scalable customization. Inspection overheads, particularly CT scans priced between USD 50 and USD 200 per part, still dampen some production economics, but software-driven porosity prediction is expected to lower sampling rates over time.
By End-User Industry: Healthcare Leads Growth, Aerospace Retains Scale
Healthcare and dental posted a 15.02% CAGR, fueled by Align Technology’s 500 million cumulative clear aligners produced via stereolithography and Stratasys patient-matched orthopedic implants. Personalized guides cut surgery time, freeing scarce operating-room capacity and covering premium device pricing. Aerospace and defense maintained 29.64% of 2025 revenue by leveraging powder bed fusion for turbine blades, ducting, and cabin brackets that cut aircraft weight and save fuel over decades.
Automotive adoption grows around rapid tooling and lightweight brackets; BMW shaved 10% off iX SUV curb weight by deploying 3D-printed ducts and mounts. Consumer electronics remain largely prototyping-centric, though Logitech’s short-run ergonomic peripherals hint at future mass customization. Construction and architecture are nascent, with concrete extrusion dwellings erected in the Middle East for disaster relief, but building-code reviews proceed slowly. Energy, food, and education occupy small yet rising niches as powder prices and regulatory clarity improve.
Geography Analysis
Asia Pacific is forecast to grow at 16.54% through 2031, outstripping every other region and closing in on North America’s 35.72% revenue share logged in 2025. China alone installed 15,000 industrial units that year, representing 40% of global shipments, as Farsoon and Bright Laser dominated domestic demand with two-thirds market share. India’s twin drivers of medical-device localization and low-cost education printers create a bifurcated landscape, but both layers expand total system volume. Japan’s TRAFAM consortium is funneling METI grants into titanium powder expertise, targeting regional-jet components by 2027, while Singapore positions itself as a contract-manufacturing node by integrating additive machines at the Advanced Remanufacturing and Technology Centre.
North America’s growth curve moderates relative to earlier years, yet remains substantial because Lockheed Martin, Northrop Grumman, and General Electric continue to secure defense-driven build quotas that require domestic sourcing under DFARS clauses. Manufacturing USA hubs sustain a pipeline of qualified technicians, and state governments offer matching funds for machine purchases by SMEs, ensuring wider diffusion beyond prime contractors. Europe emphasizes automotive, medical, and advanced ceramics; Germany’s Fraunhofer network helps mid-caps integrate powder bed fusion without bearing full R&D cost. EASA’s streamlined memo further smooths certification, but energy-price volatility may pressure powder suppliers in the short term.
The Middle East invests in energy-sector lattice heat exchangers and concrete extrusion for affordable housing, with Saudi Aramco and ADNOC running pilot lines to minimize offshore logistics costs. Africa and South America remain underpenetrated; Brazil shows promise as Embraer qualifies Inconel brackets for regional jets, yet high import tariffs on machines inhibit widespread adoption. Harmonized ISO/ASTM 52900 terminology and ISO 17296 quality principles foster cross-border component trade, but customs valuation of powder versus finished parts still varies by jurisdiction, creating patchwork compliance costs that only larger firms can absorb.

Competitive Landscape
The top five vendors (Stratasys, 3D Systems, EOS, HP, and GE Additive) held an estimated 35-40% combined revenue in 2025, translating into a moderate concentration that leaves room for vertical specialists and regional challengers. Incumbents pivot toward bundled ecosystems marrying hardware, software, and cloud data services to lock in consumables annuities. HP’s USD 300 million Barcelona expansion added 50 Metal Jet lines to meet Volkswagen and BMW contracts for 10 million binder-jetted parts per year, demonstrating scale commitments few rivals can match.
Acquisitions reshaped the landscape. Desktop Metal bought ExOne for USD 575 million in 2024, consolidating binder-jet IP and a blue-chip customer list, while Nikon’s USD 670 million purchase of SLM Solutions signaled traditional tool-makers’ intent to fold additive into precision-equipment portfolios. Hybrid machine builders DMG Mori and Mazak now offer 5-axis CNC centers with integrated powder nozzles, appealing to aerospace shops that want subtractive surface finishing without re-fixturing. Software interoperability stays contested; Siemens acquired Atlas 3D to deliver one-click orientation alongside its NX CAD, forcing Dassault Systèmes to accelerate its SolidWorks additive plug-ins.
Emerging disruptors exploit niche edges. Velo3D raised USD 150 million in 2025 to scale Sapphire XC multi-laser platforms aimed at turbine-blade contracts requiring low-angle overhangs and minimal supports.[3]Velo3D Inc., “Series E Funding Announcement,” velo3d.com Carbon leverages continuous resin curing for lattice midsoles and elastomeric jigs, planting upfront hardware at customer sites and monetizing resin subscriptions. Renishaw shipped 50 RenAM 500 machines to Oerlikon’s German bureau, signaling appetite for multi-OEM supply chains rather than single-vendor dominance. New entrants must therefore decide whether to chase scale via capital-intensive hardware or differentiate on domain-specific materials, software workflows, and regulatory know-how.
3D Printing Industry Leaders
Stratasys Ltd.
3D Systems Corporation
SLM Solutions Group AG
EOS GmbH
Desktop Metal Inc.
- *Disclaimer: Major Players sorted in no particular order

Recent Industry Developments
- November 2025: HP committed USD 300 million to expand Metal Jet capacity in Barcelona, securing multi-year supply agreements with Volkswagen and BMW totaling 10 million parts annually.
- October 2025: Stratasys unveiled the F3300 fused-deposition printer featuring a 1,000-cc build volume and autoclave-capable ULTEM 9085 processing for aerospace tooling.
- September 2025: Desktop Metal attracted a USD 120 million equity infusion from Koch Industries to scale its Shop System for automotive binder-jet deployments.
- July 2025: GE Additive and Safran qualified Inconel 718 turbine blades on the Concept Laser M2 Series 5 platform, receiving FAA approval for non-rotating engine parts.


Research Methodology Framework and Report Scope
Market Definitions and Key Coverage
Our study treats the global 3D printing market as all commercial revenues from hardware, software, materials, and recurring services that enable layer-wise additive manufacturing of finished or prototype parts from digital files. The universe spans industrial and desktop printers, mainstream polymer and metal feedstocks, and allied design/print workflow tools consumed across end-use industries.
Scope exclusion: purely experimental bio-printers and unassembled hobbyist kits are outside this estimate.
Segmentation Overview
- By Component
- Hardware
- Software
- Services
- By Printer Type
- Industrial 3D Printer
- Desktop 3D Printer
- By Technology
- Vat Photopolymerization (SLA, DLP)
- Powder Bed Fusion (SLS, SLM, EBM)
- Material Extrusion (FDM, FFF)
- Material Jetting
- Binder Jetting
- Directed Energy Deposition
- Sheet Lamination
- By Material
- Polymers
- Metals and Alloys
- Ceramics
- Composites
- Other Materials
- By Application
- Prototyping
- Manufacturing / Production Parts
- Tooling and Fixtures
- Research and Development
- Personalized Consumer Products
- By End-User Industry
- Automotive
- Aerospace and Defense
- Healthcare and Dental
- Consumer Electronics
- Construction and Architecture
- Energy (Oil and Gas, Power)
- Food and Culinary
- Education and Research Institutes
- Other End-User Industries
- By Geography
- North America
- United States
- Canada
- Mexico
- South America
- Brazil
- Argentina
- Rest of South America
- Europe
- Germany
- United Kingdom
- France
- Italy
- Spain
- Russia
- Rest of Europe
- Asia Pacific
- China
- Japan
- India
- South Korea
- Australia and New Zealand
- Southeast Asia
- Rest of Asia Pacific
- Middle East
- Saudi Arabia
- United Arab Emirates
- Turkey
- Rest of Middle East
- Africa
- South Africa
- Nigeria
- Kenya
- Rest of Africa
- North America
Detailed Research Methodology and Data Validation
Primary Research
Mordor analysts interviewed printer OEM sales managers in North America, European metal-powder formulators, Asian service-bureau operators, and procurement heads from automotive and healthcare users. These discussions validated shipment run rates, material consumption ratios, and price erosion curves, especially where public data were thin. They shaped the assumptions used to adjust our global totals.
Desk Research
We collected baseline facts from freely available tier-1 sources such as the United States Census Bureau trade statistics, Eurostat PRODCOM tables, Japan's METI machinery shipment survey, and additive-manufacturing patent volumes drawn via Questel. Company 10-Ks, investor decks, and association portals like ASTM International's F42 committee minutes clarified unit pricing ranges and regulatory touchpoints. Dow Jones Factiva and national customs databases helped us map cross-border printer and powder flows that underpin regional splits. D&B Hoovers supplied audited revenue trails for leading OEMs, assisting revenue attribution by component. The sources named are illustrative; many additional publications informed data checks and context building.
Market-Sizing & Forecasting
We started with a top-down reconstruction of the global demand pool using reported printer shipments and trade data, which are then multiplied by average selling prices sourced from filings and interviews. Selective bottom-up checks, such as roll-ups of the ten largest public OEMs and sampled ASP × volume for polymers, helped fine-tune totals. Key variables inside the model include industrial versus desktop unit mix, polymer-to-metal powder consumption, regional capacity utilization in aerospace and dental labs, patent intensity as a proxy for technology diffusion, and annual ASP deflation. Multivariate regression on these drivers yields the five-year outlook, while scenario analysis captures swings in capex cycles and material input costs.
Data Validation & Update Cycle
Outputs pass three layers of variance screening, peer review, and management sign-off. We re-contact respondents when anomalies exceed preset thresholds and refresh the model every twelve months, with interim updates for material events so clients always receive our most current view.
Why Mordor's 3D Printing Baseline Stands Reliable
Published figures often differ because firms choose dissimilar component mixes, growth levers, and refresh cadences.
Key gap drivers include diverging scope (some tally printers only), reliance on unverified shipment multipliers, or aggressive straight-line CAGR extensions without segment-level ASP controls. Our disciplined inclusion of services and materials, annual model refresh, and dual-path validation make the baseline more dependable for planners.
Benchmark comparison
| Market Size | Anonymized source | Primary gap driver |
|---|---|---|
| USD 29.94 B (2025) | Mordor Intelligence | - |
| USD 16.16 B (2025) | Global Consultancy A | Excludes software and services; limited primary checks; biennial updates |
| USD 24.80 B (2024) | Trade Journal B | Earlier base year; lumps materials with hardware and extends CAGR without ASP validation |
These comparisons show that when scope, variables, and refresh rigor are aligned, Mordor's balanced approach delivers a transparent, repeatable baseline that decision-makers can trust.


Key Questions Answered in the Report
What is the projected value of the 3D printing market by 2031?
It is expected to reach USD 69.26 billion by 2031, reflecting a 14.99% CAGR from 2026 to 2031.
Which segment will grow fastest between 2026 and 2031?
Services, covering post-processing and consulting, is forecast to expand at 16.22% per year as companies outsource additive expertise.
Why is binder jetting gaining traction in automotive production?
Binder jetting eliminates support structures and prints parts 10 times faster than powder bed fusion, enabling contracts such as HP’s Metal Jet deal for 50,000 parts per month with Volkswagen.
How are certification hurdles affecting aerospace adoption?
FAA and EASA rules require extensive statistical builds and long-term data retention, adding up to two years and over USD 1 million per part in qualification cost, which slows rollout of new designs.
Which region is forecast to post the highest growth rate?
Asia Pacific, driven by Chinese subsidies and Indian medical-device incentives, is projected to grow at 16.54% CAGR through 2031.
What materials are moving fastest into production applications?
Titanium Ti-6Al-4V and nickel-based Inconel 718 are leading metals, buoyed by regulatory approvals for aerospace and medical implants.
Page last updated on:


