
3D Printed Medical Devices Market Size and Share
Market Overview
| Study Period | 2020 - 2031 |
|---|---|
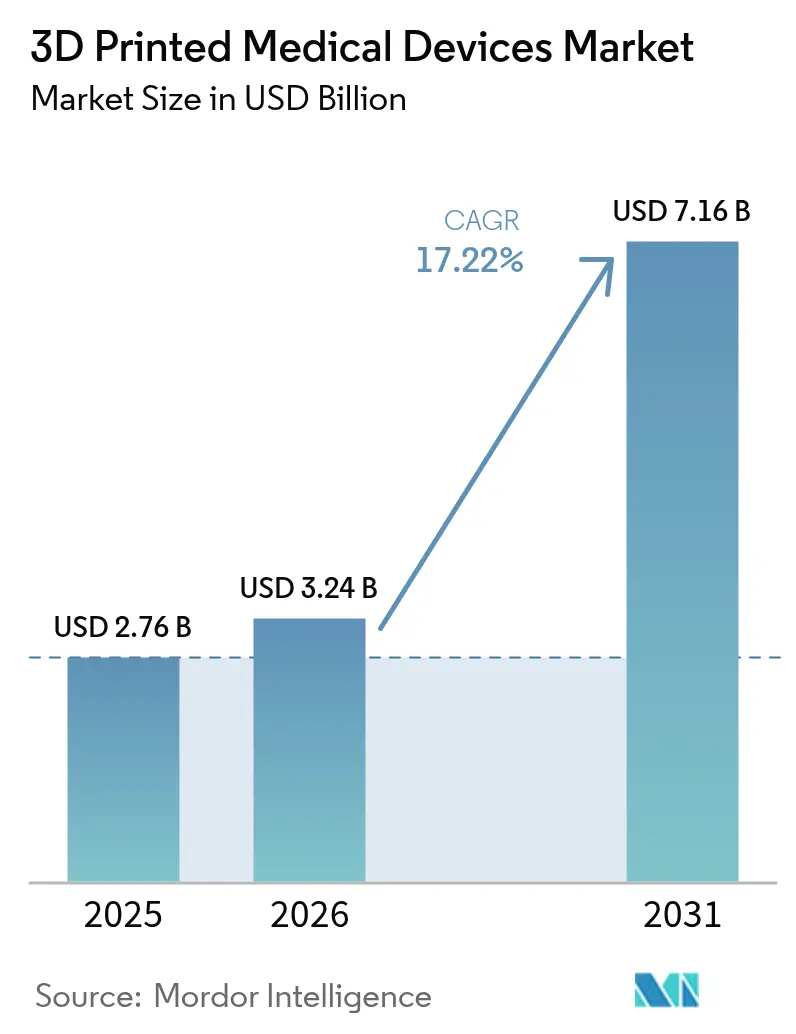
| Market Size (2026) | USD 3.24 Billion |
| Market Size (2031) | USD 7.16 Billion |
| Growth Rate (2026 - 2031) | 17.22% CAGR |
| Fastest Growing Market | Asia Pacific |
| Largest Market | North America |
| Market Concentration | Medium |
Major Players *Disclaimer: Major Players sorted in no particular order Image © Mordor Intelligence. Reuse requires attribution under CC BY 4.0. | |
3D Printed Medical Devices Market Analysis by Mordor Intelligence
The 3D Printed Medical Devices Market size is expected to grow from USD 2.76 billion in 2025 to USD 3.24 billion in 2026 and is forecast to reach USD 7.16 billion by 2031 at 17.22% CAGR over 2026-2031. Adoption accelerates as point-of-care manufacturing shortens lead times, material science improves the performance of polymers and metals, and regulators issue clearer pathways for patient-specific devices. Hospital-owned print laboratories already cut surgical planning time by 62 minutes per case, saving USD 3,720 per procedure while keeping quality under surgeons’ direct control. Laser beam melting continues to anchor high-value orthopedic and cranio-maxillofacial implants, yet binder jetting gains momentum for faster batch production of metal components. Competitive intensity rises as hardware revenues soften; incumbents now pivot toward software, bioprinting partnerships, and workflow automation to defend margins and capture recurring revenue from consumables.
Key Report Takeaways
- By offerings, hardware led with 60.32% revenue share in 2025; software is projected to expand at a CAGR higher than the 17.22% market average through 2031.
- By type, prosthetics and implants captured 38.55% of the 3D printed medical devices market share in 2025, while tissue engineering products are projected to grow at an 18.45% CAGR between 2026 and 2031.
- By material, plastics, including surgical-grade photopolymers, held a 49.22% share; biocompatible polymers are projected to grow at an 18.02% CAGR between 2026 and 2031.
- By technology, laser beam melting held 40.35% of the 3D printed medical devices market share in 2025; binder jetting is projected to expand at an 17.86% CAGR from 2026 to 2031.
- By end user, hospitals and surgical centers accounted for a 47.28% share of the 3D printed medical devices market size in 2025, while specialty clinics are forecast to grow at a 18.01% CAGR from 2026 to 2031.
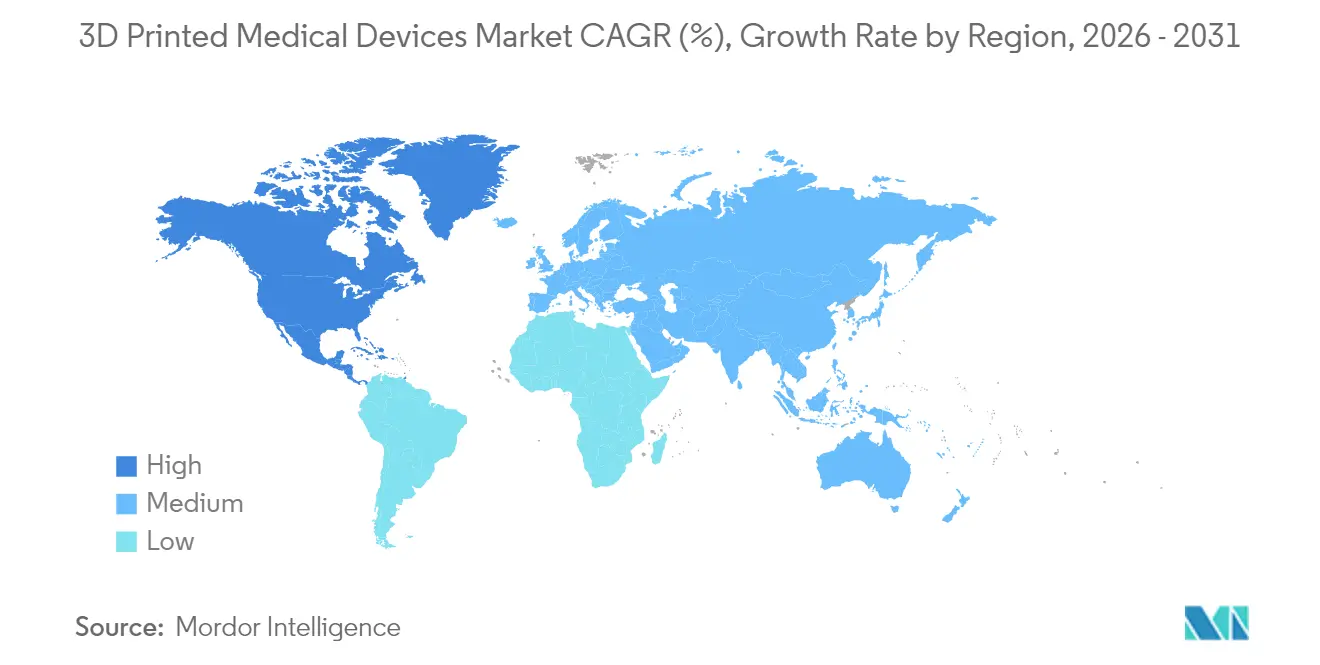
- By geography, North America led with a 45.42% revenue share in 2025; the Asia-Pacific region is expected to grow at a 18.05% CAGR during the forecast period.
Note: Market size and forecast figures in this report are generated using Mordor Intelligence’s proprietary estimation framework, updated with the latest available data and insights as of 2026.
Market Trends and Insights
Drivers Impact Analysis of 3D Printed Medical Devices Market*
| Driver | (~) % Impact on CAGR Forecast | Geographic Relevance | Impact Timeline |
|---|---|---|---|
| Easy mass-customization capability | +4.20% | Global; early uptake in North America and Europe | Medium term (2-4 years) |
| Rising transplant waiting lists | +3.80% | Global; acute in North America and Europe | Long term (≥ 4 years) |
| Cost and lead-time reduction vs. subtractive manufacturing | +3.10% | Global; strongest in developed markets | Short term (≤ 2 years) |
| Surge in hospital-owned point-of-care print labs | +2.90% | North America and Europe; expanding to Asia Pacific | Medium term (2-4 years) |
| ISO/ASTM 52931 biocompatibility standard unlocking new polymers | +2.70% | Global; strongest pull-through in EU/US regulatory environments | Medium term (1–3 years) |
| Defense-funded battlefield bioprinting programs | +2.30% | US (DoD), NATO procurement ecosystems; selective Asia Pacific (Japan, S. Korea) | Long term (3–5+ years) |
| Source: Mordor Intelligence | |||
Easy Mass-Customization Capability
Patient-specific printing removes the constraint of one-size-fits-all devices. Since August 2024, 3D Systems’ EXT 220 MED platform has supported over 60 cranioplasties, each precisely matched to the patient’s anatomy.[1] 3D Systems, “EXT 220 MED delivers 60 successful cranioplasties,” 3dsystems.com Basel surgeons implanted the first MDR-compliant 3D-printed PEEK facial implant in March 2025, bypassing prolonged external supply chains. Operating rooms now generate surgical guides with 100% dimensional accuracy, eliminating the need for iterative template revisions. Complex trabecular structures printed in titanium or PEEK foster osseointegration and mitigate stress shielding, directly improving orthopedic outcomes. The shift from mass production to mass customization underpins higher clinical value and supports premium reimbursement models.
Rising Transplant Waiting Lists
More than 100,000 Americans remain on transplant lists, spurring investment in tissue and organ bioprinting. Bioprinting firms secured a record amount of funding in 2024, and the related market is projected to grow at a 11.8% CAGR through 2034. Galway researchers in 2025 printed contractile heart tissue that morphs under cell-generated forces, bringing functional organs closer to clinical reality.[2]Science Daily, “Shape-changing heart tissues printed at Galway,” sciencedaily.com As vascularization techniques mature, bioprinted constructs are transitioning from research to regulated therapy, positioning the segment as a long-term solution to organ shortages.
Cost and Lead-Time Reduction vs. Subtractive Manufacturing
Additive workflows eliminate the 60-90% material waste typically associated with machining. Hip arthroplasty studies show patient-specific guides shorten procedures from 45.7 minutes to 31.9 minutes and drop blood loss by 88 milliliters. Local printing sidesteps freight delays and reduces inventory write-offs, significant at a time when supply chain expenses equal 20% of medical device revenue. Spare-part production on demand particularly benefits low-volume, high-complexity devices.
Surge in Hospital-Owned Point-of-Care Print Labs
One hundred thirteen US hospitals ran internal 3D labs by late 2024, and Ricoh opened a turnkey point-of-care service in June 2024 that embeds design, printing, and sterilization next to the OR. Yale’s 3D Collaborative for Medical Innovation prototypes surgical instruments in hours, rather than weeks. AI-driven nesting and extended-reality visualization further streamline workflows, cutting design-to-print durations from 100 hours to 18 hours. Embedding quality control inside hospital quality-management systems protects compliance while scaling the model across multi-site systems.
Restraints Impact Analysis of 3D Printed Medical Devices Market*
| Restraint | ( ~ ) % Impact on CAGR Forecast | Geographic Relevance | Impact Timeline |
|---|---|---|---|
| Stringent FDA class-III device clearance pathway | -2.80% | North America; global harmonization | Medium term (2-4 years) |
| High material qualification costs | -2.10% | Global | Short term (≤ 2 years) |
| Shortage of GMP-grade bio-inks | -1.90% | Global; most acute in US/EU (21 CFR / EMA grade requirements) | Medium term (2–4 years) |
| Cyber-sabotage risks in distributed print files | -1.40% | Global; defense + critical care systems highest exposure | Long term (3–5+ years) |
| Source: Mordor Intelligence | |||
Stringent FDA Class-III Device Clearance Pathway
Implantable devices often default to class-III, demanding exhaustive biocompatibility and clinical evidence. ISO 10993-1 guidance can stretch review cycles 12-18 months longer than for traditional forgings. Still, the agency’s 510(k) database logged notable 2024 wins: Curiteva’s PEEK lumbar fusion and Restor3D’s cementless knee replacement gained clearance, illustrating that equivalence arguments are possible even for additively manufactured implants. Achieving predicate alignment remains complex when lattice structures or gradient compositions have no historical analogs.
High Material Qualification Costs
Each new medical-grade polymer or alloy requires toxicity, sterility, and mechanical validation that can cost USD 500,000-1 million. Price pressure worsened in 2024 when PEEK climbed 15-20% and titanium powders rose 25-30% amid geopolitical supply constraints.[3]Evonik, “VESTAKEEP Fusion PEEK pricing update,” evonik.com Smaller firms struggle to amortize these expenses across limited production volumes, risking slower material innovation. Additional hurdles emerge for bio-inks, where batch sterility and cell-culture compatibility compound testing time and documentation.
*Our forecasts treat driver/restraint impacts as directional, not additive. The impact forecasts reflect baseline growth, mix effects, and variable interactions.
3D Printed Medical Devices Market Segment Analysis
By Offerings:
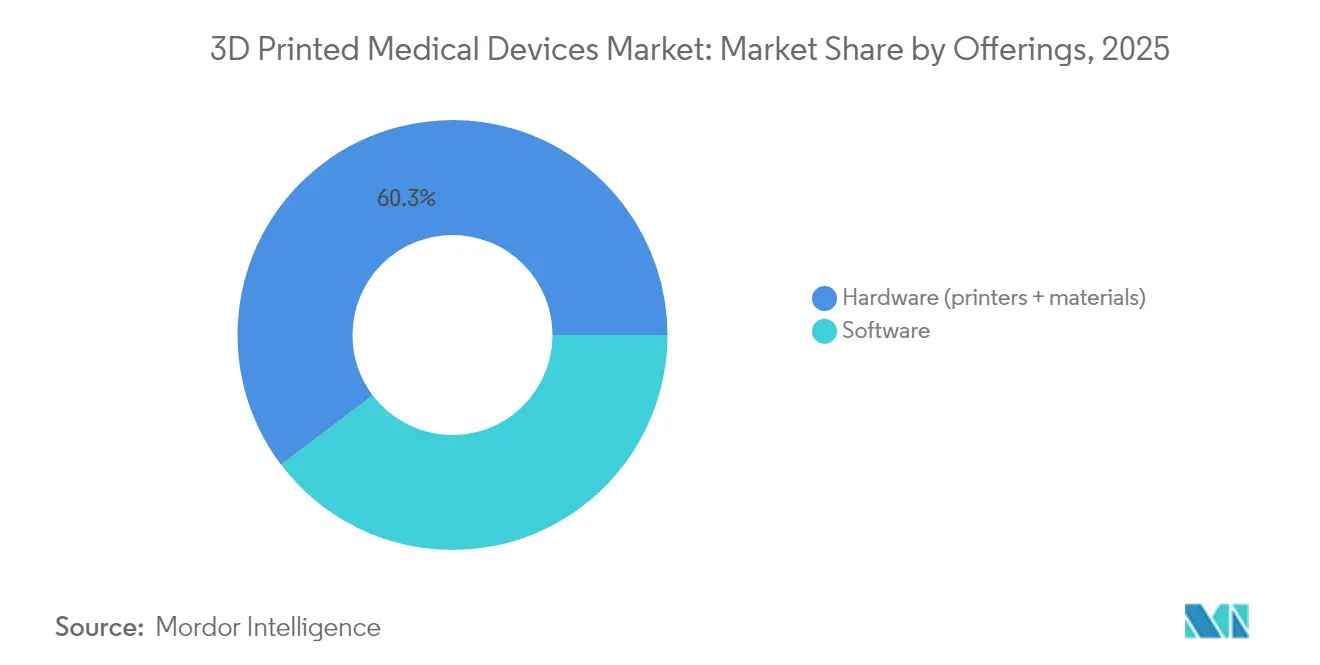
Hardware Dominance Drives Infrastructure InvestmentHardware generated 60.32% of the 3D printed medical devices market size in 2025, as hospitals and service bureaus initially invest in printers and clean-room modifications. Industrial bioprinters cost USD 200,000 to USD 500,000, reinforcing the up-front capital intensity. Printer utilization subsequently generates recurring revenue through polymers, metal powders, and cell-laden hydrogels, a pattern evident as Stratasys posted record consumables revenue despite total sales slipping in 2024.
Printers alone are no longer the sole differentiator of suppliers; workflow software now shortens design iterations, automates support generation, and links directly to sterilization logs. However, Software grows at a rapid rate of 17.64% CAGR during the forecast period (2026-2031). AI-driven platforms cut complex anatomical model preparation from 100 hours to 18 hours, lifting throughput for overstretched clinical engineers. Service offerings remain fragmented, yet health-system buyers increasingly demand integrated ecosystems that combine hardware, validated materials, cloud rendering, and on-site support contracts.


By Type:
Prosthetics Lead While Tissue Engineering AcceleratesProsthetics and implants accounted for 38.55% of the 3D printed medical devices market share in 2025, driven primarily by demand in cranio-maxillofacial and orthopedic applications. Surgeons value latticed titanium hip cups or PEEK skull plates that reduce stress shielding and enable imaging clarity. Regenerative medicine pushes tissue engineering forward at an 18.45% CAGR, outpacing traditional implant growth as scaffold vascularization and immune modulation mature.
Printed surgical guides and instruments further expand the application mix, reducing intraoperative time and enhancing resection accuracy. University Hospital Basel proved regulatory viability when its team implanted the first MDR-compliant facial PEEK device on-site in March 2025. Tissue engineering is expected to register the fastest growth of 18.45% from 2026 to 2031. Tissue engineering will expand into organ-on-chip platforms that support drug discovery, reinforcing the convergence between device and pharmaceutical workflows.
By Materials:
Plastics Dominate as Biocompatible Polymers AdvancePlastics, including photopolymer resins, accounted for 49.22% of revenue in 2025, due to their affordability and versatility for models and non-load-bearing devices. Metal powders remain indispensable for load-bearing implants; however, biocompatible polymers are expected to grow at a rate of 18.02% during the forecast period, driven by PEEK variants that bond with calcium phosphate for superior osseointegration.
Titanium and cobalt-chromium powders still define orthopedic load paths, though new tantalum interspinal cages approved by China’s NMPA in 2025 highlight expanding material portfolios. Ceramic resins hold niche dental positions, balancing aesthetics with bio-inert performance.
By Technology:
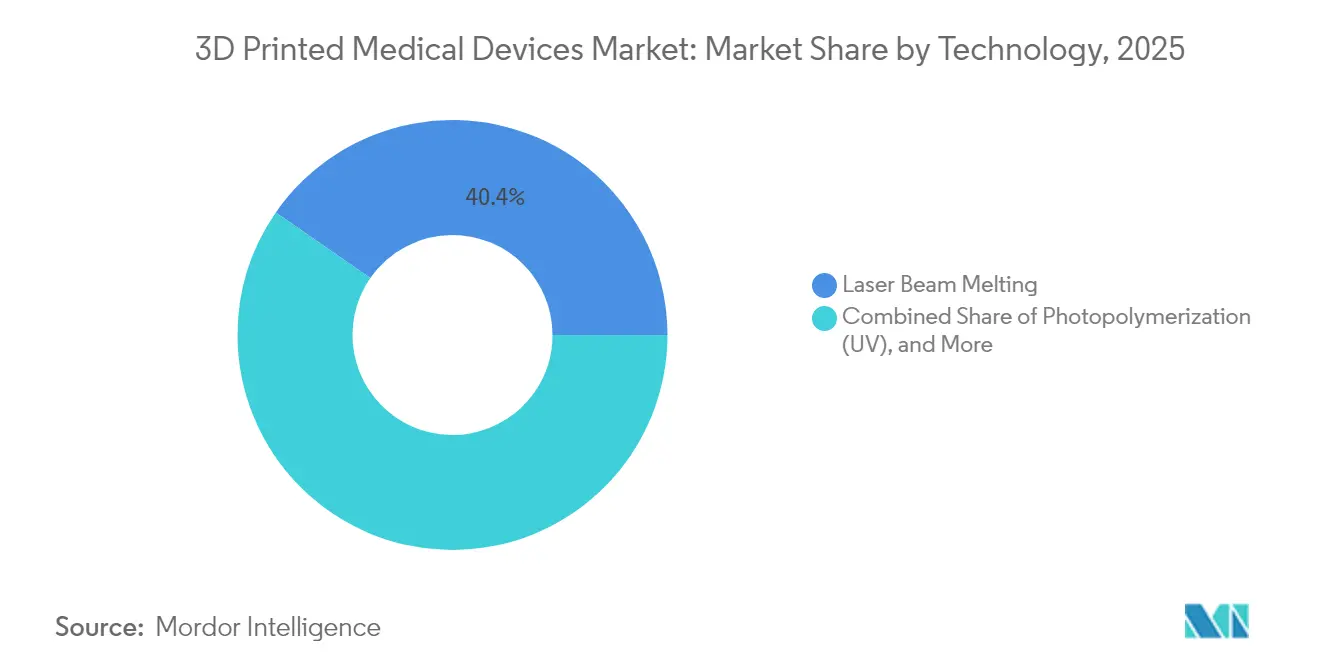
Laser Beam Melting Leads Metal ProcessingLaser beam melting accounted for 40.35% of the 3D printed medical devices market share in 2025, as it repeatedly delivers pore-controlled titanium components crucial for hip and spinal implants. Binder jetting is projected to grow at a 17.86% CAGR through 2031, as high-speed heads produce dense metal parts that require minimal post-processing.
Photopolymerization advances through faster light engines and biocompatible resins, making surgical guides more economical for same-day surgery. Extrusion-based techniques dominate cell-laden bioprinting due to their gentle pressure regimes, which preserve cell viability. Electron beam melting remains specialized for aerospace-grade alloys intended for complex anatomical implants, where lower residual stresses help prevent cracking.
By End User:
Hospitals Drive Point-of-Care AdoptionHospitals and surgical centers accounted for 47.28% of the 3D printed medical devices market size in 2025, validating in-house labs as strategic assets that reduce sterile field preparation time and enhance patient engagement through tactile models. Specialty clinics, such as orthopedic and dental practices, are growing at the fastest rate of 18.01% from 2026 to 2031, adopting desktop polymer printers for niche implants and aligners. This growth is faster than institutional averages, achieved by leveraging agile decision-making.
Academic institutes continue to generate translational breakthroughs while serving as low-risk environments for testing new bio-inks and regenerative constructs. Research consortia linking universities with hospitals expedite first-in-human trials by co-locating cell culture labs, printers, and GMP suites.
Geography Analysis
North America 3D Printed Medical Devices Market
North America contributed 45.42% of global revenue in 2025, reflecting early FDA guidance, mature reimbursement codes, and heavy hospital infrastructure investment. The region’s ecosystem deepens as DARPA channels grants into battlefield bioprinting and smart bandages that merge additive electronics with antimicrobial delivery. Consolidation continues; Enovis paid EUR 800 million for LimaCorporate, expanding its 3D-printed titanium hip portfolio.
APAC 3D Printed Medical Devices Market
Asia-Pacific outpaced the global CAGR with 18.05% during the forecast period. China’s NMPA approved 61 innovative devices in 2024, representing an 11% year-over-year increase that shortens the time-to-market for domestic startups. Japan’s medical device sector is growing at a significant rate annually, driven by aging demographics that demand minimally invasive implants. India harmonizes its regulatory code with IMDRF principles, attracting foreign direct investment for local printer assembly and powder atomization.
Europe 3D Printed Medical Devices Market
Europe balances strict MDR requirements with robust R&D incentives. Germany invests in additive qualifications that transfer know-how from automotive firms to orthopedic suppliers, while UK universities spin out software startups specializing in generative implant design. Sustainability policies that emphasize circular manufacturing favor additive techniques, which reuse powders and eliminate machining waste.

Regulatory Landscape
Regulation of 3D printed medical devices continues to be governed primarily by intended use and risk classification, rather than by the printing method itself, keeping requirements device-specific across polymers, metals, and emerging biofabricated constructs. In the United States, the FDA’s Quality Management System Regulation (QMSR) became effective on February 2, 2026, updating 21 CFR Part 820 to align with ISO 13485:2016 by reference. This tightens expectations around design controls, supplier management, and change control for the digital thread used in patient-matched devices.
In Europe, compliance is anchored in EU MDR 2017/745, where manufacturers and point-of-care producers must support conformity assessment with robust technical documentation and risk management, often under Notified Body scrutiny for implantables and other higher-risk indications. Standards continue to shape validation approaches for additive medical manufacturing, including ASTM F3604-23 for laser powder bed fusion process validation and newer ISO/ASTM machine and data-package standards (such as ISO/ASTM 52938-1:2025 and ISO/ASTM 52951 reaching international standard status in June 2026). These updates reinforce traceability, process capability evidence, and repeatable post-processing controls.
Value Chain Analysis
The value chain starts with patient data capture (CT/MRI) and segmentation, followed by CAD design and simulation. Build preparation and file management then occur within controlled software workflows. Manufacturing proceeds through printing (laser beam melting, binder jetting, photopolymerization, extrusion-based bioprinting), and post-processing steps frequently determine final performance, such as heat treatment or HIP for metals, cleaning, support removal, inspection, and sterilization. Clinical delivery follows through surgeon planning, intraoperative use (guides, models), or implantation (prosthetics and implants), supported by feedback loops into design libraries and complaint handling within the quality system.
Control of the digital thread is increasingly central, linking imaging-to-design software, validated printer parameters, and device history records, particularly as point-of-care labs expand inside hospitals and surgical centers. Upstream inputs such as certified metal powders (for titanium and cobalt-chrome) and biocompatible polymers (including PEEK variants) remain critical, while downstream capabilities depend on validated post-processing, metrology, and sterile packaging aligned with ISO 13485 requirements under the FDA’s QMSR framework. Recent collaborations that bundle design, validation, and metal printing into clinical-adjacent centers (for example, the announced Rambam Health Care Campus, EOS, and PTC Digital Implant Engineering Center) point to vertically integrated, service-enabled networks that reduce handoffs and simplify validation across sites.
Competitive Landscape
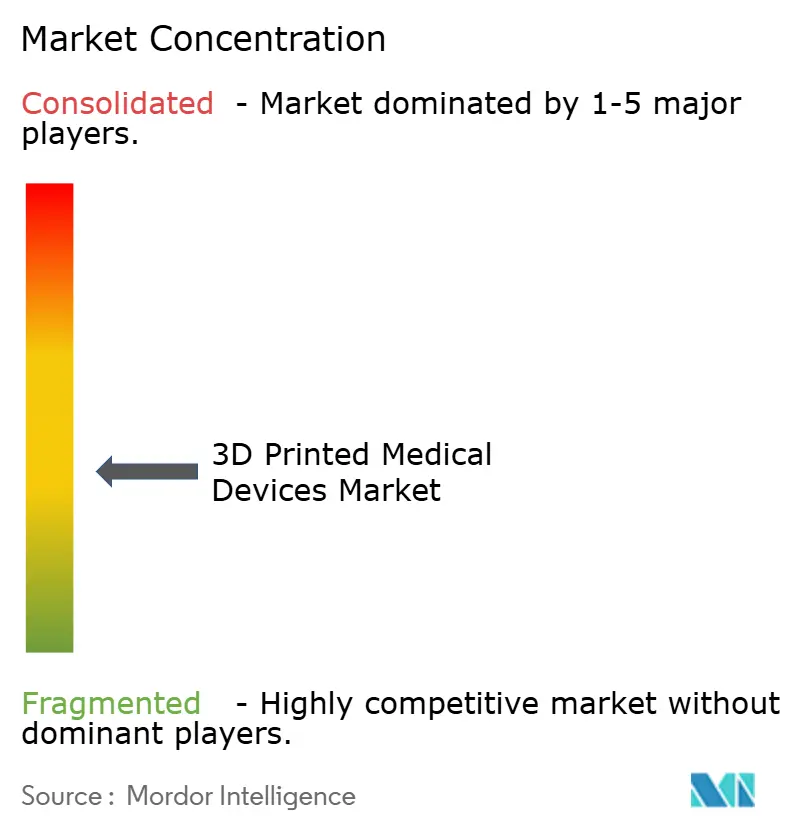
The market remains moderately fragmented. 3D Systems' healthcare revenue declined 21% to USD 40.4 million in 2024, following an accounting shift in its regenerative medicine program; however, it retained clinical momentum through its PEEK cranial series. Stratasys revenue dipped to USD 572.5 million, but a USD 120 million infusion from Fortissimo Capital finances platform consolidation and AI workflows.
Materialise secured FEops to merge cardiovascular simulation with personalized stent planning, while Johnson & Johnson’s USD 16.6 billion Abiomed deal adds heart-recovery technology that may benefit from patient-specific components. Emerging players focus on niche biomaterials, filing patents on stromal cell-laden inks and antimicrobial lattice topologies that integrate directly with hospital sterilizers. Software innovators compete on cloud-based compliance engines that automatically generate production DMRs for MDR and FDA audits, thereby lowering regulatory overhead.
3D-printed medical devices are increasingly being categorized among vertically integrated OEMs, materials science firms, and digital manufacturing platforms. Established leaders in medtech are expanding hybrid additive/subtractive workflows to safeguard their procedural franchises. At the same time, specialists in polymers are hurrying to secure qualified bio-inks and chemistries suitable for implants. On another front, software-centric distributed manufacturing networks, including hospital POC print labs and contract additive service bureaus, are challenging the traditional dominance of centralized manufacturing. The competitive edge is now leaning more towards engines that accelerate regulatory processes, validated libraries of digital parts, and intellectual property in materials, rather than just the hardware of printers.
3D Printed Medical Devices Industry Leaders
3D Systems
Stratasys
Materialise
SLM Solutions
GE Additive
- *Disclaimer: Major Players sorted in no particular order
3D Printed Medical Devices Market Companies Covered in this Report
- 3D Systems
- Stratasys
- Materialise
- EOS GmbH
- SLM Solutions
- Renishaw
- GE Additive
- Carbon
- Desktop Metal
- Organovo
- PrintBio
- Prodways Group
- Curiteva
- Formlabs
- Concept Laser
- Arcam AB
- Dentsply Sirona
- Zimmer Biomet
- Johnson and Johnson (DePuy Synthes)
- Medtronic

Market Opportunities and Future Outlook
A major opportunity is compliance-first software and workflow automation that helps manufacturers and hospital point-of-care labs standardize documentation, traceability, and change control across patient-matched production. The FDA’s QMSR taking effect on February 2, 2026, combined with industry reliance on core standards such as ISO 10993-1 (biocompatibility), ISO 14971 (risk management), and IEC 62304 (software lifecycle), increases the value of platforms that convert imaging-to-print steps into auditable device records while incorporating post-processing into validated manufacturing processes.
Material and process standardization also creates whitespace for qualified material portfolios and validated parameter sets that reduce repeat testing demands for new polymers and metal workflows. The formalization of additive standards for data packages and equipment safety (including ISO/ASTM 52951 reaching international standard status in June 2026, and ISO/ASTM 52938-1:2025 for PBF-LB machine safety) supports more repeatable supplier qualification, multi-site transfer of validated builds, and broader adoption of patient-specific implants and regulated dental applications across regions operating under FDA and EU MDR frameworks.
Recent Industry Developments in 3D Printed Medical Devices Market
- July 2026: Rambam Health Care Campus, EOS, and PTC announced a collaboration to establish a Digital Implant Engineering Center in Haifa, Israel, integrating 3D CAD design, validation, and metal 3D printing for patient-specific implants. The collaboration tightens the clinical-to-manufacturing loop and supports more standardized, auditable production workflows adjacent to care delivery.
- March 2026: Stratasys received CE marking for its TrueDent resins as Class IIa medical devices, expanding its regulated dental footprint in Europe. The certification strengthens the pathway for broader clinical deployment of printed denture workflows under EU requirements.
- December 2025: 3D Systems received US FDA 510(k) clearance expanding VSP Orthopedics indications to include skeletally mature adolescents. The clearance extends the addressable patient population for patient-specific surgical planning and device workflows and reinforces the role of predicate-based submissions for additively enabled applications.


3D Printed Medical Devices Market Report Scope and Research Methodology
Market Definition and Coverage
This market covers the value of medical devices that are produced using 3D printing workflows and then used in patient care, including the supporting device-side software tied to these products. It includes devices that reach clinical use through hospitals, clinics, and other care settings.
Scope exclusions: We exclude general-purpose 3D printing used outside healthcare and non-medical industrial additive manufacturing outputs that are not intended for clinical device use.
Segments Covered in This Report
- By Offerings
- Hardware
- 3D Printers
- FDM Printers
- SLS Printers
- SLA/DLP Printers
- Bioprinters
- Materials
- 3D Printers
- Software
- Hardware
- By Type
- Surgical Guides
- Surgical Instruments
- Prosthetics and Implants
- Orthopedic
- Dental
- Cranio-maxillofacial
- Tissue Engineering Products
- By Materials
- Plastics
- Metal and Metal Alloy Powders
- Biocompatible Polymers
- Ceramics
- By Technology
- Laser Beam Melting
- Photopolymerization (UV)
- Electron Beam Melting
- Extrusion-based
- Binder Jetting
- By End User
- Hospitals and Surgical Centers
- Specialty Clinics
- Academic and Research Institutes
- Others
- By Geography
- North America
- United States
- Canada
- Mexico
- South America
- Brazil
- Argentina
- Rest of South America
- Europe
- Germany
- United Kingdom
- France
- Italy
- Spain
- Russia
- Rest of Europe
- Asia-Pacific
- China
- Japan
- India
- South Korea
- Rest of Asia-Pacific
- Middle East
- Gulf Cooperation Council (GCC)
- Turkey
- Israel
- Rest of Middle East
- Africa
- South Africa
- Egypt
- Rest of Africa
- North America
Data Sources, Market Sizing, and Validation
Desk Research
Desk work starts by building a fact base on procedure demand and where 3D printed devices are used most often, such as orthopedics, dental, and cranio-maxillofacial. We rely on public sources like the US FDA device databases and guidance notes, the US CDC for healthcare utilization signals, OECD Health Statistics for cross-country comparability, and World Bank macro indicators to align healthcare spend and pricing context.
To translate activity into market value, we also review sources such as UN Comtrade for trade flows of relevant materials and finished device categories, and peer reviewed journals that document clinical adoption and outcomes for 3D printed implants, guides, and instruments. Company annual reports, investor presentations, and reputable press releases are used to track product launches and geographic expansion. In a few cases, we also use paid subscriptions for company financials and patent databases to confirm innovation intensity and product focus. These examples are not exhaustive, and we checked many additional public sources for data collection, validation, and clarification.
Primary Interviews and Surveys
Primary interviews and surveys were used to pressure test adoption rates, typical pricing logic, and how purchasing happens across hospitals and surgical centers, specialty clinics, and research-led users. We also used expert inputs to sense check regional differences across APAC, EMEA, and the Americas, especially around regulatory timelines, point of care printing penetration, and the share of demand that is custom versus standard.
Distribution of primary research fieldwork respondents
| Company type | Respondent position | Region |
|---|---|---|
| Top tier: 34% | CXOs: 15% | APAC: 38% |
| Mid tier: 49% | Functional/Unit leaders: 27% | EMEA: 36% |
| Smaller Players: 17% | Managers: 58% | Americas: 26% |
Market-Sizing & Forecasting
Sizing begins with a top-down build where procedure volumes and treated patient pools are reconstructed by region, and then filtered through where 3D printed devices are clinically used. The model is converted to value using price bands by device type and typical customization intensity, and then adjusted for the share produced in hospital print labs versus external supply.
To keep the totals realistic, we corroborate the outputs with selective bottom-up checks such as sampled supplier revenue splits, channel feedback on unit volumes, and ASP x volume approximations for high-penetration areas like dental and orthopedic implants. Inputs that matter in the model include orthopedic and dental procedure counts, implant and guide utilization rates, average selling price progression for metal and polymer based devices, regulatory clearance timing that affects launch ramps, and installed base growth of medical-grade printing systems in care settings. When a bottom-up data point is missing for a country, we bridge it using proxy indicators like procedure intensity per capita and hospital spending mix, and then re-check through primary calls.
Forecasts use scenario analysis supported by regression-based relationships between healthcare activity, adoption curves, and price normalization over time. Assumptions on penetration and ASP trend are revisited with experts so the forecast reflects what buyers and clinicians expect, rather than a straight line extension.
Data Validation & Update Cycle
Validation is done in layers, where model outputs are compared against independent signals such as procedure growth, regulatory approvals trends, and public revenue commentary from major participants. Outliers are flagged, and then the inputs driving the variance are re-checked, followed by a second analyst review before sign-off.
We refresh the report annually, and we also do interim checks when material events occur, such as major regulatory shifts or step changes in adoption for point of care printing. Before delivery, a final pass is completed so clients receive an updated view that reflects the latest publicly available information and recent primary feedback.
Mordor Intelligence's 3d Printed Medical Devices Market Size Compared Against Other Published Estimates
Published market values for 3D printed medical devices often do not match because the included components and the counting logic vary, and then the forecast base year and currency timing add another layer of difference. When these inputs change, even small shifts in adoption rates or pricing assumptions can move the total by a noticeable amount.
3D printers and printing materials are the biggest swing items, and they sit outside Mordor Intelligence's scope for this market. This is why some broader estimates land higher even within the same time window. Gaps also come from how point-of-care production is treated, since some sources count internal hospital printing as equipment spend, while others track device output value only when it is used in a clinical procedure. Differences in how ASP is escalated (single global price curve versus region-specific price bands) and how often assumptions are refreshed can widen the spread further.
Benchmark comparison
| Source | Market Size | Gaps in Research Methodology |
|---|---|---|
| Mordor Intelligence | USD 2.76 B (2025) | |
| Global Consultancy A | USD 4.37 B (2025) | Uses a wider component scope that bundles printers, biomaterials, and related services alongside device output, which lifts the total versus a device-focused view. |
| Industry Publisher B | USD 5.27 B (2026) | Reports a later base year and appears to apply broader product coverage with faster ramp assumptions, and limited clarity is provided on whether equipment and software revenues are separated from device value. |
Looking across the table, the spread is mainly explained by whether equipment and materials are counted, plus how point-of-care activity is translated into market value. By keeping inputs tied to procedure demand, clinical adoption, and clear pricing bands, we end up with a number that can be reproduced and re-checked as new data comes in.


Key Questions Answered in the Report
How fast is the 3D printed medical devices market expected to grow through 2031?
The market is forecast to expand from USD 3.24 billion in 2026 to USD 7.16 billion by 2031, translating to a 17.22% CAGR.
Which segment currently generates the most revenue?
Hardware, including industrial printers and consumables, accounted for 60.32% of market revenue in 2025.
What application area shows the quickest future growth?
Tissue engineering products, supported by bioprinting advances, are projected to grow at an 18.45% CAGR, outpacing traditional implants.
Why are hospitals investing in in-house 3D printing labs?
Point-of-care facilities shorten surgical planning by 62 minutes and cut USD 3,720 in costs per case, while giving surgeons full control over patient-specific devices.
Which technology is gaining share the fastest?
Binder jetting is projected to exceed the overall 17.22% market CAGR as high-speed print heads accelerate metal part production for surgical instruments.
How stringent are FDA requirements for 3D-printed implants?
Implantable devices often fall under class-III, requiring extensive biocompatibility and clinical evidence, which can extend approval by 12-18 months versus conventional devices.
Page last updated on:






