Asia-Pacific Silica Sand Market Size
| Study Period | 2019 - 2029 |
| Base Year For Estimation | 2023 |
| Forecast Data Period | 2024 - 2029 |
| Historical Data Period | 2019 - 2022 |
| CAGR | 6.39 % |
| Market Concentration | High |
Major Players
*Disclaimer: Major Players sorted in no particular order |
Need a report that reflects how COVID-19 has impacted this market and its growth?
Asia-Pacific Silica Sand Market Analysis
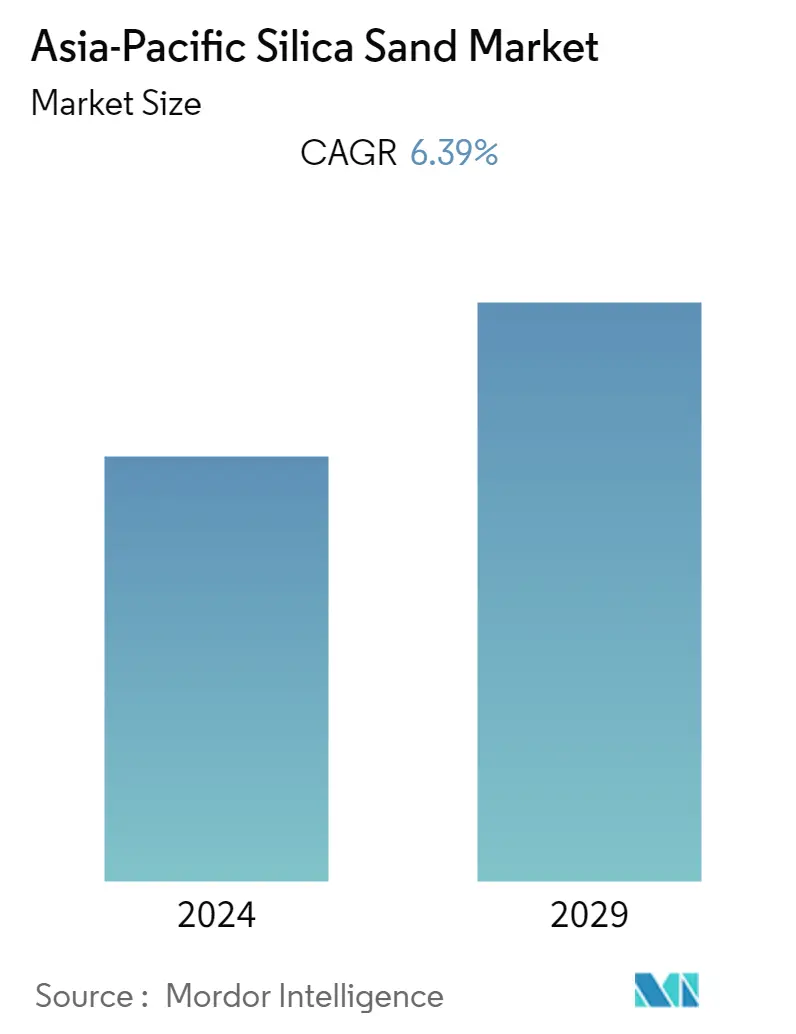
The Asia-Pacific silica sand market is estimated to reach 136.85 million tons by the end of this year and is projected to reach 186.5 million tons in the next five years, registering a CAGR of 6.39% during the forecast period.
- The COVID-19 pandemic affected several industries negatively. The lockdown in most countries in the region caused disruptions in infrastructure and construction activities, mining operations, and freight transportation that disturbed the supply chain in nearly every end-user industry. However, the conditions started recovering in 2021, restoring the market's growth trajectory.
- Over the short term, growing demand from the glass production industry in Asia-Pacific and consumption in the foundry industry are major factors driving the growth of the market studied.
- However, the illegal mining of sand and the availability of substitutes for silica sand are likely to restrain the growth of the studied market.
- Nevertheless, the development of sand-based treatments in dentistry and biotechnology will likely create lucrative growth opportunities for the market in the coming years.
- China represents the largest market for silica sand in the region and is likely to witness strong growth in demand on the back of increasing consumption of silica sand in glass production, oil and gas, and construction industries.
Asia-Pacific Silica Sand Market Trends
Glass Industry to Dominate the Market
- Although silica sand is the primary raw material for glass manufacturing, only high-purity silica sand is used in the process. The reason for such demanding requirements is that the purity of the sand directly impacts the transparency, strength, and durability of the glass. For example, only glass products that are manufactured with high-quality silica sand can meet the optimal vision requirements for vehicle windshields.
- In glass manufacturing, high-quality silica sand makes up around three-quarters of the batch of raw materials used in the glassmaking process. The other quarter is made up of soda, limestone, and clarifying agents, along with a percentage of recycled glass.
- Silica sand finds application in the production of various types of glass, including flat glass, container glass, specialty glass, fiberglass, and others.
- In the Asia Pacific region, China, India, and Japan are among the major contributors to regional glass production. For instance, according to the data published by the UN Comtrade, China's exports of glass and glassware were valued at USD 26.66 billion in 2022. Moreover, glass and glassware products were the 25th most exported products from China in 2022.
- In India, among all sub-segments of glass, float glass experienced strong growth due to increasing demand from the construction and automotive sectors in the country. Additionally, the presence of five float glass producers and 11 float glass lines with an installed capacity of 7.5 kilotons per day contributed to this growth.
- Several glass manufacturers have a presence in Japan. In Japan, glass products are commonly used for packaging. Liquor bottles and food containers were the glass products with the highest production volumes. Glass is infinitely recyclable, reusable, and a more sustainable alternative to plastic packaging. AGC is one of the largest manufacturers of glass. In 2022, AGC represented the most significant glass manufacturing company in Japan, selling glass for approximately JPY 1.7 trillion (USD 11.87 billion). According to the METI, the production volume of tempered glass in Japan amounted close to 22.23 million square meters in 2022.
- The glass industry across the major economies in Asia-Pacific is growing strongly, and the demand for silica sand for glass production is likely to reflect the same trend over the forecast period.
China to Dominate the Regional Market
- China dominates the Asia-Pacific silica sand market owing to the vivid presence of the glass manufacturing industry and the growing adoption of glass in several industries, including construction and automotive.
- The glass manufacturing industry is exhibiting strong growth in the country, which is likely to continue to support the growth of the silica sand market in the coming years.
- According to the National Bureau of Statistics of China, China produced approximately 43.07 million square meters of reinforced glass in April 2023. Additionally, in 2022, the total production of reinforced glass amounted to nearly 580 million square meters.
- In 2022, the annual output of photovoltaic rolled glass was 16.062 million tons, an increase of 53.6% year-on-year.
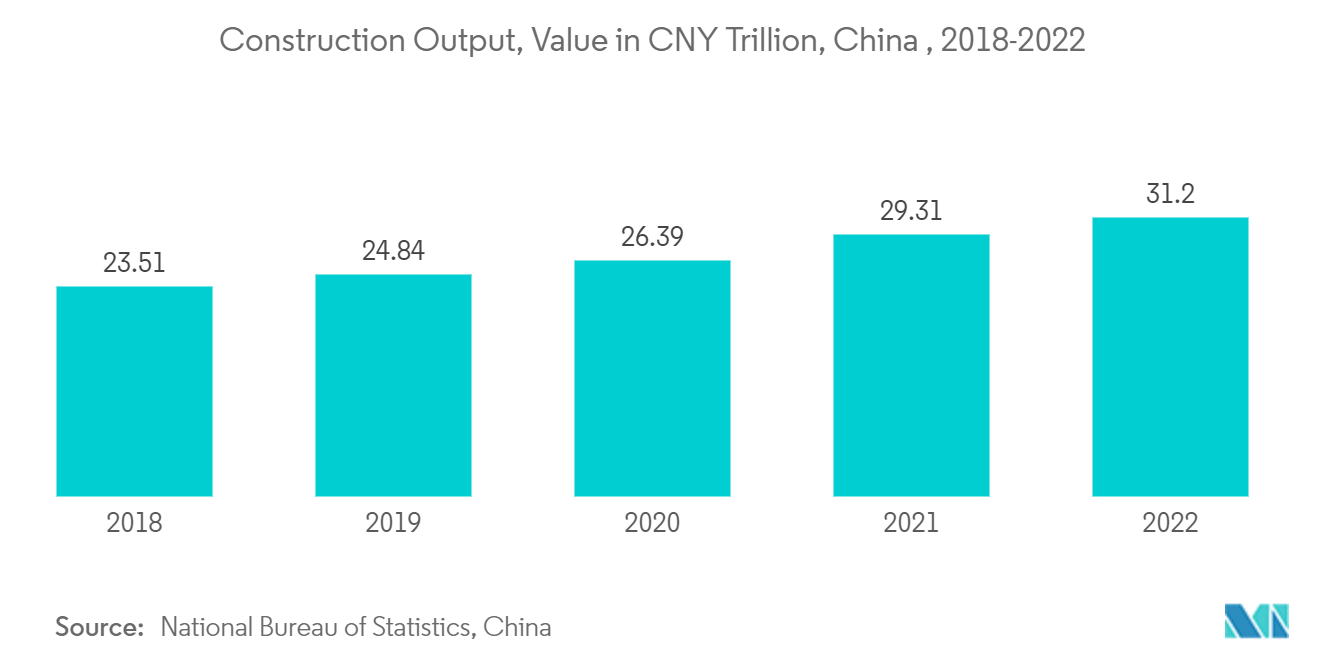
- The construction sector is a key player in China's continued economic development. China is amid a construction mega-boom. According to the National Bureau of Statistics of China, the value of construction output accounted for CNY 31.2 trillion (USD 4.5 trillion) in 2022, up from CNY 29.3 trillion (USD 4.2 trillion) in 2021. China is expected to spend nearly USD 13 trillion on buildings by 2030, creating a positive outlook for the industry.
- The overall Chinese construction industry is expected to increase by 4.6% in real terms over the period 2023-2026. As per the report published by the National Bureau of Statistics of China, transportation investment increased by 6.7% year-on-year in the first half of 2022.
- In the case of long-term plans announced by the Chinese government for infrastructure development, the development of 162,000 km of expressways is planned by 2035.
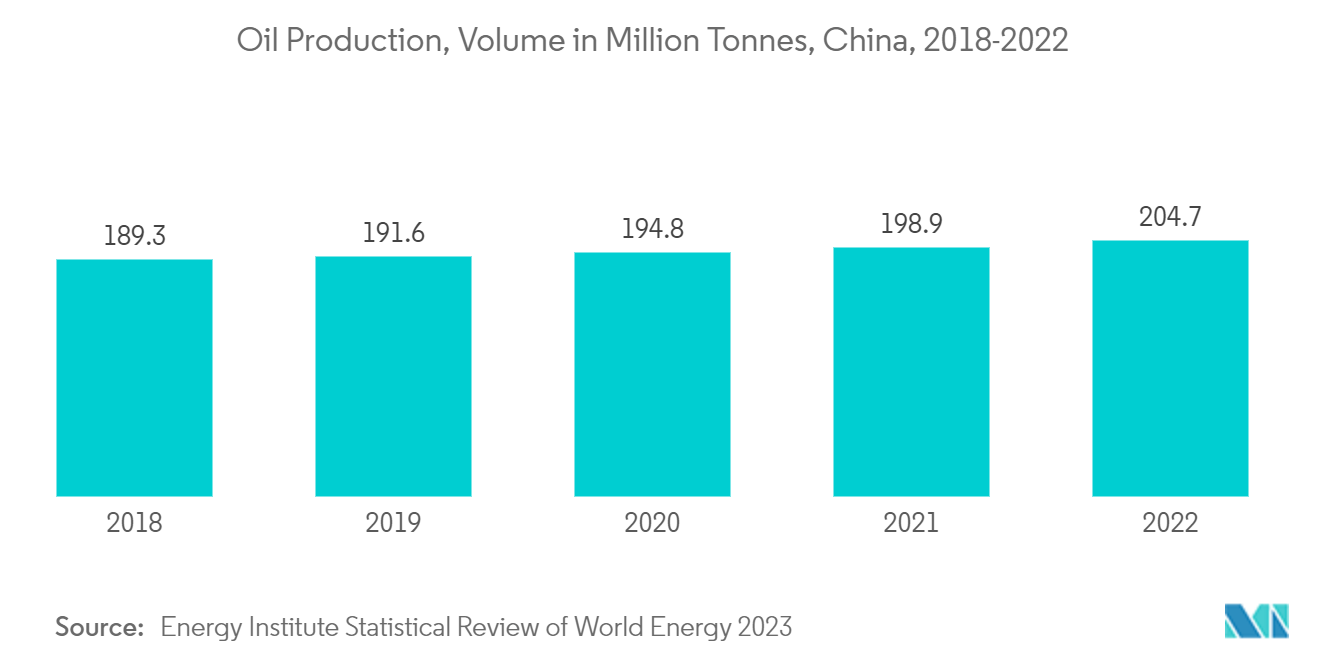
- The oil and gas sector is one of the largest application industries for silica sand in China. China has been investing to scale up its refining capacity over the past two decades for its growing economy. Moreover, for a long-term period, China has continuously expanded its refining capacity for all types of crudes.
- According to Institute for Energy Research, China is likely to register 20 million barrels of refining capacity at the end of 2025, which will trigger the demand for silica sand in the upcoming years.
- Moreover, oil production in China has also increased in 2022. China produced 4.11 million barrels of oil per day, an increase of 2.9% over 2021 figures.
- Such trends and developments across the major end-user industries are expected to drive the demand for silica sand in China over the forecast period.
Asia-Pacific Silica Sand Industry Overview
The Asia-Pacific silica sand market is consolidated in nature. The major players include (not in any particular order) Sibelco, Chongqing Changjiang River Moulding Material Group Co. Ltd (CCRMM), JFE Mineral & Alloy Company Ltd, PUM Group, and Mitsubishi Corporation, among others.
Asia-Pacific Silica Sand Market Leaders
-
Sibelco
-
Chongqing Changjiang River Moulding Material Group Co. Ltd (CCRMM)
-
JFE Mineral & Alloy Company Ltd
-
PUM Group
-
Mitsubishi Corporation
*Disclaimer: Major Players sorted in no particular order
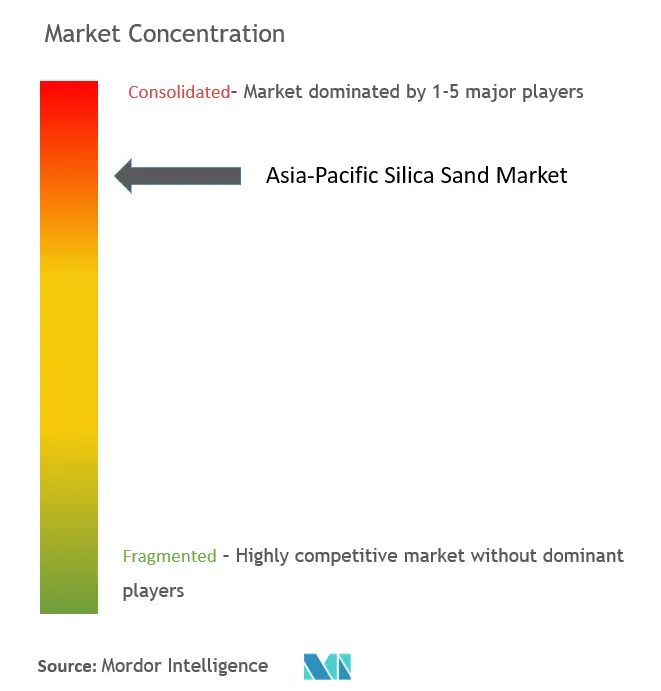
Table of Contents
1. INTRODUCTION
1.1 Study Assumptions
1.2 Scope of the Study
2. RESEARCH METHODOLOGY
3. EXECUTIVE SUMMARY
4. MARKET DYNAMICS
4.1 Drivers
4.1.1 Growing Demand from the Glass Industry
4.1.2 Increasing Consumption in the Foundry Industry
4.1.3 Other Drivers
4.2 Restraints
4.2.1 Availability of Substitutes
4.2.2 Illegal Mining of Sand
4.3 Industry Value Chain Analysis
4.4 Porter's Five Forces Analysis
4.4.1 Bargaining Power of Suppliers
4.4.2 Bargaining power of Buyers
4.4.3 Threat of New Entrants
4.4.4 Threat of Substitute Products and Services
4.4.5 Degree of Competition
5. MARKET SEGMENTATION (Market Size in Volume)
5.1 End-User Industry
5.1.1 Glass Manufacturing
5.1.2 Foundry
5.1.3 Chemical Production
5.1.4 Construction
5.1.5 Paints and Coatings
5.1.6 Ceramics and Refractories
5.1.7 Filtration
5.1.8 Oil and Gas Recovery
5.1.9 Other End User Industries (Food Processing, Industrial Abrasives and Sports Fields)
5.2 Geography
5.2.1 China
5.2.2 India
5.2.3 Japan
5.2.4 South Korea
5.2.5 ASEAN Countries
5.2.6 Rest of Asia-Pacific
6. COMPETITIVE LANDSCAPE
6.1 Merger & Acquisitions, Joint Ventures, Collaborations, and Agreements
6.2 Market Share (%)**/Ranking Analysis
6.3 Strategies Adopted by Leading Players
6.4 Company Profiles
6.4.1 Chongqing Changjiang River Moulding Material Group Co. Ltd (CCRMM)
6.4.2 Hebei Shenghuo New Material Technology Co., Ltd.
6.4.3 JFE Mineral & Alloy Company Ltd
6.4.4 Mangal Minerals
6.4.5 Mitsubishi Corporation
6.4.6 PUM Group
6.4.7 Petrazehra Berhad
6.4.8 Sibelco
6.4.9 TOCHU CORPORATION
6.4.10 Toyoura Keiseki Kogyo Co., Ltd
6.4.11 VRX Silica Ltd
- *List Not Exhaustive
7. MARKET OPPORTUNITIES AND FUTURE TRENDS
7.1 Future Opportunities in the Water Treatment Industry
7.2 Development of Sand-based Treatments in Dentistry and Biotechnology
Asia-Pacific Silica Sand Industry Segmentation
Silica sand is a type of sand with high silicon dioxide (SiO2) content. It is a naturally occurring material that is found in many parts of the world. Silica sand is used in a variety of applications, including glassmaking, foundries, and fracking, among others.
The Asia-Pacific is segmented by end-user industry and geography. The end-user industry segment includes glass manufacturing, foundry, chemical production, construction, paints and coatings, ceramics and refractories, filtration, oil and gas, and other end-user industries like food processing, industrial abrasives, and sports fields. These segments highlight the varied applications of silica sand across sectors, enabling tailored product and service offerings. These industry segments help delineate the diverse applications of silica sand across various sectors, aiding in customized product and service offerings.
Geographically, the market spans different regions, each with its distinct demand, supply, and market dynamics. This geographical segmentation allows businesses to adapt their strategies to specific regional conditions, thus enhancing their market presence and competitive advantage.
For each segment, the market sizing and forecasts are provided on the basis of volume (tons).
| End-User Industry | |
| Glass Manufacturing | |
| Foundry | |
| Chemical Production | |
| Construction | |
| Paints and Coatings | |
| Ceramics and Refractories | |
| Filtration | |
| Oil and Gas Recovery | |
| Other End User Industries (Food Processing, Industrial Abrasives and Sports Fields) |
| Geography | |
| China | |
| India | |
| Japan | |
| South Korea | |
| ASEAN Countries | |
| Rest of Asia-Pacific |
Frequently Asked Questions
What is the current Asia-Pacific Silica Sand Market size?
The Asia-Pacific Silica Sand Market is projected to register a CAGR of 6.39% during the forecast period (2024-2029)
Who are the key players in Asia-Pacific Silica Sand Market?
Sibelco, Chongqing Changjiang River Moulding Material Group Co. Ltd (CCRMM) , JFE Mineral & Alloy Company Ltd, PUM Group and Mitsubishi Corporation are the major companies operating in the Asia-Pacific Silica Sand Market.
What years does this Asia-Pacific Silica Sand Market cover?
The report covers the Asia-Pacific Silica Sand Market historical market size for years: 2019, 2020, 2021, 2022 and 2023. The report also forecasts the Asia-Pacific Silica Sand Market size for years: 2024, 2025, 2026, 2027, 2028 and 2029.
Asia-Pacific Silica Sand Industry Report
Statistics for the 2024 Asia-Pacific Silica Sand market share, size and revenue growth rate, created by Mordor Intelligence™ Industry Reports. Asia-Pacific Silica Sand analysis includes a market forecast outlook to for 2024 to 2029 and historical overview. Get a sample of this industry analysis as a free report PDF download.
