
| Study Period | 2017 - 2030 |
| Base Year For Estimation | 2024 |
| Forecast Data Period | 2025 - 2030 |
| Market Size (2025) | USD 8.94 Billion |
| Market Size (2030) | USD 11.75 Billion |
| CAGR (2025 - 2030) | 5.63 % |
| Market Concentration | Medium |
Major Players*Disclaimer: Major Players sorted in no particular order |


Vegetable Seed Market Analysis
The Vegetable Seed Market size is estimated at 8.94 billion USD in 2025, and is expected to reach 11.75 billion USD by 2030, growing at a CAGR of 5.63% during the forecast period (2025-2030).
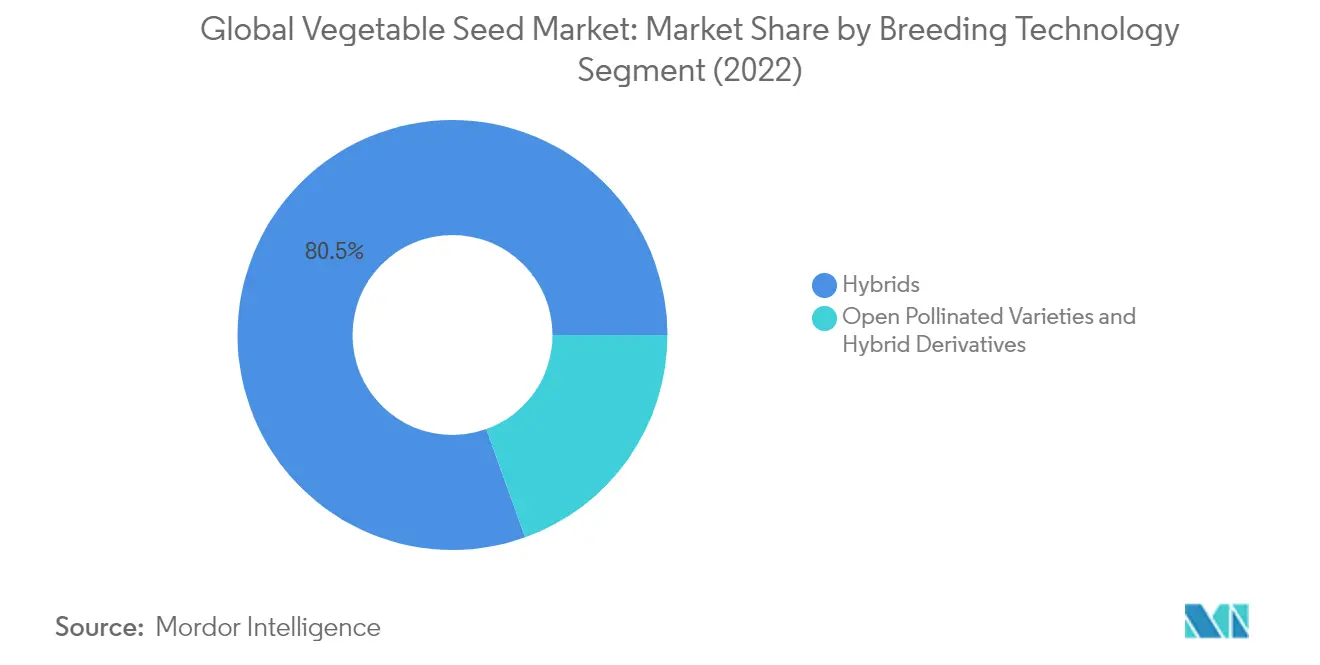
The vegetable seed industry is experiencing a significant transformation driven by technological advancements in breeding techniques and growing demand for high-quality produce. Hybrid varieties have emerged as the dominant force in the vegetable seeds market, accounting for 80.6% of the global vegetable seed market in 2022, while open-pollinated varieties held the remaining 19.4%. This shift reflects the industry's focus on developing seeds with enhanced traits such as disease resistance, improved yield potential, and better adaptability to various growing conditions. The adoption of hybrid seeds has been particularly strong in certain crop categories, with cucurbits and unclassified vegetables leading the way at 25.8% and 22.9% market share respectively in 2022.
Protected cultivation practices are gaining significant traction across the vegetable seed market, with countries increasingly investing in greenhouse and controlled environment agriculture. This trend is particularly evident in regions with challenging climatic conditions or limited arable land. For instance, in Japan, approximately 74% of tomatoes and 61% of cucumbers and gherkins were cultivated under protected conditions in 2022, demonstrating the growing importance of controlled environment agriculture in modern vegetable production.
The industry is witnessing a notable shift towards sustainable and organic farming practices, driven by increasing consumer awareness about food safety and environmental concerns. Major seed companies are responding to this trend by developing specialized seed varieties suited for organic cultivation. The rising demand for organic produce is reflected in the significant market growth, with United States organic sales reaching USD 62 billion in 2021, indicating a strong consumer preference for organically grown vegetables.
Seed companies are increasingly focusing on developing varieties with enhanced traits to address evolving agricultural challenges. The emphasis is particularly strong on developing seeds with resistance to emerging pests and diseases, improved nutritional content, and better shelf life. This trend is evident in the market share distribution of major vegetable crops, where tomatoes, cucumbers & gherkins, and pumpkin & squash collectively represent significant portions of the hybrid seeds market, at 13.0%, 12.2%, and 9.7% respectively in 2022. These percentages reflect the success of breeding programs in developing improved varieties that meet both grower and consumer demands.
Global Vegetable Seed Market Trends
Asia-Pacific and Africa held the most significant areas under vegetable cultivation due to the favorable agroclimatic conditions
- The vegetable cultivation area accounted for about 7.9% of the total global cultivation area in 2022. There is an increasing demand for vegetables across regions, which is the major factor driving vegetable cultivation worldwide. Asia-Pacific held the largest acreage under vegetable cultivation, which accounted for about 45.4% of the global vegetable acreage in 2022. India and China are the leading producers not only in Asia-Pacific but also in the world. The high export potential of vegetables drives their cultivation area in the region.
- Africa held the second-largest area under vegetable cultivation, with about 51.3 million hectares in 2022. Roots and bulbs are major vegetable crops growing in the region, and they accounted for the major share of 84.9% of the African vegetable acreage in 2022. This is because the region's diverse agro-climatic zones provide favorable conditions for root & bulb cultivation.
- In 2022, vegetables were grown on almost 11.4 million ha in Europe. Russia, Ukraine, Turkey, France, Spain, and Germany cover the major area under vegetables in Europe, covering around 69.6% of the region's vegetable acreage in 2022. The growing consumption and demand from the processing industry are anticipated to drive the acreage during the forecast period.
- In 2022, vegetables were grown on almost 5.3 million ha in South America. Brazil is the major vegetable producer. It accounted for 27.8% of the South American vegetable cultivated area, with 2.4 million hectares in 2022. The growing demand for vegetables is projected to drive the acreage. The growing demand for vegetables across various industries and consumers is anticipated to drive the acreage during the forecast period.

Understand The Key Trends Shaping This Market
Download PDF
High demand for cabbage seeds with black rot resistance and good quality traits for pumpkin are boosting the seed market
- Cabbage is one of the most widely cultivated vegetables. Its varieties, with characteristics such as uniformity in head size, foliage color, adaptability to various conditions, early maturity, and disease tolerance, are mainly preferred by growers. In cabbage, black rot is the major disease caused by the Xanthomonas campestris pv. campestris (XCC), and it affects crop yield by about 50%. There is a high demand for varieties that can resist black rot. Therefore, most companies focus on developing block rot-resistant varieties of cabbages with higher yield potential. For instance, major players such as Bayer AG, BASF SE, Sakata Seeds Corporation, and Syngenta Group are providing seeds with traits that are resistant to diseases, such as black rot, powdery mildew, downy mildew, and other leaf diseases, along with higher productivity. These seed varieties are witnessing high demand as they can prevent crop losses.
- Globally, pumpkin and squash are the major cucurbits widely grown. The popular traits of pumpkin and squash are quality attributes such as good shape, size, and color, longer storage life, disease resistance, especially against the geminin virus, and wider adaptability to different climatic and soil types. It is expected that in the future, the diseases resistant and quality attribute traits will be more widely available as companies are developing new varieties with mildew tolerance and virus resistance, as well as uniformity, color, and flavor. For instance, in 2021, Enza Zaden launched new pumpkin seed varieties such as Orange Summer and Butternut.
- The prevalence of different diseases, changes in weather conditions, and high-quality attributes such as size and color are increasing the demand for new seed varieties during the forecast period.

OTHER KEY INDUSTRY TRENDS COVERED IN THE REPORT
- The increasing demand for fungal and viral disease-resistant, high-yield potential tomato, and cucumber seeds is driving the vegetable seed market
- Hybrid breeding technique dominated the market as these seeds increase the yield and reduce the losses
Segment Analysis: Breeding Technology
Hybrids Segment in Global Vegetable Seed Market
The hybrid vegetable seeds market dominates the global vegetable seed market, accounting for approximately 81% of the total market value in 2024. This significant market share is primarily driven by the increasing adoption of hybrid seeds due to their superior characteristics, such as higher yield potential, improved disease resistance, and better adaptability to various environmental conditions. The segment's dominance is particularly notable in major markets like North America, where hybrids account for nearly 93% of vegetable cultivation, and Asia-Pacific, where countries like China and India are rapidly increasing their hybrid seed usage. The segment's strong performance is further supported by continuous innovations in breeding technologies, leading to the development of new hybrid varieties with enhanced traits such as drought tolerance and pest resistance. Additionally, the growing demand for high-quality vegetables from processing industries and increasing awareness about the benefits of hybrid seeds among farmers have contributed to maintaining this segment's commanding position in the market.
Open Pollinated Varieties & Hybrid Derivatives Segment in Global Vegetable Seed Market
The open pollinated varieties (OPV) and hybrid derivatives segment maintains its position as an essential component of the vegetable seed market, particularly in developing regions and among small-scale farmers. This segment is characterized by its affordability and the ability of farmers to save seeds for subsequent seasons, making it an attractive option for resource-constrained agricultural communities. The segment has gained increased attention due to the rising organic farming trends and growing demand for native varieties in various regions. In Africa, OPVs are particularly popular, accounting for more than half of the seed market, as they require fewer inputs such as fertilizers and pesticides. The segment also plays a crucial role in maintaining genetic diversity and preserving traditional varieties that are well-adapted to local conditions and consumer preferences.
Segment Analysis: Cultivation Mechanism
Open Field Segment in Global Vegetable Seed Market
Open field cultivation dominates the global vegetable plant seed market, accounting for approximately 97% of the total market share in 2024. This overwhelming dominance is primarily attributed to the traditional farming methods preferred by small farmers who cultivate crops according to seasonal patterns and maintain diverse crop portfolios throughout the year. The segment's strength lies in its lower initial investment requirements compared to protected cultivation methods, making it particularly attractive for farmers in developing regions. Major crops cultivated under open field conditions include peas, which hold about 14% of the open field segment, along with various root vegetables and leafy greens. The segment's resilience is further supported by the fact that certain vegetable crops, particularly root vegetables, can only be cultivated effectively in open field conditions. Additionally, the segment benefits from extensive government support programs and subsidies across various regions, particularly in developing countries where agricultural modernization initiatives focus on improving open field farming practices.
Protected Cultivation Segment in Global Vegetable Seed Market
Protected cultivation is emerging as the fastest-growing segment in the global vegetable seed market, projected to grow at approximately 7% CAGR from 2024 to 2029. This remarkable growth is driven by increasing adoption of greenhouse technologies, particularly in regions like Asia-Pacific where China leads with about 35% of vegetables being cultivated under protected conditions. The segment's expansion is fueled by rising demand for off-season vegetables, improved crop quality, and higher yield potential. Protected cultivation has shown particular success with high-value crops like tomatoes and cucumbers, which together account for nearly 55% of protected cultivation production. The segment is witnessing significant technological advancements, including the integration of automated systems, climate control mechanisms, and precision farming techniques. Furthermore, the growing trend of urban agriculture and the need for sustainable farming practices in light of climate change challenges are accelerating the adoption of protected cultivation methods across both developed and developing markets.
Segment Analysis: Crop Family
Solanaceae Segment in Global Vegetable Seed Market
The Solanaceae segment has emerged as both the largest and fastest-growing segment in the global fruit & vegetable seeds market, commanding approximately 19% market share in 2024. This dominant position is primarily attributed to the increasing demand for Solanaceae crops in local markets and their significant export potential. The segment's growth is driven by the widespread cultivation of key crops like tomatoes, chilies, and eggplants across major agricultural regions. The adoption of advanced hybrid varieties, particularly in greenhouse cultivation, has further strengthened this segment's market position. Additionally, the rising demand from food processing industries and the increasing focus on developing disease-resistant varieties have contributed to its market leadership. The segment is projected to maintain its growth trajectory at approximately 5% CAGR from 2024-2029, supported by technological advancements in seed breeding and increasing investments in research and development for improved varieties.
Remaining Segments in Crop Family Segmentation
The vegetable seed market encompasses several other significant crop families, each playing a crucial role in the overall market dynamics. The Brassicas family, including cabbage, carrot, and cauliflower, represents a substantial portion of the market, particularly in temperate regions where these crops are staple vegetables. The Cucurbits family, comprising cucumber, pumpkin, and squash, has gained prominence due to increasing consumer preference for these vegetables in both fresh consumption and processing industries. The Roots & Bulbs segment, including garlic, onion, and potato, maintains a strong presence in the market due to their fundamental role in global cuisine and high nutritional value. The Unclassified Vegetables segment, encompassing crops like asparagus, lettuce, okra, peas, and spinach, contributes significantly to market diversity by catering to specific regional preferences and emerging food trends. Each of these segments continues to evolve with technological advancements in seed breeding and changing consumer preferences.
Vegetable Seed Market Geography Segment Analysis
Vegetable Seed Market in Africa
The African vegetable seed market demonstrates significant diversity across its key markets, including Egypt, Ethiopia, Ghana, Kenya, Nigeria, South Africa, and Tanzania. The region's agricultural landscape is characterized by varying climatic conditions and farming practices that influence vegetable cultivation patterns. Small-scale farmers dominate the agricultural sector, with increasing adoption of commercial seeds, particularly in countries with more developed agricultural infrastructure. The market is witnessing a gradual shift from traditional farming methods to modern agricultural practices, with a growing emphasis on improved seed varieties and sustainable farming techniques.
Vegetable Seed Market in Nigeria
Nigeria stands as the dominant force in Africa's vegetable seed market, benefiting from its extensive agricultural base and favorable growing conditions. The country's market position is strengthened by an approximately 60% share of the African vegetable seed market in 2024. Nigeria's vegetable cultivation spans various ecological zones, enabling diverse crop production throughout the year. The country has witnessed significant improvements in seed distribution networks and increasing adoption of improved seed varieties. Government initiatives supporting agricultural modernization and increasing private sector participation have further bolstered the market's development. The country's robust domestic demand and growing export potential continue to drive market expansion.
Vegetable Seed Market in Russia
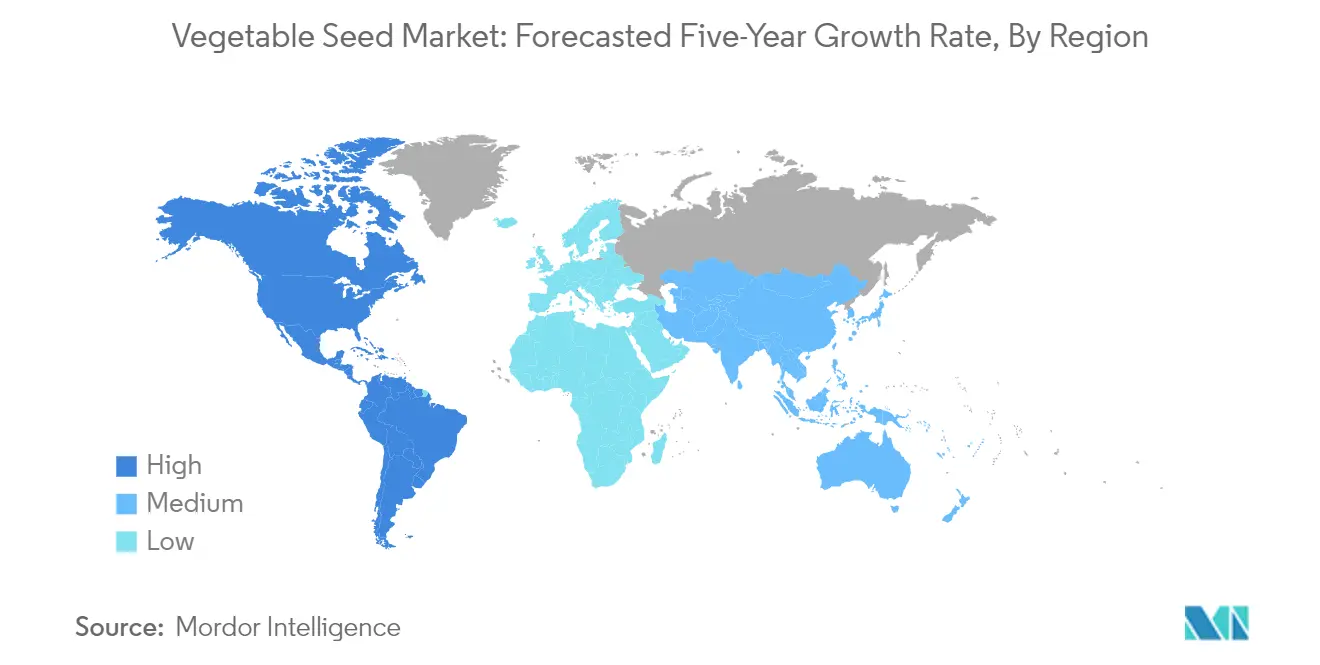
Russia emerges as the fastest-growing market in the region, with an expected growth rate of approximately 11% during 2024-2029. The country's rapid market expansion is driven by increasing investments in agricultural infrastructure and modernization of farming practices. Russian farmers are increasingly adopting improved seed varieties and modern cultivation techniques to enhance productivity. The government's focus on agricultural self-sufficiency and support for domestic seed production has created favorable conditions for market growth. The country's vast agricultural land and diverse climatic conditions provide significant potential for further market expansion.
Vegetable Seed Market in Asia-Pacific
The Asia-Pacific region represents a diverse and dynamic vegetable seed market, encompassing major agricultural economies, including China, India, Japan, Australia, Bangladesh, Indonesia, Myanmar, Pakistan, Philippines, Thailand, and Vietnam. The region's market is characterized by varying levels of agricultural development and adoption of modern farming practices across countries. Increasing population, rising food demand, and growing awareness about improved seed varieties drive market growth. The region has witnessed significant investments in research and development, leading to the introduction of new seed varieties adapted to local conditions.
Vegetable Seed Market in China
China dominates the Asia-Pacific vegetable seed market, commanding approximately a 32% share in 2024. The country's leadership position is supported by its vast agricultural land, diverse climatic conditions, and strong research and development capabilities. China has developed a robust seed production and distribution infrastructure, with an increasing focus on developing improved varieties suited to local conditions. The country's vegetable seed industry benefits from strong government support and increasing private sector participation. Rising domestic demand for quality vegetables and growing export opportunities continue to drive market growth.
Vegetable Seed Market in Vietnam
Vietnam demonstrates remarkable growth potential in the Asia-Pacific region, with an anticipated growth rate of around 7% during 2024-2029. The country's vegetable seed market is experiencing rapid transformation driven by the modernization of farming practices and increasing adoption of hybrid seeds. Vietnam's favorable climate conditions and growing season advantages support year-round vegetable production. The country has witnessed significant improvements in seed distribution networks and increasing awareness about improved varieties among farmers. Government support for agricultural modernization and growing export opportunities further strengthen market growth prospects.
Vegetable Seed Market in Europe
The European vegetable seed market encompasses a mature and technologically advanced agricultural sector across countries, including France, Germany, Italy, Netherlands, Poland, Romania, Russia, Spain, Turkey, Ukraine, and the United Kingdom. The region's market is characterized by high adoption rates of improved seed varieties and modern farming practices. Strong research and development capabilities, coupled with stringent quality standards, define the European seed industry. The market benefits from well-established infrastructure and efficient distribution networks.
Vegetable Seed Market in Russia
Russia emerges as the largest vegetable seed market in Europe, supported by its extensive agricultural land and diverse growing conditions. The country's market leadership is driven by increasing investments in agricultural modernization and growing adoption of improved seed varieties. Russian farmers are increasingly embracing modern farming techniques and high-quality seeds to enhance productivity. Government support for agricultural self-sufficiency and domestic seed production strengthens market growth.
Vegetable Seed Market in Poland
Poland demonstrates the highest growth potential in the European vegetable seed market. The country's rapid market expansion is supported by increasing adoption of modern farming practices and improved seed varieties. Poland's vegetable seed industry benefits from growing investments in agricultural infrastructure and rising export opportunities. The country's favorable climate conditions and strong agricultural tradition provide a solid foundation for market growth. Government support and increasing private sector participation further boost market development.
Vegetable Seed Market in Middle East
The Middle Eastern vegetable seed market, primarily represented by Iran and Saudi Arabia, demonstrates unique characteristics shaped by challenging climatic conditions and increasing adoption of protected cultivation methods. Iran emerges as the largest market in the region, while Saudi Arabia shows the fastest growth potential. The region's market is characterized by increasing investments in agricultural technology and growing emphasis on food security. Protected cultivation and modern farming techniques are gaining prominence to overcome environmental challenges and enhance productivity.
Vegetable Seed Market in North America
The North American vegetable seed market, comprising the United States, Canada, and Mexico, represents a highly developed and technologically advanced agricultural sector. The United States maintains its position as the largest market in the region, while Mexico demonstrates the fastest growth potential. The region's market is characterized by high adoption rates of hybrid seeds, advanced farming practices, and strong research and development capabilities. Increasing demand for organic produce and sustainable farming practices shapes market development across these countries.
Vegetable Seed Market in South America
The South American vegetable seed market, primarily represented by Brazil's vegetable seed market and Argentina, shows significant growth potential driven by expanding agricultural activities and increasing adoption of improved seed varieties. Brazil maintains its position as the largest market in the region, while Argentina shows the fastest growth potential. The region's market benefits from favorable climate conditions, vast agricultural land, and increasing investments in modern farming practices. Growing export opportunities and rising domestic demand for quality vegetables drive market development across these countries.
Get Analysis on Important Geographic Markets
Download PDF
Vegetable Seed Industry Overview
Top Companies in Vegetable Seed Market
The vegetable seed market features several prominent global players, including Groupe Limagrain, Bayer AG, Rijk Zwaan, BASF SE, and Sakata Seeds Corporation, leading the industry through continuous innovation and strategic initiatives. Companies are heavily focused on developing disease-resistant varieties, particularly addressing challenges like Tomato Brown Rugose Virus, Bemisia races, and Yellow Leaf Curl Diseases, while also improving traits such as cold resistance and nutrient content. Strategic partnerships have become increasingly common, with companies engaging in cross-licensing agreements, distribution network expansion, and collaborative breeding programs to enhance their market presence. Operational expansion has been primarily directed towards establishing new research and development facilities, breeding stations, and innovation centers across different geographical regions. The industry has also witnessed significant merger and acquisition activities, with companies acquiring specialized seed businesses to strengthen their product portfolios and expand their geographical footprint. Notably, BASF's vegetable seeds division has been at the forefront of these innovations.
Consolidated Market Led By Global Players
The vegetable seed market demonstrates a highly consolidated structure, with the top players accounting for a significant market share through their extensive research capabilities and global distribution networks. These major players are primarily large agricultural conglomerates with diverse product portfolios spanning multiple crop categories, though there are also successful specialized seed companies focusing exclusively on vegetable varieties. The market's consolidation is particularly evident in developed regions where companies have established strong research and development infrastructure.
The industry landscape is characterized by a mix of multinational corporations and regional specialists, with the former dominating through their superior technological capabilities and extensive distribution networks. Market entry barriers are substantial due to the high investments required in research and development, particularly for developing hybrid varieties. The sector has witnessed strategic consolidation through mergers and acquisitions, with larger companies acquiring smaller, specialized seed producers to gain access to specific germplasm, regional markets, or technological capabilities. Among these, the leading vegetable seed companies continue to shape the market dynamics.
Innovation and Adaptation Drive Future Success
Success in the vegetable seed market increasingly depends on companies' ability to develop innovative varieties that address evolving challenges while meeting specific regional requirements. Market leaders are strengthening their positions through continuous investment in research and development, focusing on developing varieties with improved disease resistance, climate resilience, and enhanced nutritional profiles. Companies are also expanding their presence in emerging markets through strategic partnerships with local players and establishing regional breeding programs to develop varieties suited to local conditions.
For emerging players and contenders, success lies in identifying and focusing on specific market niches or regional opportunities where they can build competitive advantages. This includes developing specialized varieties for protected cultivation, organic farming, or specific regional preferences. The increasing emphasis on sustainable agriculture and changing consumer preferences for organic produce presents opportunities for companies to differentiate their offerings. Regulatory compliance, particularly regarding seed quality standards and genetic modification guidelines, remains a critical factor for all market participants, while building strong relationships with farmers and distributors is essential for maintaining market share. In India, the leading vegetable seed company is making strides in these areas.
Vegetable Seed Market Leaders
-
BASF SE
-
Bayer AG
-
Groupe Limagrain
-
Rijk Zwaan Zaadteelt en Zaadhandel BV
-
Sakata Seeds Corporation
- *Disclaimer: Major Players sorted in no particular order

Need More Details on Market Players and Competiters?
Download PDF
Vegetable Seed Market News
- July 2023: Takii Seeds introduced a new variety of winter carrots called Fuyu Chiaki. These carrots are well-adapted to winter conditions and exhibit good cold resistance. Additionally, they can thrive in a wide range of soils, making them a versatile choice for farmers.
- July 2023: Enza Zaden acquired the carrot breeding program from the German company Carosem. This strategic acquisition aims to expand Enza Zaden's product portfolio by incorporating carrot seeds with several commercial varieties and inventories.
- July 2023: Enza Zaden introduced new lettuce varieties that exhibit high resistance to three new Bermian races, namely, Bl: 38EU, Bl: 39EU, and Bl: 40EU. The new lettuce varieties not only offer high resistance to these races but also have the capability to grow in various soil types while still achieving high yields.
Free With This Report
We provide a complimentary and exhaustive set of data points on regional and country-level metrics that present the fundamental structure of the industry. Presented in the form of 90+ free charts, the section covers difficult-to-find data from various regions regarding the area under cultivation for different crops within the scope


Vegetable Seed Market Report - Table of Contents
1. EXECUTIVE SUMMARY & KEY FINDINGS
2. REPORT OFFERS
3. INTRODUCTION
- 3.1 Study Assumptions & Market Definition
- 3.2 Scope of the Study
- 3.3 Research Methodology
4. KEY INDUSTRY TRENDS
-
4.1 Area Under Cultivation
- 4.1.1 Vegetables
-
4.2 Most Popular Traits
- 4.2.1 Cabbage, Pumpkin & Squash
- 4.2.2 Tomato & Cucumber
-
4.3 Breeding Techniques
- 4.3.1 Vegetables
- 4.4 Regulatory Framework
- 4.5 Value Chain & Distribution Channel Analysis
5. MARKET SEGMENTATION (includes market size in Value in USD, Forecasts up to 2030 and analysis of growth prospects)
-
5.1 Breeding Technology
- 5.1.1 Hybrids
- 5.1.2 Open Pollinated Varieties & Hybrid Derivatives
-
5.2 Cultivation Mechanism
- 5.2.1 Open Field
- 5.2.2 Protected Cultivation
-
5.3 Crop Family
- 5.3.1 Brassicas
- 5.3.1.1 Cabbage
- 5.3.1.2 Carrot
- 5.3.1.3 Cauliflower & Broccoli
- 5.3.1.4 Other Brassicas
- 5.3.2 Cucurbits
- 5.3.2.1 Cucumber & Gherkin
- 5.3.2.2 Pumpkin & Squash
- 5.3.2.3 Other Cucurbits
- 5.3.3 Roots & Bulbs
- 5.3.3.1 Garlic
- 5.3.3.2 Onion
- 5.3.3.3 Potato
- 5.3.3.4 Other Roots & Bulbs
- 5.3.4 Solanaceae
- 5.3.4.1 Chilli
- 5.3.4.2 Eggplant
- 5.3.4.3 Tomato
- 5.3.4.4 Other Solanaceae
- 5.3.5 Unclassified Vegetables
- 5.3.5.1 Asparagus
- 5.3.5.2 Lettuce
- 5.3.5.3 Okra
- 5.3.5.4 Peas
- 5.3.5.5 Spinach
- 5.3.5.6 Other Unclassified Vegetables
-
5.4 Region
- 5.4.1 Africa
- 5.4.1.1 By Breeding Technology
- 5.4.1.2 By Cultivation Mechanism
- 5.4.1.3 By Crop
- 5.4.1.4 By Country
- 5.4.1.4.1 Egypt
- 5.4.1.4.2 Ethiopia
- 5.4.1.4.3 Ghana
- 5.4.1.4.4 Kenya
- 5.4.1.4.5 Nigeria
- 5.4.1.4.6 South Africa
- 5.4.1.4.7 Tanzania
- 5.4.1.4.8 Rest of Africa
- 5.4.2 Asia-Pacific
- 5.4.2.1 By Breeding Technology
- 5.4.2.2 By Cultivation Mechanism
- 5.4.2.3 By Crop
- 5.4.2.4 By Country
- 5.4.2.4.1 Australia
- 5.4.2.4.2 Bangladesh
- 5.4.2.4.3 China
- 5.4.2.4.4 India
- 5.4.2.4.5 Indonesia
- 5.4.2.4.6 Japan
- 5.4.2.4.7 Myanmar
- 5.4.2.4.8 Pakistan
- 5.4.2.4.9 Philippines
- 5.4.2.4.10 Thailand
- 5.4.2.4.11 Vietnam
- 5.4.2.4.12 Rest of Asia-Pacific
- 5.4.3 Europe
- 5.4.3.1 By Breeding Technology
- 5.4.3.2 By Cultivation Mechanism
- 5.4.3.3 By Crop
- 5.4.3.4 By Country
- 5.4.3.4.1 France
- 5.4.3.4.2 Germany
- 5.4.3.4.3 Italy
- 5.4.3.4.4 Netherlands
- 5.4.3.4.5 Poland
- 5.4.3.4.6 Romania
- 5.4.3.4.7 Russia
- 5.4.3.4.8 Spain
- 5.4.3.4.9 Turkey
- 5.4.3.4.10 Ukraine
- 5.4.3.4.11 United Kingdom
- 5.4.3.4.12 Rest of Europe
- 5.4.4 Middle East
- 5.4.4.1 By Breeding Technology
- 5.4.4.2 By Cultivation Mechanism
- 5.4.4.3 By Crop
- 5.4.4.4 By Country
- 5.4.4.4.1 Iran
- 5.4.4.4.2 Saudi Arabia
- 5.4.4.4.3 Rest of Middle East
- 5.4.5 North America
- 5.4.5.1 By Breeding Technology
- 5.4.5.2 By Cultivation Mechanism
- 5.4.5.3 By Crop
- 5.4.5.4 By Country
- 5.4.5.4.1 Canada
- 5.4.5.4.2 Mexico
- 5.4.5.4.3 United States
- 5.4.5.4.4 Rest of North America
- 5.4.6 South America
- 5.4.6.1 By Breeding Technology
- 5.4.6.2 By Cultivation Mechanism
- 5.4.6.3 By Crop
- 5.4.6.4 By Country
- 5.4.6.4.1 Argentina
- 5.4.6.4.2 Brazil
- 5.4.6.4.3 Rest of South America
6. COMPETITIVE LANDSCAPE
- 6.1 Key Strategic Moves
- 6.2 Market Share Analysis
- 6.3 Company Landscape
-
6.4 Company Profiles
- 6.4.1 Advanta Seeds - UPL
- 6.4.2 BASF SE
- 6.4.3 Bayer AG
- 6.4.4 Bejo Zaden BV
- 6.4.5 East-West Seed
- 6.4.6 Enza Zaden
- 6.4.7 Groupe Limagrain
- 6.4.8 Rijk Zwaan Zaadteelt en Zaadhandel BV
- 6.4.9 Sakata Seeds Corporation
- 6.4.10 Takii and Co.,Ltd.
- *List Not Exhaustive
7. KEY STRATEGIC QUESTIONS FOR SEEDS CEOS
8. APPENDIX
-
8.1 Global Overview
- 8.1.1 Overview
- 8.1.2 Porter’s Five Forces Framework
- 8.1.3 Global Value Chain Analysis
- 8.1.4 Global Market Size and DROs
- 8.2 Sources & References
- 8.3 List of Tables & Figures
- 8.4 Primary Insights
- 8.5 Data Pack
- 8.6 Glossary of Terms
You Can Purchase Parts Of This Report. Check Out Prices For Specific Sections
Get Price Break-up Now
List of Tables & Figures
- Figure 1:
- AREA UNDER CULTIVATION OF VEGETABLES, HECTARE, GLOBAL, 2017-2022
- Figure 2:
- VALUE SHARE OF MAJOR CABBAGE TRAITS, %, GLOBAL, 2022
- Figure 3:
- VALUE SHARE OF MAJOR PUMPKIN & SQUASH TRAITS, %, GLOBAL, 2022
- Figure 4:
- VALUE SHARE OF MAJOR TOMATO TRAITS, %, GLOBAL, 2022
- Figure 5:
- VALUE SHARE OF MAJOR CUCUMBER TRAITS, %, GLOBAL, 2022
- Figure 6:
- VALUE SHARE OF VEGETABLES BREEDING TECHNIQUES, %, GLOBAL, 2022
- Figure 7:
- VOLUME OF VEGETABLES SEED, METRIC TON, GLOBAL, 2017 - 2030
- Figure 8:
- VALUE OF VEGETABLES SEED, USD, GLOBAL, 2017 - 2030
- Figure 9:
- VOLUME OF VEGETABLES SEED BY BREEDING TECHNOLOGY CATEGORIES, METRIC TON, GLOBAL, 2017 - 2030
- Figure 10:
- VALUE OF VEGETABLES SEED BY BREEDING TECHNOLOGY CATEGORIES, USD, GLOBAL, 2017 - 2030
- Figure 11:
- VOLUME SHARE OF VEGETABLES SEED BY BREEDING TECHNOLOGY CATEGORIES, %, GLOBAL, 2017 VS 2023 VS 2030
- Figure 12:
- VALUE SHARE OF VEGETABLES SEED BY BREEDING TECHNOLOGY CATEGORIES, %, GLOBAL, 2017 VS 2023 VS 2030
- Figure 13:
- VOLUME OF HYBRIDS VEGETABLES SEED, METRIC TON, GLOBAL, 2017 - 2030
- Figure 14:
- VALUE OF HYBRIDS VEGETABLES SEED, USD, GLOBAL, 2017 - 2030
- Figure 15:
- VALUE SHARE OF HYBRIDS VEGETABLES SEED BY CROP, %, GLOBAL, 2023 AND 2030
- Figure 16:
- VOLUME OF OPEN POLLINATED VARIETIES & HYBRID DERIVATIVES VEGETABLES SEED, METRIC TON, GLOBAL, 2017 - 2030
- Figure 17:
- VALUE OF OPEN POLLINATED VARIETIES & HYBRID DERIVATIVES VEGETABLES SEED, USD, GLOBAL, 2017 - 2030
- Figure 18:
- VALUE SHARE OF OPEN POLLINATED VARIETIES & HYBRID DERIVATIVES VEGETABLES SEED BY CROP, %, GLOBAL, 2023 AND 2030
- Figure 19:
- VOLUME OF VEGETABLES SEED BY CULTIVATION MECHANISM CATEGORIES, METRIC TON, GLOBAL, 2017 - 2030
- Figure 20:
- VALUE OF VEGETABLES SEED BY CULTIVATION MECHANISM CATEGORIES, USD, GLOBAL, 2017 - 2030
- Figure 21:
- VOLUME SHARE OF VEGETABLES SEED BY CULTIVATION MECHANISM CATEGORIES, %, GLOBAL, 2017 VS 2023 VS 2030
- Figure 22:
- VALUE SHARE OF VEGETABLES SEED BY CULTIVATION MECHANISM CATEGORIES, %, GLOBAL, 2017 VS 2023 VS 2030
- Figure 23:
- VOLUME OF VEGETABLES SEED SOWN IN OPEN FIELD, METRIC TON, GLOBAL, 2017 - 2030
- Figure 24:
- VALUE OF VEGETABLES SEED SOWN IN OPEN FIELD, USD, GLOBAL, 2017 - 2030
- Figure 25:
- VALUE SHARE OF SEEDS SOWN IN OPEN FIELD BY CROP, %, GLOBAL, 2023 AND 2030
- Figure 26:
- VOLUME OF VEGETABLES SEED SOWN IN PROTECTED CULTIVATION, METRIC TON, GLOBAL, 2017 - 2030
- Figure 27:
- VALUE OF VEGETABLES SEED SOWN IN PROTECTED CULTIVATION, USD, GLOBAL, 2017 - 2030
- Figure 28:
- VALUE SHARE OF SEEDS SOWN IN PROTECTED CULTIVATION BY CROP, %, GLOBAL, 2023 AND 2030
- Figure 29:
- VOLUME OF VEGETABLES SEED BY CROP FAMILY CATEGORIES, METRIC TON, GLOBAL, 2017 - 2030
- Figure 30:
- VALUE OF VEGETABLES SEED BY CROP FAMILY CATEGORIES, USD, GLOBAL, 2017 - 2030
- Figure 31:
- VOLUME SHARE OF VEGETABLES SEED BY CROP FAMILY CATEGORIES, %, GLOBAL, 2017 VS 2023 VS 2030
- Figure 32:
- VALUE SHARE OF VEGETABLES SEED BY CROP FAMILY CATEGORIES, %, GLOBAL, 2017 VS 2023 VS 2030
- Figure 33:
- VOLUME OF VEGETABLES SEED BY CROP CATEGORIES, METRIC TON, GLOBAL, 2017 - 2030
- Figure 34:
- VALUE OF VEGETABLES SEED BY CROP CATEGORIES, USD, GLOBAL, 2017 - 2030
- Figure 35:
- VOLUME SHARE OF VEGETABLES SEED BY CROP CATEGORIES, %, GLOBAL, 2017 VS 2023 VS 2030
- Figure 36:
- VALUE SHARE OF VEGETABLES SEED BY CROP CATEGORIES, %, GLOBAL, 2017 VS 2023 VS 2030
- Figure 37:
- VOLUME OF CABBAGE SEED, METRIC TON, GLOBAL, 2017 - 2030
- Figure 38:
- VALUE OF CABBAGE SEED, USD, GLOBAL, 2017 - 2030
- Figure 39:
- VALUE SHARE OF CABBAGE SEED BY BREEDING TECHNOLOGY, %, GLOBAL, 2023 AND 2030
- Figure 40:
- VOLUME OF CARROT SEED, METRIC TON, GLOBAL, 2017 - 2030
- Figure 41:
- VALUE OF CARROT SEED, USD, GLOBAL, 2017 - 2030
- Figure 42:
- VALUE SHARE OF CARROT SEED BY BREEDING TECHNOLOGY, %, GLOBAL, 2023 AND 2030
- Figure 43:
- VOLUME OF CAULIFLOWER & BROCCOLI SEED, METRIC TON, GLOBAL, 2017 - 2030
- Figure 44:
- VALUE OF CAULIFLOWER & BROCCOLI SEED, USD, GLOBAL, 2017 - 2030
- Figure 45:
- VALUE SHARE OF CAULIFLOWER & BROCCOLI SEED BY BREEDING TECHNOLOGY, %, GLOBAL, 2023 AND 2030
- Figure 46:
- VOLUME OF OTHER BRASSICAS SEED, METRIC TON, GLOBAL, 2017 - 2030
- Figure 47:
- VALUE OF OTHER BRASSICAS SEED, USD, GLOBAL, 2017 - 2030
- Figure 48:
- VALUE SHARE OF OTHER BRASSICAS SEED BY BREEDING TECHNOLOGY, %, GLOBAL, 2023 AND 2030
- Figure 49:
- VOLUME OF VEGETABLES SEED BY CROP CATEGORIES, METRIC TON, GLOBAL, 2017 - 2030
- Figure 50:
- VALUE OF VEGETABLES SEED BY CROP CATEGORIES, USD, GLOBAL, 2017 - 2030
- Figure 51:
- VOLUME SHARE OF VEGETABLES SEED BY CROP CATEGORIES, %, GLOBAL, 2017 VS 2023 VS 2030
- Figure 52:
- VALUE SHARE OF VEGETABLES SEED BY CROP CATEGORIES, %, GLOBAL, 2017 VS 2023 VS 2030
- Figure 53:
- VOLUME OF CUCUMBER & GHERKIN SEED, METRIC TON, GLOBAL, 2017 - 2030
- Figure 54:
- VALUE OF CUCUMBER & GHERKIN SEED, USD, GLOBAL, 2017 - 2030
- Figure 55:
- VALUE SHARE OF CUCUMBER & GHERKIN SEED BY BREEDING TECHNOLOGY, %, GLOBAL, 2023 AND 2030
- Figure 56:
- VOLUME OF PUMPKIN & SQUASH SEED, METRIC TON, GLOBAL, 2017 - 2030
- Figure 57:
- VALUE OF PUMPKIN & SQUASH SEED, USD, GLOBAL, 2017 - 2030
- Figure 58:
- VALUE SHARE OF PUMPKIN & SQUASH SEED BY BREEDING TECHNOLOGY, %, GLOBAL, 2023 AND 2030
- Figure 59:
- VOLUME OF OTHER CUCURBITS SEED, METRIC TON, GLOBAL, 2017 - 2030
- Figure 60:
- VALUE OF OTHER CUCURBITS SEED, USD, GLOBAL, 2017 - 2030
- Figure 61:
- VALUE SHARE OF OTHER CUCURBITS SEED BY BREEDING TECHNOLOGY, %, GLOBAL, 2023 AND 2030
- Figure 62:
- VOLUME OF VEGETABLES SEED BY CROP CATEGORIES, METRIC TON, GLOBAL, 2017 - 2030
- Figure 63:
- VALUE OF VEGETABLES SEED BY CROP CATEGORIES, USD, GLOBAL, 2017 - 2030
- Figure 64:
- VOLUME SHARE OF VEGETABLES SEED BY CROP CATEGORIES, %, GLOBAL, 2017 VS 2023 VS 2030
- Figure 65:
- VALUE SHARE OF VEGETABLES SEED BY CROP CATEGORIES, %, GLOBAL, 2017 VS 2023 VS 2030
- Figure 66:
- VOLUME OF GARLIC SEED, METRIC TON, GLOBAL, 2017 - 2030
- Figure 67:
- VALUE OF GARLIC SEED, USD, GLOBAL, 2017 - 2030
- Figure 68:
- VALUE SHARE OF GARLIC SEED BY BREEDING TECHNOLOGY, %, GLOBAL, 2023 AND 2030
- Figure 69:
- VOLUME OF ONION SEED, METRIC TON, GLOBAL, 2017 - 2030
- Figure 70:
- VALUE OF ONION SEED, USD, GLOBAL, 2017 - 2030
- Figure 71:
- VALUE SHARE OF ONION SEED BY BREEDING TECHNOLOGY, %, GLOBAL, 2023 AND 2030
- Figure 72:
- VOLUME OF POTATO SEED, METRIC TON, GLOBAL, 2017 - 2030
- Figure 73:
- VALUE OF POTATO SEED, USD, GLOBAL, 2017 - 2030
- Figure 74:
- VALUE SHARE OF POTATO SEED BY BREEDING TECHNOLOGY, %, GLOBAL, 2023 AND 2030
- Figure 75:
- VOLUME OF OTHER ROOTS & BULBS SEED, METRIC TON, GLOBAL, 2017 - 2030
- Figure 76:
- VALUE OF OTHER ROOTS & BULBS SEED, USD, GLOBAL, 2017 - 2030
- Figure 77:
- VALUE SHARE OF OTHER ROOTS & BULBS SEED BY BREEDING TECHNOLOGY, %, GLOBAL, 2023 AND 2030
- Figure 78:
- VOLUME OF VEGETABLES SEED BY CROP CATEGORIES, METRIC TON, GLOBAL, 2017 - 2030
- Figure 79:
- VALUE OF VEGETABLES SEED BY CROP CATEGORIES, USD, GLOBAL, 2017 - 2030
- Figure 80:
- VOLUME SHARE OF VEGETABLES SEED BY CROP CATEGORIES, %, GLOBAL, 2017 VS 2023 VS 2030
- Figure 81:
- VALUE SHARE OF VEGETABLES SEED BY CROP CATEGORIES, %, GLOBAL, 2017 VS 2023 VS 2030
- Figure 82:
- VOLUME OF CHILLI SEED, METRIC TON, GLOBAL, 2017 - 2030
- Figure 83:
- VALUE OF CHILLI SEED, USD, GLOBAL, 2017 - 2030
- Figure 84:
- VALUE SHARE OF CHILLI SEED BY BREEDING TECHNOLOGY, %, GLOBAL, 2023 AND 2030
- Figure 85:
- VOLUME OF EGGPLANT SEED, METRIC TON, GLOBAL, 2017 - 2030
- Figure 86:
- VALUE OF EGGPLANT SEED, USD, GLOBAL, 2017 - 2030
- Figure 87:
- VALUE SHARE OF EGGPLANT SEED BY BREEDING TECHNOLOGY, %, GLOBAL, 2023 AND 2030
- Figure 88:
- VOLUME OF TOMATO SEED, METRIC TON, GLOBAL, 2017 - 2030
- Figure 89:
- VALUE OF TOMATO SEED, USD, GLOBAL, 2017 - 2030
- Figure 90:
- VALUE SHARE OF TOMATO SEED BY BREEDING TECHNOLOGY, %, GLOBAL, 2023 AND 2030
- Figure 91:
- VOLUME OF OTHER SOLANACEAE SEED, METRIC TON, GLOBAL, 2017 - 2030
- Figure 92:
- VALUE OF OTHER SOLANACEAE SEED, USD, GLOBAL, 2017 - 2030
- Figure 93:
- VALUE SHARE OF OTHER SOLANACEAE SEED BY BREEDING TECHNOLOGY, %, GLOBAL, 2023 AND 2030
- Figure 94:
- VOLUME OF VEGETABLES SEED BY CROP CATEGORIES, METRIC TON, GLOBAL, 2017 - 2030
- Figure 95:
- VALUE OF VEGETABLES SEED BY CROP CATEGORIES, USD, GLOBAL, 2017 - 2030
- Figure 96:
- VOLUME SHARE OF VEGETABLES SEED BY CROP CATEGORIES, %, GLOBAL, 2017 VS 2023 VS 2030
- Figure 97:
- VALUE SHARE OF VEGETABLES SEED BY CROP CATEGORIES, %, GLOBAL, 2017 VS 2023 VS 2030
- Figure 98:
- VOLUME OF ASPARAGUS SEED, METRIC TON, GLOBAL, 2017 - 2030
- Figure 99:
- VALUE OF ASPARAGUS SEED, USD, GLOBAL, 2017 - 2030
- Figure 100:
- VALUE SHARE OF ASPARAGUS SEED BY BREEDING TECHNOLOGY, %, GLOBAL, 2023 AND 2030
- Figure 101:
- VOLUME OF LETTUCE SEED, METRIC TON, GLOBAL, 2017 - 2030
- Figure 102:
- VALUE OF LETTUCE SEED, USD, GLOBAL, 2017 - 2030
- Figure 103:
- VALUE SHARE OF LETTUCE SEED BY BREEDING TECHNOLOGY, %, GLOBAL, 2023 AND 2030
- Figure 104:
- VOLUME OF OKRA SEED, METRIC TON, GLOBAL, 2017 - 2030
- Figure 105:
- VALUE OF OKRA SEED, USD, GLOBAL, 2017 - 2030
- Figure 106:
- VALUE SHARE OF OKRA SEED BY BREEDING TECHNOLOGY, %, GLOBAL, 2023 AND 2030
- Figure 107:
- VOLUME OF PEAS SEED, METRIC TON, GLOBAL, 2017 - 2030
- Figure 108:
- VALUE OF PEAS SEED, USD, GLOBAL, 2017 - 2030
- Figure 109:
- VALUE SHARE OF PEAS SEED BY BREEDING TECHNOLOGY, %, GLOBAL, 2023 AND 2030
- Figure 110:
- VOLUME OF SPINACH SEED, METRIC TON, GLOBAL, 2017 - 2030
- Figure 111:
- VALUE OF SPINACH SEED, USD, GLOBAL, 2017 - 2030
- Figure 112:
- VALUE SHARE OF SPINACH SEED BY BREEDING TECHNOLOGY, %, GLOBAL, 2023 AND 2030
- Figure 113:
- VOLUME OF OTHER UNCLASSIFIED VEGETABLES SEED, METRIC TON, GLOBAL, 2017 - 2030
- Figure 114:
- VALUE OF OTHER UNCLASSIFIED VEGETABLES SEED, USD, GLOBAL, 2017 - 2030
- Figure 115:
- VALUE SHARE OF OTHER UNCLASSIFIED VEGETABLES SEED BY BREEDING TECHNOLOGY, %, GLOBAL, 2023 AND 2030
- Figure 116:
- VOLUME OF VEGETABLES SEED BY REGION, METRIC TON, GLOBAL, 2017 - 2030
- Figure 117:
- VALUE OF VEGETABLES SEED BY REGION, USD, GLOBAL, 2017 - 2030
- Figure 118:
- VOLUME SHARE OF VEGETABLES SEED BY REGION, %, GLOBAL, 2017 VS 2023 VS 2030
- Figure 119:
- VALUE SHARE OF VEGETABLES SEED BY REGION, %, GLOBAL, 2017 VS 2023 VS 2030
- Figure 120:
- VOLUME OF VEGETABLES SEED BY BREEDING TECHNOLOGY CATEGORIES, METRIC TON, AFRICA, 2017 - 2030
- Figure 121:
- VALUE OF VEGETABLES SEED BY BREEDING TECHNOLOGY CATEGORIES, USD, AFRICA, 2017 - 2030
- Figure 122:
- VOLUME SHARE OF VEGETABLES SEED BY BREEDING TECHNOLOGY CATEGORIES, %, AFRICA, 2017 VS 2023 VS 2030
- Figure 123:
- VALUE SHARE OF VEGETABLES SEED BY BREEDING TECHNOLOGY CATEGORIES, %, AFRICA, 2017 VS 2023 VS 2030
- Figure 124:
- VOLUME OF VEGETABLES SEED BY CULTIVATION MECHANISM CATEGORIES, METRIC TON, AFRICA, 2017 - 2030
- Figure 125:
- VALUE OF VEGETABLES SEED BY CULTIVATION MECHANISM CATEGORIES, USD, AFRICA, 2017 - 2030
- Figure 126:
- VOLUME SHARE OF VEGETABLES SEED BY CULTIVATION MECHANISM CATEGORIES, %, AFRICA, 2017 VS 2023 VS 2030
- Figure 127:
- VALUE SHARE OF VEGETABLES SEED BY CULTIVATION MECHANISM CATEGORIES, %, AFRICA, 2017 VS 2023 VS 2030
- Figure 128:
- VOLUME OF VEGETABLES SEED BY CROP CATEGORIES, METRIC TON, AFRICA, 2017 - 2030
- Figure 129:
- VALUE OF VEGETABLES SEED BY CROP CATEGORIES, USD, AFRICA, 2017 - 2030
- Figure 130:
- VOLUME SHARE OF VEGETABLES SEED BY CROP CATEGORIES, %, AFRICA, 2017 VS 2023 VS 2030
- Figure 131:
- VALUE SHARE OF VEGETABLES SEED BY CROP CATEGORIES, %, AFRICA, 2017 VS 2023 VS 2030
- Figure 132:
- VOLUME OF VEGETABLES SEED BY COUNTRY, METRIC TON, AFRICA, 2017 - 2030
- Figure 133:
- VALUE OF VEGETABLES SEED BY COUNTRY, USD, AFRICA, 2017 - 2030
- Figure 134:
- VOLUME SHARE OF VEGETABLES SEED BY COUNTRY, %, AFRICA, 2017 VS 2023 VS 2030
- Figure 135:
- VALUE SHARE OF VEGETABLES SEED BY COUNTRY, %, AFRICA, 2017 VS 2023 VS 2030
- Figure 136:
- VOLUME OF EGYPT VEGETABLES SEED, METRIC TON, AFRICA, 2017 - 2030
- Figure 137:
- VALUE OF EGYPT VEGETABLES SEED, USD, AFRICA, 2017 - 2030
- Figure 138:
- VALUE SHARE OF EGYPT VEGETABLES SEED BY CROP, %, AFRICA, 2023 AND 2030
- Figure 139:
- VOLUME OF ETHIOPIA VEGETABLES SEED, METRIC TON, AFRICA, 2017 - 2030
- Figure 140:
- VALUE OF ETHIOPIA VEGETABLES SEED, USD, AFRICA, 2017 - 2030
- Figure 141:
- VALUE SHARE OF ETHIOPIA VEGETABLES SEED BY CROP, %, AFRICA, 2023 AND 2030
- Figure 142:
- VOLUME OF GHANA VEGETABLES SEED, METRIC TON, AFRICA, 2017 - 2030
- Figure 143:
- VALUE OF GHANA VEGETABLES SEED, USD, AFRICA, 2017 - 2030
- Figure 144:
- VALUE SHARE OF GHANA VEGETABLES SEED BY CROP, %, AFRICA, 2023 AND 2030
- Figure 145:
- VOLUME OF KENYA VEGETABLES SEED, METRIC TON, AFRICA, 2017 - 2030
- Figure 146:
- VALUE OF KENYA VEGETABLES SEED, USD, AFRICA, 2017 - 2030
- Figure 147:
- VALUE SHARE OF KENYA VEGETABLES SEED BY CROP, %, AFRICA, 2023 AND 2030
- Figure 148:
- VOLUME OF NIGERIA VEGETABLES SEED, METRIC TON, AFRICA, 2017 - 2030
- Figure 149:
- VALUE OF NIGERIA VEGETABLES SEED, USD, AFRICA, 2017 - 2030
- Figure 150:
- VALUE SHARE OF NIGERIA VEGETABLES SEED BY CROP, %, AFRICA, 2023 AND 2030
- Figure 151:
- VOLUME OF SOUTH AFRICA VEGETABLES SEED, METRIC TON, AFRICA, 2017 - 2030
- Figure 152:
- VALUE OF SOUTH AFRICA VEGETABLES SEED, USD, AFRICA, 2017 - 2030
- Figure 153:
- VALUE SHARE OF SOUTH AFRICA VEGETABLES SEED BY CROP, %, AFRICA, 2023 AND 2030
- Figure 154:
- VOLUME OF TANZANIA VEGETABLES SEED, METRIC TON, AFRICA, 2017 - 2030
- Figure 155:
- VALUE OF TANZANIA VEGETABLES SEED, USD, AFRICA, 2017 - 2030
- Figure 156:
- VALUE SHARE OF TANZANIA VEGETABLES SEED BY CROP, %, AFRICA, 2023 AND 2030
- Figure 157:
- VOLUME OF REST OF AFRICA VEGETABLES SEED, METRIC TON, AFRICA, 2017 - 2030
- Figure 158:
- VALUE OF REST OF AFRICA VEGETABLES SEED, USD, AFRICA, 2017 - 2030
- Figure 159:
- VALUE SHARE OF REST OF AFRICA VEGETABLES SEED BY CROP, %, AFRICA, 2023 AND 2030
- Figure 160:
- VOLUME OF VEGETABLES SEED BY BREEDING TECHNOLOGY CATEGORIES, METRIC TON, ASIA-PACIFIC, 2017 - 2030
- Figure 161:
- VALUE OF VEGETABLES SEED BY BREEDING TECHNOLOGY CATEGORIES, USD, ASIA-PACIFIC, 2017 - 2030
- Figure 162:
- VOLUME SHARE OF VEGETABLES SEED BY BREEDING TECHNOLOGY CATEGORIES, %, ASIA-PACIFIC, 2017 VS 2023 VS 2030
- Figure 163:
- VALUE SHARE OF VEGETABLES SEED BY BREEDING TECHNOLOGY CATEGORIES, %, ASIA-PACIFIC, 2017 VS 2023 VS 2030
- Figure 164:
- VOLUME OF VEGETABLES SEED BY CULTIVATION MECHANISM CATEGORIES, METRIC TON, ASIA-PACIFIC, 2017 - 2030
- Figure 165:
- VALUE OF VEGETABLES SEED BY CULTIVATION MECHANISM CATEGORIES, USD, ASIA-PACIFIC, 2017 - 2030
- Figure 166:
- VOLUME SHARE OF VEGETABLES SEED BY CULTIVATION MECHANISM CATEGORIES, %, ASIA-PACIFIC, 2017 VS 2023 VS 2030
- Figure 167:
- VALUE SHARE OF VEGETABLES SEED BY CULTIVATION MECHANISM CATEGORIES, %, ASIA-PACIFIC, 2017 VS 2023 VS 2030
- Figure 168:
- VOLUME OF VEGETABLES SEED BY CROP CATEGORIES, METRIC TON, ASIA-PACIFIC, 2017 - 2030
- Figure 169:
- VALUE OF VEGETABLES SEED BY CROP CATEGORIES, USD, ASIA-PACIFIC, 2017 - 2030
- Figure 170:
- VOLUME SHARE OF VEGETABLES SEED BY CROP CATEGORIES, %, ASIA-PACIFIC, 2017 VS 2023 VS 2030
- Figure 171:
- VALUE SHARE OF VEGETABLES SEED BY CROP CATEGORIES, %, ASIA-PACIFIC, 2017 VS 2023 VS 2030
- Figure 172:
- VOLUME OF VEGETABLES SEED BY COUNTRY, METRIC TON, ASIA-PACIFIC, 2017 - 2030
- Figure 173:
- VALUE OF VEGETABLES SEED BY COUNTRY, USD, ASIA-PACIFIC, 2017 - 2030
- Figure 174:
- VOLUME SHARE OF VEGETABLES SEED BY COUNTRY, %, ASIA-PACIFIC, 2017 VS 2023 VS 2030
- Figure 175:
- VALUE SHARE OF VEGETABLES SEED BY COUNTRY, %, ASIA-PACIFIC, 2017 VS 2023 VS 2030
- Figure 176:
- VOLUME OF AUSTRALIA VEGETABLES SEED, METRIC TON, ASIA-PACIFIC, 2017 - 2030
- Figure 177:
- VALUE OF AUSTRALIA VEGETABLES SEED, USD, ASIA-PACIFIC, 2017 - 2030
- Figure 178:
- VALUE SHARE OF AUSTRALIA VEGETABLES SEED BY CROP, %, ASIA-PACIFIC, 2023 AND 2030
- Figure 179:
- VOLUME OF BANGLADESH VEGETABLES SEED, METRIC TON, ASIA-PACIFIC, 2017 - 2030
- Figure 180:
- VALUE OF BANGLADESH VEGETABLES SEED, USD, ASIA-PACIFIC, 2017 - 2030
- Figure 181:
- VALUE SHARE OF BANGLADESH VEGETABLES SEED BY CROP, %, ASIA-PACIFIC, 2023 AND 2030
- Figure 182:
- VOLUME OF CHINA VEGETABLES SEED, METRIC TON, ASIA-PACIFIC, 2017 - 2030
- Figure 183:
- VALUE OF CHINA VEGETABLES SEED, USD, ASIA-PACIFIC, 2017 - 2030
- Figure 184:
- VALUE SHARE OF CHINA VEGETABLES SEED BY CROP, %, ASIA-PACIFIC, 2023 AND 2030
- Figure 185:
- VOLUME OF INDIA VEGETABLES SEED, METRIC TON, ASIA-PACIFIC, 2017 - 2030
- Figure 186:
- VALUE OF INDIA VEGETABLES SEED, USD, ASIA-PACIFIC, 2017 - 2030
- Figure 187:
- VALUE SHARE OF INDIA VEGETABLES SEED BY CROP, %, ASIA-PACIFIC, 2023 AND 2030
- Figure 188:
- VOLUME OF INDONESIA VEGETABLES SEED, METRIC TON, ASIA-PACIFIC, 2017 - 2030
- Figure 189:
- VALUE OF INDONESIA VEGETABLES SEED, USD, ASIA-PACIFIC, 2017 - 2030
- Figure 190:
- VALUE SHARE OF INDONESIA VEGETABLES SEED BY CROP, %, ASIA-PACIFIC, 2023 AND 2030
- Figure 191:
- VOLUME OF JAPAN VEGETABLES SEED, METRIC TON, ASIA-PACIFIC, 2017 - 2030
- Figure 192:
- VALUE OF JAPAN VEGETABLES SEED, USD, ASIA-PACIFIC, 2017 - 2030
- Figure 193:
- VALUE SHARE OF JAPAN VEGETABLES SEED BY CROP, %, ASIA-PACIFIC, 2023 AND 2030
- Figure 194:
- VOLUME OF MYANMAR VEGETABLES SEED, METRIC TON, ASIA-PACIFIC, 2017 - 2030
- Figure 195:
- VALUE OF MYANMAR VEGETABLES SEED, USD, ASIA-PACIFIC, 2017 - 2030
- Figure 196:
- VALUE SHARE OF MYANMAR VEGETABLES SEED BY CROP, %, ASIA-PACIFIC, 2023 AND 2030
- Figure 197:
- VOLUME OF PAKISTAN VEGETABLES SEED, METRIC TON, ASIA-PACIFIC, 2017 - 2030
- Figure 198:
- VALUE OF PAKISTAN VEGETABLES SEED, USD, ASIA-PACIFIC, 2017 - 2030
- Figure 199:
- VALUE SHARE OF PAKISTAN VEGETABLES SEED BY CROP, %, ASIA-PACIFIC, 2023 AND 2030
- Figure 200:
- VOLUME OF PHILIPPINES VEGETABLES SEED, METRIC TON, ASIA-PACIFIC, 2017 - 2030
- Figure 201:
- VALUE OF PHILIPPINES VEGETABLES SEED, USD, ASIA-PACIFIC, 2017 - 2030
- Figure 202:
- VALUE SHARE OF PHILIPPINES VEGETABLES SEED BY CROP, %, ASIA-PACIFIC, 2023 AND 2030
- Figure 203:
- VOLUME OF THAILAND VEGETABLES SEED, METRIC TON, ASIA-PACIFIC, 2017 - 2030
- Figure 204:
- VALUE OF THAILAND VEGETABLES SEED, USD, ASIA-PACIFIC, 2017 - 2030
- Figure 205:
- VALUE SHARE OF THAILAND VEGETABLES SEED BY CROP, %, ASIA-PACIFIC, 2023 AND 2030
- Figure 206:
- VOLUME OF VIETNAM VEGETABLES SEED, METRIC TON, ASIA-PACIFIC, 2017 - 2030
- Figure 207:
- VALUE OF VIETNAM VEGETABLES SEED, USD, ASIA-PACIFIC, 2017 - 2030
- Figure 208:
- VALUE SHARE OF VIETNAM VEGETABLES SEED BY CROP, %, ASIA-PACIFIC, 2023 AND 2030
- Figure 209:
- VOLUME OF REST OF ASIA-PACIFIC VEGETABLES SEED, METRIC TON, ASIA-PACIFIC, 2017 - 2030
- Figure 210:
- VALUE OF REST OF ASIA-PACIFIC VEGETABLES SEED, USD, ASIA-PACIFIC, 2017 - 2030
- Figure 211:
- VALUE SHARE OF REST OF ASIA-PACIFIC VEGETABLES SEED BY CROP, %, ASIA-PACIFIC, 2023 AND 2030
- Figure 212:
- VOLUME OF VEGETABLES SEED BY BREEDING TECHNOLOGY CATEGORIES, METRIC TON, EUROPE, 2017 - 2030
- Figure 213:
- VALUE OF VEGETABLES SEED BY BREEDING TECHNOLOGY CATEGORIES, USD, EUROPE, 2017 - 2030
- Figure 214:
- VOLUME SHARE OF VEGETABLES SEED BY BREEDING TECHNOLOGY CATEGORIES, %, EUROPE, 2017 VS 2023 VS 2030
- Figure 215:
- VALUE SHARE OF VEGETABLES SEED BY BREEDING TECHNOLOGY CATEGORIES, %, EUROPE, 2017 VS 2023 VS 2030
- Figure 216:
- VOLUME OF VEGETABLES SEED BY CULTIVATION MECHANISM CATEGORIES, METRIC TON, EUROPE, 2017 - 2030
- Figure 217:
- VALUE OF VEGETABLES SEED BY CULTIVATION MECHANISM CATEGORIES, USD, EUROPE, 2017 - 2030
- Figure 218:
- VOLUME SHARE OF VEGETABLES SEED BY CULTIVATION MECHANISM CATEGORIES, %, EUROPE, 2017 VS 2023 VS 2030
- Figure 219:
- VALUE SHARE OF VEGETABLES SEED BY CULTIVATION MECHANISM CATEGORIES, %, EUROPE, 2017 VS 2023 VS 2030
- Figure 220:
- VOLUME OF VEGETABLES SEED BY CROP CATEGORIES, METRIC TON, EUROPE, 2017 - 2030
- Figure 221:
- VALUE OF VEGETABLES SEED BY CROP CATEGORIES, USD, EUROPE, 2017 - 2030
- Figure 222:
- VOLUME SHARE OF VEGETABLES SEED BY CROP CATEGORIES, %, EUROPE, 2017 VS 2023 VS 2030
- Figure 223:
- VALUE SHARE OF VEGETABLES SEED BY CROP CATEGORIES, %, EUROPE, 2017 VS 2023 VS 2030
- Figure 224:
- VOLUME OF VEGETABLES SEED BY COUNTRY, METRIC TON, EUROPE, 2017 - 2030
- Figure 225:
- VALUE OF VEGETABLES SEED BY COUNTRY, USD, EUROPE, 2017 - 2030
- Figure 226:
- VOLUME SHARE OF VEGETABLES SEED BY COUNTRY, %, EUROPE, 2017 VS 2023 VS 2030
- Figure 227:
- VALUE SHARE OF VEGETABLES SEED BY COUNTRY, %, EUROPE, 2017 VS 2023 VS 2030
- Figure 228:
- VOLUME OF FRANCE VEGETABLES SEED, METRIC TON, EUROPE, 2017 - 2030
- Figure 229:
- VALUE OF FRANCE VEGETABLES SEED, USD, EUROPE, 2017 - 2030
- Figure 230:
- VALUE SHARE OF FRANCE VEGETABLES SEED BY CROP, %, EUROPE, 2023 AND 2030
- Figure 231:
- VOLUME OF GERMANY VEGETABLES SEED, METRIC TON, EUROPE, 2017 - 2030
- Figure 232:
- VALUE OF GERMANY VEGETABLES SEED, USD, EUROPE, 2017 - 2030
- Figure 233:
- VALUE SHARE OF GERMANY VEGETABLES SEED BY CROP, %, EUROPE, 2023 AND 2030
- Figure 234:
- VOLUME OF ITALY VEGETABLES SEED, METRIC TON, EUROPE, 2017 - 2030
- Figure 235:
- VALUE OF ITALY VEGETABLES SEED, USD, EUROPE, 2017 - 2030
- Figure 236:
- VALUE SHARE OF ITALY VEGETABLES SEED BY CROP, %, EUROPE, 2023 AND 2030
- Figure 237:
- VOLUME OF NETHERLANDS VEGETABLES SEED, METRIC TON, EUROPE, 2017 - 2030
- Figure 238:
- VALUE OF NETHERLANDS VEGETABLES SEED, USD, EUROPE, 2017 - 2030
- Figure 239:
- VALUE SHARE OF NETHERLANDS VEGETABLES SEED BY CROP, %, EUROPE, 2023 AND 2030
- Figure 240:
- VOLUME OF POLAND VEGETABLES SEED, METRIC TON, EUROPE, 2017 - 2030
- Figure 241:
- VALUE OF POLAND VEGETABLES SEED, USD, EUROPE, 2017 - 2030
- Figure 242:
- VALUE SHARE OF POLAND VEGETABLES SEED BY CROP, %, EUROPE, 2023 AND 2030
- Figure 243:
- VOLUME OF ROMANIA VEGETABLES SEED, METRIC TON, EUROPE, 2017 - 2030
- Figure 244:
- VALUE OF ROMANIA VEGETABLES SEED, USD, EUROPE, 2017 - 2030
- Figure 245:
- VALUE SHARE OF ROMANIA VEGETABLES SEED BY CROP, %, EUROPE, 2023 AND 2030
- Figure 246:
- VOLUME OF RUSSIA VEGETABLES SEED, METRIC TON, EUROPE, 2017 - 2030
- Figure 247:
- VALUE OF RUSSIA VEGETABLES SEED, USD, EUROPE, 2017 - 2030
- Figure 248:
- VALUE SHARE OF RUSSIA VEGETABLES SEED BY CROP, %, EUROPE, 2023 AND 2030
- Figure 249:
- VOLUME OF SPAIN VEGETABLES SEED, METRIC TON, EUROPE, 2017 - 2030
- Figure 250:
- VALUE OF SPAIN VEGETABLES SEED, USD, EUROPE, 2017 - 2030
- Figure 251:
- VALUE SHARE OF SPAIN VEGETABLES SEED BY CROP, %, EUROPE, 2023 AND 2030
- Figure 252:
- VOLUME OF TURKEY VEGETABLES SEED, METRIC TON, EUROPE, 2017 - 2030
- Figure 253:
- VALUE OF TURKEY VEGETABLES SEED, USD, EUROPE, 2017 - 2030
- Figure 254:
- VALUE SHARE OF TURKEY VEGETABLES SEED BY CROP, %, EUROPE, 2023 AND 2030
- Figure 255:
- VOLUME OF UKRAINE VEGETABLES SEED, METRIC TON, EUROPE, 2017 - 2030
- Figure 256:
- VALUE OF UKRAINE VEGETABLES SEED, USD, EUROPE, 2017 - 2030
- Figure 257:
- VALUE SHARE OF UKRAINE VEGETABLES SEED BY CROP, %, EUROPE, 2023 AND 2030
- Figure 258:
- VOLUME OF UNITED KINGDOM VEGETABLES SEED, METRIC TON, EUROPE, 2017 - 2030
- Figure 259:
- VALUE OF UNITED KINGDOM VEGETABLES SEED, USD, EUROPE, 2017 - 2030
- Figure 260:
- VALUE SHARE OF UNITED KINGDOM VEGETABLES SEED BY CROP, %, EUROPE, 2023 AND 2030
- Figure 261:
- VOLUME OF REST OF EUROPE VEGETABLES SEED, METRIC TON, EUROPE, 2017 - 2030
- Figure 262:
- VALUE OF REST OF EUROPE VEGETABLES SEED, USD, EUROPE, 2017 - 2030
- Figure 263:
- VALUE SHARE OF REST OF EUROPE VEGETABLES SEED BY CROP, %, EUROPE, 2023 AND 2030
- Figure 264:
- VOLUME OF VEGETABLES SEED BY BREEDING TECHNOLOGY CATEGORIES, METRIC TON, MIDDLE EAST, 2017 - 2030
- Figure 265:
- VALUE OF VEGETABLES SEED BY BREEDING TECHNOLOGY CATEGORIES, USD, MIDDLE EAST, 2017 - 2030
- Figure 266:
- VOLUME SHARE OF VEGETABLES SEED BY BREEDING TECHNOLOGY CATEGORIES, %, MIDDLE EAST, 2017 VS 2023 VS 2030
- Figure 267:
- VALUE SHARE OF VEGETABLES SEED BY BREEDING TECHNOLOGY CATEGORIES, %, MIDDLE EAST, 2017 VS 2023 VS 2030
- Figure 268:
- VOLUME OF VEGETABLES SEED BY CULTIVATION MECHANISM CATEGORIES, METRIC TON, MIDDLE EAST, 2017 - 2030
- Figure 269:
- VALUE OF VEGETABLES SEED BY CULTIVATION MECHANISM CATEGORIES, USD, MIDDLE EAST, 2017 - 2030
- Figure 270:
- VOLUME SHARE OF VEGETABLES SEED BY CULTIVATION MECHANISM CATEGORIES, %, MIDDLE EAST, 2017 VS 2023 VS 2030
- Figure 271:
- VALUE SHARE OF VEGETABLES SEED BY CULTIVATION MECHANISM CATEGORIES, %, MIDDLE EAST, 2017 VS 2023 VS 2030
- Figure 272:
- VOLUME OF VEGETABLES SEED BY CROP CATEGORIES, METRIC TON, MIDDLE EAST, 2017 - 2030
- Figure 273:
- VALUE OF VEGETABLES SEED BY CROP CATEGORIES, USD, MIDDLE EAST, 2017 - 2030
- Figure 274:
- VOLUME SHARE OF VEGETABLES SEED BY CROP CATEGORIES, %, MIDDLE EAST, 2017 VS 2023 VS 2030
- Figure 275:
- VALUE SHARE OF VEGETABLES SEED BY CROP CATEGORIES, %, MIDDLE EAST, 2017 VS 2023 VS 2030
- Figure 276:
- VOLUME OF VEGETABLES SEED BY COUNTRY, METRIC TON, MIDDLE EAST, 2017 - 2030
- Figure 277:
- VALUE OF VEGETABLES SEED BY COUNTRY, USD, MIDDLE EAST, 2017 - 2030
- Figure 278:
- VOLUME SHARE OF VEGETABLES SEED BY COUNTRY, %, MIDDLE EAST, 2017 VS 2023 VS 2030
- Figure 279:
- VALUE SHARE OF VEGETABLES SEED BY COUNTRY, %, MIDDLE EAST, 2017 VS 2023 VS 2030
- Figure 280:
- VOLUME OF IRAN VEGETABLES SEED, METRIC TON, MIDDLE EAST, 2017 - 2030
- Figure 281:
- VALUE OF IRAN VEGETABLES SEED, USD, MIDDLE EAST, 2017 - 2030
- Figure 282:
- VALUE SHARE OF IRAN VEGETABLES SEED BY CROP, %, MIDDLE EAST, 2023 AND 2030
- Figure 283:
- VOLUME OF SAUDI ARABIA VEGETABLES SEED, METRIC TON, MIDDLE EAST, 2017 - 2030
- Figure 284:
- VALUE OF SAUDI ARABIA VEGETABLES SEED, USD, MIDDLE EAST, 2017 - 2030
- Figure 285:
- VALUE SHARE OF SAUDI ARABIA VEGETABLES SEED BY CROP, %, MIDDLE EAST, 2023 AND 2030
- Figure 286:
- VOLUME OF REST OF MIDDLE EAST VEGETABLES SEED, METRIC TON, MIDDLE EAST, 2017 - 2030
- Figure 287:
- VALUE OF REST OF MIDDLE EAST VEGETABLES SEED, USD, MIDDLE EAST, 2017 - 2030
- Figure 288:
- VALUE SHARE OF REST OF MIDDLE EAST VEGETABLES SEED BY CROP, %, MIDDLE EAST, 2023 AND 2030
- Figure 289:
- VOLUME OF VEGETABLES SEED BY BREEDING TECHNOLOGY CATEGORIES, METRIC TON, NORTH AMERICA, 2017 - 2030
- Figure 290:
- VALUE OF VEGETABLES SEED BY BREEDING TECHNOLOGY CATEGORIES, USD, NORTH AMERICA, 2017 - 2030
- Figure 291:
- VOLUME SHARE OF VEGETABLES SEED BY BREEDING TECHNOLOGY CATEGORIES, %, NORTH AMERICA, 2017 VS 2023 VS 2030
- Figure 292:
- VALUE SHARE OF VEGETABLES SEED BY BREEDING TECHNOLOGY CATEGORIES, %, NORTH AMERICA, 2017 VS 2023 VS 2030
- Figure 293:
- VOLUME OF VEGETABLES SEED BY CULTIVATION MECHANISM CATEGORIES, METRIC TON, NORTH AMERICA, 2017 - 2030
- Figure 294:
- VALUE OF VEGETABLES SEED BY CULTIVATION MECHANISM CATEGORIES, USD, NORTH AMERICA, 2017 - 2030
- Figure 295:
- VOLUME SHARE OF VEGETABLES SEED BY CULTIVATION MECHANISM CATEGORIES, %, NORTH AMERICA, 2017 VS 2023 VS 2030
- Figure 296:
- VALUE SHARE OF VEGETABLES SEED BY CULTIVATION MECHANISM CATEGORIES, %, NORTH AMERICA, 2017 VS 2023 VS 2030
- Figure 297:
- VOLUME OF VEGETABLES SEED BY CROP CATEGORIES, METRIC TON, NORTH AMERICA, 2017 - 2030
- Figure 298:
- VALUE OF VEGETABLES SEED BY CROP CATEGORIES, USD, NORTH AMERICA, 2017 - 2030
- Figure 299:
- VOLUME SHARE OF VEGETABLES SEED BY CROP CATEGORIES, %, NORTH AMERICA, 2017 VS 2023 VS 2030
- Figure 300:
- VALUE SHARE OF VEGETABLES SEED BY CROP CATEGORIES, %, NORTH AMERICA, 2017 VS 2023 VS 2030
- Figure 301:
- VOLUME OF VEGETABLES SEED BY COUNTRY, METRIC TON, NORTH AMERICA, 2017 - 2030
- Figure 302:
- VALUE OF VEGETABLES SEED BY COUNTRY, USD, NORTH AMERICA, 2017 - 2030
- Figure 303:
- VOLUME SHARE OF VEGETABLES SEED BY COUNTRY, %, NORTH AMERICA, 2017 VS 2023 VS 2030
- Figure 304:
- VALUE SHARE OF VEGETABLES SEED BY COUNTRY, %, NORTH AMERICA, 2017 VS 2023 VS 2030
- Figure 305:
- VOLUME OF CANADA VEGETABLES SEED, METRIC TON, NORTH AMERICA, 2017 - 2030
- Figure 306:
- VALUE OF CANADA VEGETABLES SEED, USD, NORTH AMERICA, 2017 - 2030
- Figure 307:
- VALUE SHARE OF CANADA VEGETABLES SEED BY CROP, %, NORTH AMERICA, 2023 AND 2030
- Figure 308:
- VOLUME OF MEXICO VEGETABLES SEED, METRIC TON, NORTH AMERICA, 2017 - 2030
- Figure 309:
- VALUE OF MEXICO VEGETABLES SEED, USD, NORTH AMERICA, 2017 - 2030
- Figure 310:
- VALUE SHARE OF MEXICO VEGETABLES SEED BY CROP, %, NORTH AMERICA, 2023 AND 2030
- Figure 311:
- VOLUME OF UNITED STATES VEGETABLES SEED, METRIC TON, NORTH AMERICA, 2017 - 2030
- Figure 312:
- VALUE OF UNITED STATES VEGETABLES SEED, USD, NORTH AMERICA, 2017 - 2030
- Figure 313:
- VALUE SHARE OF UNITED STATES VEGETABLES SEED BY CROP, %, NORTH AMERICA, 2023 AND 2030
- Figure 314:
- VOLUME OF REST OF NORTH AMERICA VEGETABLES SEED, METRIC TON, NORTH AMERICA, 2017 - 2030
- Figure 315:
- VALUE OF REST OF NORTH AMERICA VEGETABLES SEED, USD, NORTH AMERICA, 2017 - 2030
- Figure 316:
- VALUE SHARE OF REST OF NORTH AMERICA VEGETABLES SEED BY CROP, %, NORTH AMERICA, 2023 AND 2030
- Figure 317:
- VOLUME OF VEGETABLES SEED BY BREEDING TECHNOLOGY CATEGORIES, METRIC TON, SOUTH AMERICA, 2017 - 2030
- Figure 318:
- VALUE OF VEGETABLES SEED BY BREEDING TECHNOLOGY CATEGORIES, USD, SOUTH AMERICA, 2017 - 2030
- Figure 319:
- VOLUME SHARE OF VEGETABLES SEED BY BREEDING TECHNOLOGY CATEGORIES, %, SOUTH AMERICA, 2017 VS 2023 VS 2030
- Figure 320:
- VALUE SHARE OF VEGETABLES SEED BY BREEDING TECHNOLOGY CATEGORIES, %, SOUTH AMERICA, 2017 VS 2023 VS 2030
- Figure 321:
- VOLUME OF VEGETABLES SEED BY CULTIVATION MECHANISM CATEGORIES, METRIC TON, SOUTH AMERICA, 2017 - 2030
- Figure 322:
- VALUE OF VEGETABLES SEED BY CULTIVATION MECHANISM CATEGORIES, USD, SOUTH AMERICA, 2017 - 2030
- Figure 323:
- VOLUME SHARE OF VEGETABLES SEED BY CULTIVATION MECHANISM CATEGORIES, %, SOUTH AMERICA, 2017 VS 2023 VS 2030
- Figure 324:
- VALUE SHARE OF VEGETABLES SEED BY CULTIVATION MECHANISM CATEGORIES, %, SOUTH AMERICA, 2017 VS 2023 VS 2030
- Figure 325:
- VOLUME OF VEGETABLES SEED BY CROP CATEGORIES, METRIC TON, SOUTH AMERICA, 2017 - 2030
- Figure 326:
- VALUE OF VEGETABLES SEED BY CROP CATEGORIES, USD, SOUTH AMERICA, 2017 - 2030
- Figure 327:
- VOLUME SHARE OF VEGETABLES SEED BY CROP CATEGORIES, %, SOUTH AMERICA, 2017 VS 2023 VS 2030
- Figure 328:
- VALUE SHARE OF VEGETABLES SEED BY CROP CATEGORIES, %, SOUTH AMERICA, 2017 VS 2023 VS 2030
- Figure 329:
- VOLUME OF VEGETABLES SEED BY COUNTRY, METRIC TON, SOUTH AMERICA, 2017 - 2030
- Figure 330:
- VALUE OF VEGETABLES SEED BY COUNTRY, USD, SOUTH AMERICA, 2017 - 2030
- Figure 331:
- VOLUME SHARE OF VEGETABLES SEED BY COUNTRY, %, SOUTH AMERICA, 2017 VS 2023 VS 2030
- Figure 332:
- VALUE SHARE OF VEGETABLES SEED BY COUNTRY, %, SOUTH AMERICA, 2017 VS 2023 VS 2030
- Figure 333:
- VOLUME OF ARGENTINA VEGETABLES SEED, METRIC TON, SOUTH AMERICA, 2017 - 2030
- Figure 334:
- VALUE OF ARGENTINA VEGETABLES SEED, USD, SOUTH AMERICA, 2017 - 2030
- Figure 335:
- VALUE SHARE OF ARGENTINA VEGETABLES SEED BY CROP, %, SOUTH AMERICA, 2023 AND 2030
- Figure 336:
- VOLUME OF BRAZIL VEGETABLES SEED, METRIC TON, SOUTH AMERICA, 2017 - 2030
- Figure 337:
- VALUE OF BRAZIL VEGETABLES SEED, USD, SOUTH AMERICA, 2017 - 2030
- Figure 338:
- VALUE SHARE OF BRAZIL VEGETABLES SEED BY CROP, %, SOUTH AMERICA, 2023 AND 2030
- Figure 339:
- VOLUME OF REST OF SOUTH AMERICA VEGETABLES SEED, METRIC TON, SOUTH AMERICA, 2017 - 2030
- Figure 340:
- VALUE OF REST OF SOUTH AMERICA VEGETABLES SEED, USD, SOUTH AMERICA, 2017 - 2030
- Figure 341:
- VALUE SHARE OF REST OF SOUTH AMERICA VEGETABLES SEED BY CROP, %, SOUTH AMERICA, 2023 AND 2030
- Figure 342:
- MOST ACTIVE COMPANIES BY NUMBER OF STRATEGIC MOVES, COUNT, GLOBAL, 2017-2023
- Figure 343:
- MOST ADOPTED STRATEGIES, COUNT, GLOBAL, 2017-2023
- Figure 344:
- VALUE SHARE OF MAJOR PLAYERS, %, GLOBAL
Vegetable Seed Industry Segmentation
Hybrids, Open Pollinated Varieties & Hybrid Derivatives are covered as segments by Breeding Technology. Open Field, Protected Cultivation are covered as segments by Cultivation Mechanism. Brassicas, Cucurbits, Roots & Bulbs, Solanaceae, Unclassified Vegetables are covered as segments by Crop Family. Africa, Asia-Pacific, Europe, Middle East, North America, South America are covered as segments by Region.| Breeding Technology | Hybrids | |||
| Open Pollinated Varieties & Hybrid Derivatives | ||||
| Cultivation Mechanism | Open Field | |||
| Protected Cultivation | ||||
| Crop Family | Brassicas | Cabbage | ||
| Carrot | ||||
| Cauliflower & Broccoli | ||||
| Other Brassicas | ||||
| Cucurbits | Cucumber & Gherkin | |||
| Pumpkin & Squash | ||||
| Other Cucurbits | ||||
| Roots & Bulbs | Garlic | |||
| Onion | ||||
| Potato | ||||
| Other Roots & Bulbs | ||||
| Solanaceae | Chilli | |||
| Eggplant | ||||
| Tomato | ||||
| Other Solanaceae | ||||
| Unclassified Vegetables | Asparagus | |||
| Lettuce | ||||
| Okra | ||||
| Peas | ||||
| Spinach | ||||
| Other Unclassified Vegetables | ||||
| Region | Africa | By Breeding Technology | ||
| By Cultivation Mechanism | ||||
| By Crop | ||||
| By Country | Egypt | |||
| Ethiopia | ||||
| Ghana | ||||
| Kenya | ||||
| Nigeria | ||||
| South Africa | ||||
| Tanzania | ||||
| Rest of Africa | ||||
| Asia-Pacific | By Breeding Technology | |||
| By Cultivation Mechanism | ||||
| By Crop | ||||
| Australia | ||||
| Bangladesh | ||||
| China | ||||
| India | ||||
| Indonesia | ||||
| Japan | ||||
| Myanmar | ||||
| Pakistan | ||||
| Philippines | ||||
| Thailand | ||||
| Vietnam | ||||
| Rest of Asia-Pacific | ||||
| Europe | By Breeding Technology | |||
| By Cultivation Mechanism | ||||
| By Crop | ||||
| France | ||||
| Germany | ||||
| Italy | ||||
| Netherlands | ||||
| Poland | ||||
| Romania | ||||
| Russia | ||||
| Spain | ||||
| Turkey | ||||
| Ukraine | ||||
| United Kingdom | ||||
| Rest of Europe | ||||
| Middle East | By Breeding Technology | |||
| By Cultivation Mechanism | ||||
| By Crop | ||||
| Iran | ||||
| Saudi Arabia | ||||
| Rest of Middle East | ||||
| North America | By Breeding Technology | |||
| By Cultivation Mechanism | ||||
| By Crop | ||||
| Canada | ||||
| Mexico | ||||
| United States | ||||
| Rest of North America | ||||
| South America | By Breeding Technology | |||
| By Cultivation Mechanism | ||||
| By Crop | ||||
| Argentina | ||||
| Brazil | ||||
| Rest of South America | ||||
Need A Different Region or Segment?
Customize Now
Market Definition
- Commercial Seed - For the purpose of this study, only commercial seeds have been included as part of the scope. Farm-saved Seeds, which are not commercially labeled are excluded from scope, even though a minor percentage of farm-saved seeds are exchanged commercially among farmers. The scope also excludes vegetatively reproduced crops and plant parts, which may be commercially sold in the market.
- Crop Acreage - While calculating the acreage under different crops, the Gross Cropped Area has been considered. Also known as Area Harvested, according to the Food & Agricultural Organization (FAO), this includes the total area cultivated under a particular crop across seasons.
- Seed Replacement Rate - Seed Replacement Rate is the percentage of area sown out of the total area of crop planted in the season by using certified/quality seeds other than the farm-saved seed.
- Protected Cultivation - The report defines protected cultivation as the process of growing crops in a controlled environment. This includes greenhouses, glasshouses, hydroponics, aeroponics, or any other cultivation system that protects the crop against any abiotic stress. However, cultivation in an open field using plastic mulch is excluded from this definition and is included under open field.
| Keyword | Definition |
|---|---|
| Row Crops | These are usually the field crops which include the different crop categories like grains & cereals, oilseeds, fiber crops like cotton, pulses, and forage crops. |
| Solanaceae | These are the family of flowering plants which includes tomato, chili, eggplants, and other crops. |
| Cucurbits | It represents a gourd family consisting of about 965 species in around 95 genera. The major crops considered for this study include Cucumber & Gherkin, Pumpkin and squash, and other crops. |
| Brassicas | It is a genus of plants in the cabbage and mustard family. It includes crops such as carrots, cabbage, cauliflower & broccoli. |
| Roots & Bulbs | The roots and bulbs segment includes onion, garlic, potato, and other crops. |
| Unclassified Vegetables | This segment in the report includes the crops which don’t belong to any of the above-mentioned categories. These include crops such as okra, asparagus, lettuce, peas, spinach, and others. |
| Hybrid Seed | It is the first generation of the seed produced by controlling cross-pollination and by combining two or more varieties, or species. |
| Transgenic Seed | It is a seed that is genetically modified to contain certain desirable input and/or output traits. |
| Non-Transgenic Seed | The seed produced through cross-pollination without any genetic modification. |
| Open-Pollinated Varieties & Hybrid Derivatives | Open-pollinated varieties produce seeds true to type as they cross-pollinate only with other plants of the same variety. |
| Other Solanaceae | The crops considered under other Solanaceae include bell peppers and other different peppers based on the locality of the respective countries. |
| Other Brassicaceae | The crops considered under other brassicas include radishes, turnips, Brussels sprouts, and kale. |
| Other Roots & Bulbs | The crops considered under other roots & bulbs include Sweet Potatoes and cassava. |
| Other Cucurbits | The crops considered under other cucurbits include gourds (bottle gourd, bitter gourd, ridge gourd, Snake gourd, and others). |
| Other Grains & Cereals | The crops considered under other grains & cereals include Barley, Buck Wheat, Canary Seed, Triticale, Oats, Millets, and Rye. |
| Other Fibre Crops | The crops considered under other fibers include Hemp, Jute, Agave fibers, Flax, Kenaf, Ramie, Abaca, Sisal, and Kapok. |
| Other Oilseeds | The crops considered under other oilseeds include Ground nut, Hempseed, Mustard seed, Castor seeds, safflower seeds, Sesame seeds, and Linseeds. |
| Other Forage Crops | The crops considered under other forages include Napier grass, Oat grass, White clover, Ryegrass, and Timothy. Other forage crops were considered based on the locality of the respective countries. |
| Pulses | Pigeon peas, Lentils, Broad and horse beans, Vetches, Chickpeas, Cowpeas, Lupins, and Bambara beans are the crops considered under pulses. |
| Other Unclassified Vegetables | The crops considered under other unclassified vegetables include Artichokes, Cassava Leaves, Leeks, Chicory, and String beans. |
Need More Details on Market Definition?
Ask a Question
Research Methodology
Mordor Intelligence follows a four-step methodology in all our reports.
- Step-1: IDENTIFY KEY VARIABLES: In order to build a robust forecasting methodology, the variables and factors identified in Step-1 are tested against available historical market numbers. Through an iterative process, the variables required for market forecast are set and the model is built on the basis of these variables.
- Step-2: Build a Market Model: Market-size estimations for the forecast years are in nominal terms. Inflation is not a part of the pricing, and the average selling price (ASP) is kept constant throughout the forecast period.
- Step-3: Validate and Finalize: In this important step, all market numbers, variables and analyst calls are validated through an extensive network of primary research experts from the market studied. The respondents are selected across levels and functions to generate a holistic picture of the market studied.
- Step-4: Research Outputs: Syndicated Reports, Custom Consulting Assignments, Databases, and Subscription Platforms

Get More Details On Research Methodology
Download PDF


