United States OTT Market Size and Share
Market Overview
| Study Period | 2020 - 2031 |
|---|---|
| Forecast Data Period | 2026 - 2031 |
| Historical Data Period | 2020 - 2024 |
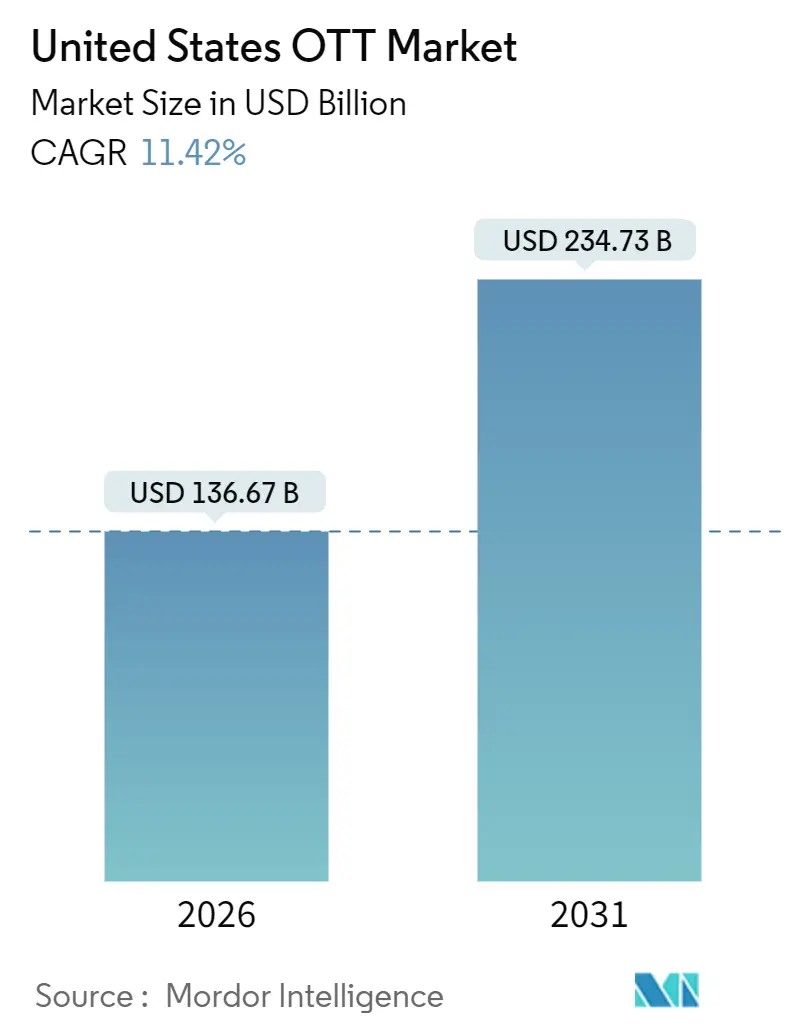
| Market Size (2026) | USD 136.67 Billion |
| Market Size (2031) | USD 234.73 Billion |
| Growth Rate (2026 - 2031) | 11.42% CAGR |
| Market Concentration | Medium |
Major Players
*Disclaimer: Major Players sorted in no particular order Image © Mordor Intelligence. Reuse requires attribution under CC BY 4.0. |
|
United States OTT Market Analysis by Mordor Intelligence
The United States OTT market size reached USD 136.67 billion in 2026 and is projected to climb to USD 234.73 billion by 2031, advancing at an 11.42% CAGR. Accelerating cord-cutting, ubiquitous fiber and 5G rollouts, and the rapid mainstreaming of ad-supported tiers that now rival pure subscriptions are reshaping video consumption. Smart-television penetration tops 88% of U.S. households, moving viewing back to the living room where advertisers prize co-viewing and larger screens. Exclusive sports rights are fragmenting across digital platforms, drawing younger fans away from legacy pay-TV bundles. Meanwhile, consolidation led by Netflix’s USD 72 billion bid for Warner Bros. Discovery signals that scale in both production and distribution is now a defensive requirement against surging content costs. Regulatory scrutiny of that megadeal, sustainability concerns over data-center emissions, and subscriber frustration with search times longer than 12 minutes are the headline risks tempering otherwise strong growth.
Key Report Takeaways
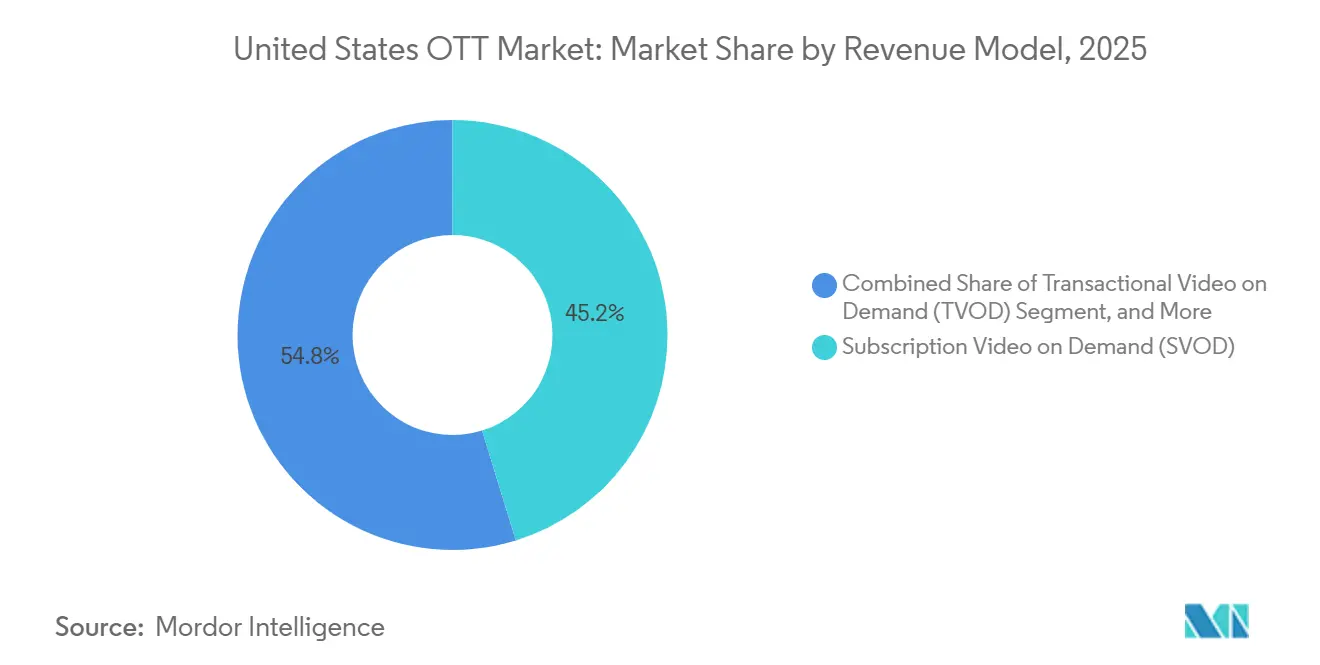
- By revenue model, subscription video on demand held 45.23% of United States OTT market share in 2025, while advertising video on demand and free ad-supported streaming television channels are expanding at a 12.13% CAGR through 2031.
- By device type, smart televisions captured 39.86% of United States OTT market size in 2025 and are forecast to grow at a 12.93% CAGR to 2031.
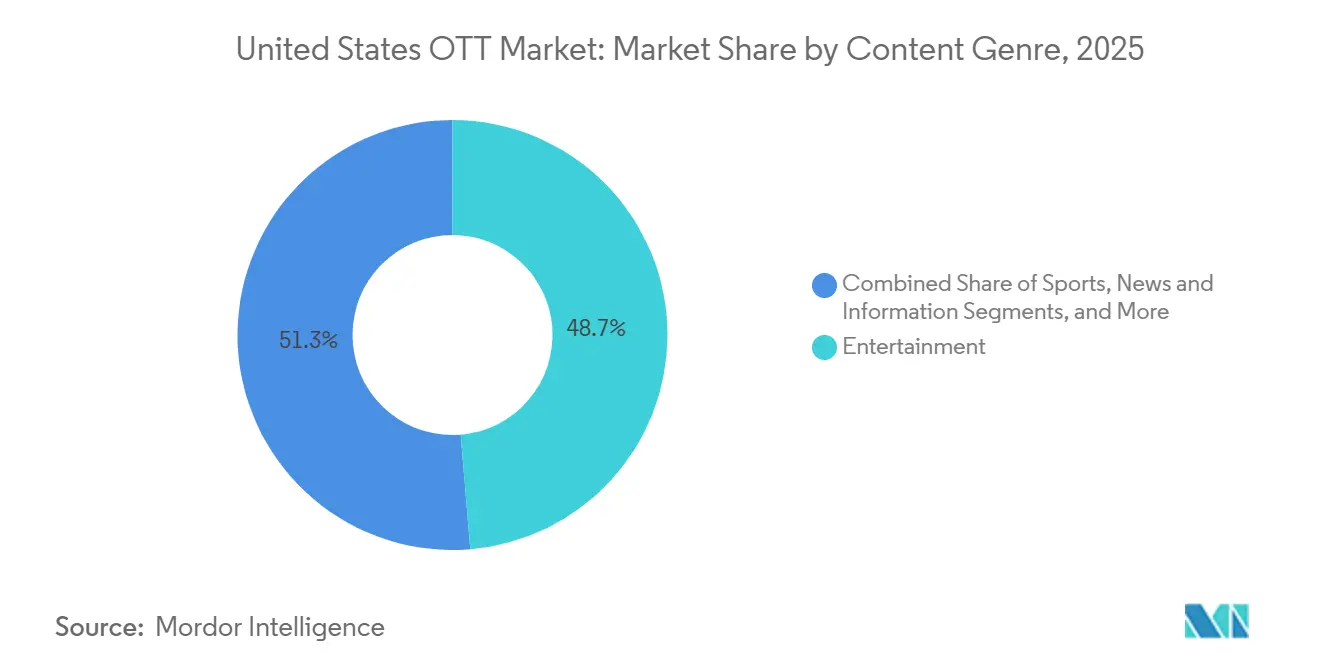
- By content genre, entertainment led with 48.68% revenue share in 2025; sports streaming is projected to accelerate at a 13.26% CAGR through 2031.
- By age group, the 18-34 cohort represented 37.13% viewership share in 2025, but the under-18 segment is posting the highest growth at a 14.21% CAGR.
Note: Market size and forecast figures in this report are generated using Mordor Intelligence’s proprietary estimation framework, updated with the latest available data and insights as of January 2026.
United States OTT Market Trends and Insights
Drivers Impact Analysis*
| Driver | (~) % Impact on CAGR Forecast | Geographic Relevance | Impact Timeline |
|---|---|---|---|
| Rising cord-cutting rates among US households | +2.8% | United States national, urban and suburban | Medium term (2-4 years) |
| Rapid expansion of fiber and 5G networks | +2.1% | United States national, metro and Tier 1 cities | Short term (≤ 2 years) |
| Shift toward ad-supported and hybrid models | +2.5% | United States national, cost-conscious and younger demographics | Medium term (2-4 years) |
| Adoption of AI-powered hyper-personalization | +1.6% | United States national, platform dependent | Medium term (2-4 years) |
| Emergence of niche SVOD services | +1.3% | Diverse metropolitan regions and ethnic enclaves | Long term (≥ 4 years) |
| Tax incentive programs for in-state production | +0.9% | State level, led by Georgia, New York, California | Long term (≥ 4 years) |
| Source: Mordor Intelligence | |||
Rising Cord-Cutting Rates Among US Households Accelerating Direct-to-Consumer Adoption
Cord-cutting surpassed 46% of U.S. internet households in 2025, equating to roughly 56 million homes that have severed cable subscriptions. A further 12% are “cord-nevers,” having bypassed pay-TV altogether. Ad budgets follow these viewers to connected TVs, yet inconsistent measurement standards hamper cross-platform attribution. Platforms in the US OTT market respond by deepening first-party data collection and experimenting with loyalty perks reminiscent of cable bundles. Sustained success hinges on exclusive premieres that keep monthly churn, now 5-6%, from rising further.
Rapid Expansion of Fiber and 5G Networks Enabling Higher-Quality Streaming
Federal grants and private capital pushed average fixed-line speeds beyond 250 Mbps in major metros during 2025, enabling consistent 4K and HDR playback and slashing buffering events.[1]Federal Communications Commission, “2025 Broadband Progress Report,” fcc.gov Latency reductions support interactive layers such as real-time polls and live betting overlays on sports streams in the US OTT market. Platforms upsell premium picture tiers, easing ARPU pressure, and users maintain multiple concurrent streams per household, extending total watch time.
Shift Toward Ad-Supported and Hybrid Models Expanding Audience Reach
More than half of new Disney+ sign-ups in 2025 chose the ad-supported tier. Netflix reported that its own ad plan drives 45% of viewing hours in regions where it is available. Light ad loads under five minutes per hour safeguard user experience, while granular targeting commands CPMs rivaling prime-time TV. As fill rates climb, ad-funded tiers are on course to out-earn flat-fee subscription plans on a per-user basis.
Adoption of AI-Powered Hyper-Personalization Increasing Average Watch Time and Retention
Netflix algorithms now influence 80% of viewing decisions, learning from pause length, rewind frequency, and time-of-day viewing. Disney’s 2025 partnership with OpenAI will allow subscribers to create short clips starring classic characters, a feature set to debut in 2026. Such personalization reduces search friction, critical as the average time users spend hunting for content reached 12 minutes in 2025. Platforms that surface relevant titles quickly post higher retention and lower marketing spend.
Restraints Impact Analysis*
| Restraint | (~) % Impact on CAGR Forecast | Geographic Relevance | Impact Timeline |
|---|---|---|---|
| Growing content licensing costs squeezing margins | -1.7% | United States national, platforms lacking owned studios | Medium term (2-4 years) |
| Market saturation and subscriber churn | -1.4% | United States national, mature urban and suburban markets | Short term (≤ 2 years) |
| Declining content discoverability | -0.8% | United States national, impacts smaller services | Medium term (2-4 years) |
| Rising carbon footprint scrutiny | -0.5% | United States national, early regulation in California | Long term (≥ 4 years) |
| Source: Mordor Intelligence | |||
Growing Content Licensing Costs and Competition for Premium IP Squeezing Margins
Netflix earmarked USD 17 billion for content in 2025, a figure that includes record bids for National Football League rights.[2]Netflix Inc., “Q4 2025 Shareholder Letter,” netflix.com Inflation persists because premium intellectual property supply grows slowly while bidder counts soar. The proposed Netflix-Warner Bros. merger seeks to curtail third-party licensing by owning production outright. Smaller platforms facing the same cost spiral pivot toward niche libraries or risk forced consolidation.
Market Saturation and Subscriber Churn Fueled by Low Switching Costs
Monthly churn hit 5-6 percent across major services in 2025. Crackdowns on password sharing briefly inflated cancellations before incremental account conversions stabilized revenue. As household subscription penetration nears 100%, competitive focus shifts to retention via stacked release calendars, gamified rewards, and deeper personalization.
*Our forecasts treat driver/restraint impacts as directional, not additive. The impact forecasts reflect baseline growth, mix effects, and variable interactions.
Segment Analysis
By Revenue Model: Hybrid Monetization Extends Reach
Subscription video on demand controlled 45.23% of United States OTT market share in 2025, yet ad-supported and free channels are advancing at a 12.13% CAGR. The United States OTT market size attributable to advertising-funded services is positioned to more than double by 2031. Disney disclosed that 112 million of its 157 million global ad-supported monthly active users reside in the United States. Younger viewers are willing to tolerate ads for reduced fees, while older viewers retain ad-free tiers. Diversified monetization spreads risk across consumer wallets and advertising budgets.
Platforms optimize CPM yield via contextual ad targeting, dynamic insertion, and frequency capping. Over time, hybrid models create upgrade ladders, free sampling entices new users, who can later convert to ad-light or premium plans. To execute this strategy, services require sophisticated inventory management and real-time bidding integrations, capabilities that now differentiate market leaders from smaller challengers.


By Device Type: Smart Televisions Anchor Household Viewing
Smart televisions accounted for 39.86% share of United States OTT market in device-based viewing in 2025 and are forecast to grow at a 12.93% CAGR. Larger screens and lean-back ergonomics extend average session length, raising ad impressions and elevating CPMs. Connected-TV advertising generated USD 15 billion in U.S. revenue in 2025 and is climbing faster than any other digital video segment. Mobile devices still dominate discovery, with teens watching trailers on smartphones before casting to television screens. Game consoles and dongles remain relevant as aggregation layers but concede share as next-generation television operating systems embed the same functionality.
Interface design increasingly features horizontal navigation, user-profile switching, and voice queries. Platforms also roll out low-bandwidth modes that maintain picture quality on legacy panels, supporting rural adoption. The coexistence of cast-enabled mobile discovery and television playback cements streaming as a whole-home experience, making smart-TV optimization a strategic imperative.
By Content Genre: Live Sports Drive Premium Retention
Entertainment titles maintained 48.68% share in 2025, but sports streaming is climbing at a 13.26% CAGR in the United States OTT market. YouTube TV spent an estimated USD 2 billion annually to secure National Football League Sunday Ticket beginning in 2025. Peacock’s exclusive National Football League Wild Card broadcast drew 20 million streamers, demonstrating live sports’ pull in subscription decisions. Rights fragmentation compels fans to manage multiple subscriptions, lifting ARPU yet risking fatigue.
Documentaries, news, and reality formats provide year-round engagement. CNN rolled out CNN All Access at USD 6.99 per month in 2025, targeting viewers willing to pay for ad-free journalism. Faith-based and multicultural catalogs broaden addressable segments inexpensively, as licensing costs are modest compared with big-budget series. Diversified genre slates buffer platforms against seasonal lulls and shifts in viewer moods.
By Age Group: Gen Z Sets the Pace
Millennials aged 18-34 generated 37.13% of 2025 viewing hours. However, the under-18 cohort is expanding fastest at a 14.21% CAGR, propelled by Gen Z affinity for short-form and creator-driven content in the United States OTT market. A survey by Piper Sandler in 2025 showed 60% of teens prefer free ad-supported streaming over paid subscriptions. Platforms integrate social sharing, co-watch rooms, and interactive polls to attract this segment.
Households aged 35-54 hold higher disposable incomes and maintain three or more subscriptions on average. Adults over 55 adopted streaming at an 88% penetration rate in 2025, gravitating to smart-TV interfaces and bundled services like Amazon Prime Video that include shipping benefits. Tailored onboarding flows with larger fonts and simplified navigation mitigate churn in this demographic.
Geography Analysis
Geography Analysis
Infrastructure disparities dictate regional growth potential. Gigabit fiber blankets coastal metros and Sunbelt growth centers, enabling 4K streams and interactive sports overlays. Rural areas still face limited bandwidth, constraining resolution and the number of simultaneous streams, though targeted grants are narrowing this divide. Digital divide reduction efforts added 6 million newly addressable homes to the streaming universe in 2025.
State subsidies reshape production footprints. Georgia’s 30% tax credit attracted USD 4 billion in filming spend during 2025.[3]Georgia Department of Economic Development, “Georgia Film Tax Credit Overview,” georgia.org New York’s matching incentive preserved its status as an East-Coast hub, while California raised its credit to 25% to stem outflows. Content houses follow subsidy dollars, building soundstages and post-production suites near these hubs, which in turn localizes job creation and ancillary spending in the United States OTT market.
Demographics also vary. Miami, Houston, and Los Angeles host large Hispanic communities, driving up demand for bilingual catalogs and Spanish-language UIs. Services catering specifically to African American and Asian American audiences gained traction in Atlanta and San Francisco, respectively, signaling that regional and cultural tastes increasingly influence catalog decisions. Early sustainability regulations emerged in California and several northeastern states, prompting platforms to locate new data centers in renewable-energy zones.
Competitive Landscape
Netflix’s USD 72 billion bid for Warner Bros. Discovery merges two of the deepest libraries in streaming, promising USD 2-3 billion in annual synergies once overlapping technology and support roles are rationalized. Regulators will weigh the combined entity’s bargaining power over content distribution, but proponents argue that free ad-supported options maintain competitive balance in the US OTT market.
Disney plans to fold Hulu into Disney+ by 2026, integrating Marvel, Star Wars, and general entertainment into one interface. Early trials of “Hulu on Disney+” lifted average viewing hours per subscriber by double digits in 2024-2025. Amazon leverages bundled Prime perks to keep churn below industry averages; Prime Video’s share among viewers over 55 surpassed Netflix for the first time in 2025.
Free ad-supported services such as YouTube, Tubi, and The Roku Channel grew combined smart-TV watch time by 53% between December 2023 and November 2025, now commanding 18% of total television streaming. Their low-cost licensing and programmatic ad sales yield attractive margins and apply price pressure on paid incumbents. Smaller subscription services offer cheaper, limited-ad tiers but risk cannibalizing premium plans if their differentiation weakens.
United States OTT Industry Leaders
-
Netflix Inc.
-
Disney+ (The Walt Disney Company)
-
Amazon Prime Video (Amazon.com Inc.)
-
Hulu LLC
-
Max (Warner Bros. Discovery)
- *Disclaimer: Major Players sorted in no particular order

Recent Industry Developments
- December 2025: Netflix agreed to acquire Warner Bros. Discovery in a USD 72 billion cash-and-stock deal expected to close within 18 months.
- December 2025: Disney partnered with OpenAI to embed AI-generated character clips within Disney+, slated for 2026 rollout.
- November 2025: Disney signed a multi-year distribution pact with YouTube, extending Disney content to YouTube’s ad-supported ecosystem.
- October 2025: CNN launched ad-free CNN All Access at USD 6.99 per month or USD 69.99 annually.


Research Methodology Framework and Report Scope
Market Definitions and Key Coverage
Our study defines the United States over-the-top (OTT) market as all paid or ad-funded video and audio streaming services accessed through fixed or mobile broadband, encompassing subscription, transactional, and advertising revenue streams across connected TVs, smartphones, tablets, and personal computers.
Scope exclusion: Hardware sales such as streaming sticks, smart TVs, or set-top boxes are excluded.
Segmentation Overview
-
By Revenue Model
- Subscription Video on Demand (SVOD)
- Transactional Video on Demand (TVOD)
- Advertising Video on Demand (AVOD / FAST)
- Hybrid (Subscription + Ads)
-
By Device Type
- Smartphones and Tablets
- Smart TVs
- Laptops and Desktops
- Game Consoles
- Set-Top Boxes and Media Streamers
-
By Content Genre
- Entertainment (Movies and Series)
- Sports
- News and Information
- Kids and Educational
- Documentary and Reality
-
By Age Group
- <18 Years
- 18-34 Years
- 35-54 Years
- 55+ Years
Detailed Research Methodology and Data Validation
Primary Research
Mordor analysts interview platform executives, content licensors, ad-tech vendors, and consumer-electronics retailers across all U.S. regions. These conversations validate average selling prices, churn triggers, ad-load norms, and planned content-spend trajectories, filling gaps that public datasets leave open.
Desk Research
We start with public pillars: FCC broadband statistics, U.S. Census demographics, and Bureau of Economic Analysis consumer-spend tables, before layering usage metrics from entities such as Nielsen, Comscore, and the Interactive Advertising Bureau. Company 10-Ks, investor decks, and trade-association white papers deepen service-level insights, while paid access to Dow Jones Factiva and D&B Hoovers lets our team pull historic revenue splits and M&A activity. Patent abstracts from Questel help gauge tech investment in codecs and ad-insertion. This foundation supplies the channel footprints, adoption curves, and pricing bands that our analysts need. The sources cited here are illustrative; many additional references inform data checks and clarification.
Market-Sizing & Forecasting
A top-down demand pool is built from broadband household counts, average paid-OTT spend, and streaming ad CPM flows, which are then corroborated with bottom-up roll-ups of sampled subscriber volumes multiplied by prevailing ARPU. Key variables include penetration of connected TVs, ad-supported tier take-up, cord-cutting velocity, live-sports rights inflation, and average monthly churn. Multivariate regression models, stress-tested through three scenario blocks, project revenue to 2030. Outliers are re-benchmarked against primary feedback.
Data Validation & Update Cycle
Outputs undergo variance checks versus external benchmarks, followed by a two-step peer review. We refresh every twelve months and re-issue sooner if material events, like blockbuster consolidation or regulatory shifts, alter market math.
Why Mordor's US OTT Baseline Earns Unmatched Trust
Published estimates often diverge because each firm applies its own service mix, price uplift path, and refresh rhythm. Our disciplined scope, annual recrawl, and dual-approach modeling narrow that gap for decision-makers.
Key gap drivers include: some publishers counting only subscription video, others omitting ad-supported revenue, and several converting currencies at static rates that ignore dollar volatility; still others lock forecasts two years out, whereas we rerun models after major price hikes or sport-rights deals.
Benchmark comparison
| Market Size | Anonymized source | Primary gap driver |
|---|---|---|
| USD 122.44 bn (2024) | Mordor Intelligence | - |
| USD 61.9 bn (2024) | Global Consultancy A | Excludes AVOD and music streaming |
| USD 90.28 bn (2024) | Industry Data Firm B | Counts only consumer spend, omits advertising |
Taken together, the comparison shows that when scope breadth, fresh inputs, and currency realism converge, as we ensure at Mordor, the resulting baseline stays balanced, transparent, and repeatable for a wide range of strategic uses.


Key Questions Answered in the Report
How large is the United States OTT market in 2026?
The United States OTT market size reached USD 136.67 billion in 2026.
What is the expected growth rate for streaming services through 2031?
Aggregate revenue is projected to rise at an 11.42% CAGR between 2026 and 2031.
Which revenue model is growing fastest?
Ad-supported and hybrid tiers are expanding at a 12.13% CAGR, outperforming pure subscriptions.
Why are smart televisions important to streaming providers?
They account for 39.86% of 2025 viewing and deliver premium ad inventory that commands higher CPMs.
How will the Netflix–Warner Bros. deal affect content libraries?
The merger will combine two large catalogs, potentially lowering licensing outlays and boosting bargaining power.
Which demographic segment offers the highest growth potential?
Viewers under 18 are growing at a 14.21% CAGR, driven by Gen Z’s appetite for short-form and interactive formats.
Page last updated on:


